- Overall Rankings
- Corporate Taxes
- Individual Income Taxes
- Sales Taxes
- Property Taxes
- Unemployment Insurance Taxes
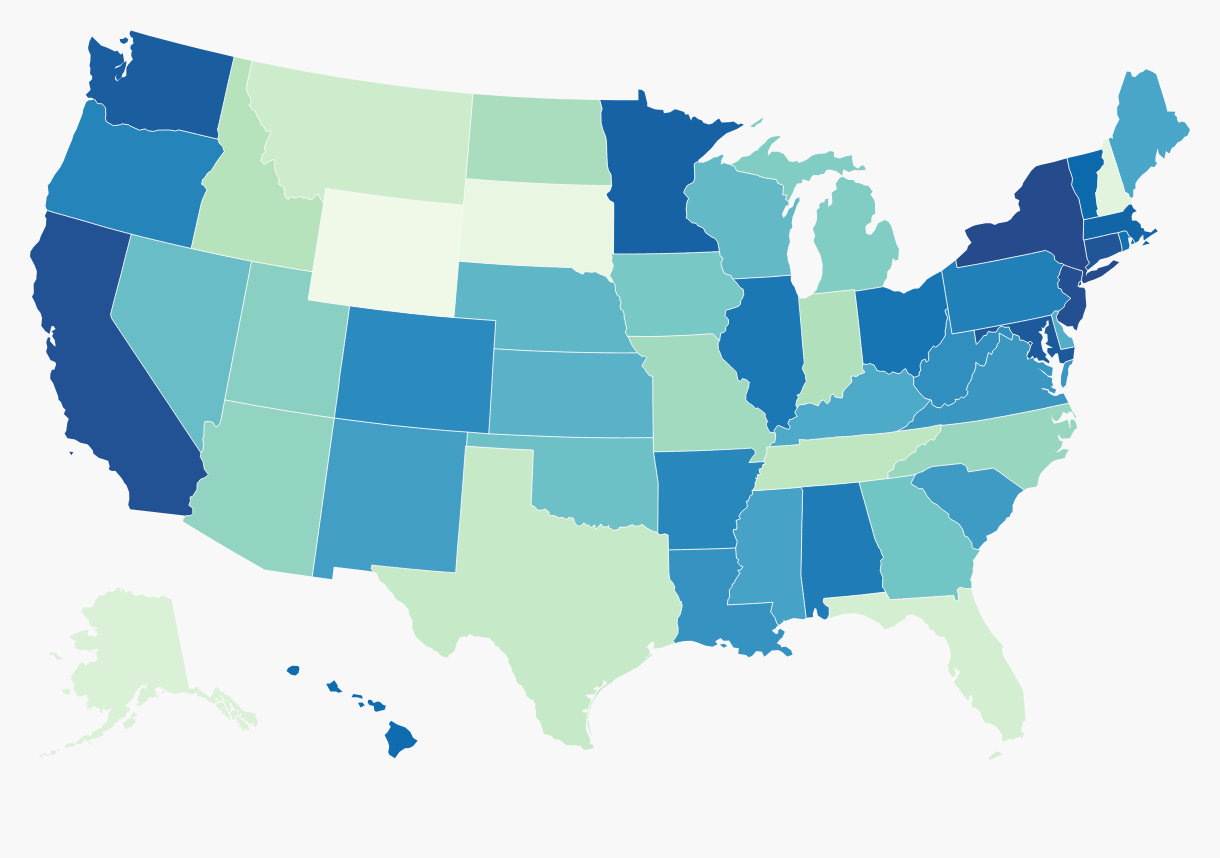
Overall Rankings
The State Tax Competitiveness Index compares each state on more than 150 variables in the five major areas of taxation (corporate taxes, individual income taxes, sales and excise taxes, property and wealth taxes, and unemployment insurance taxes and then adds the results to yield a final, overall ranking. This approach rewards states on particularly strong aspects of their tax systems (or penalizes them on particularly weak aspects), while measuring the general competitiveness of their overall tax systems. The result is a score that can be compared to other states’ scores.
Corporate Taxes
This component measures the impact of each state’s principal tax on business activities and accounts for 21.1 percent of each state’s total score. It includes corporate income taxes and gross receipts taxes. It is well established that the extent of business taxation can affect a business’s level of economic activity within a state.
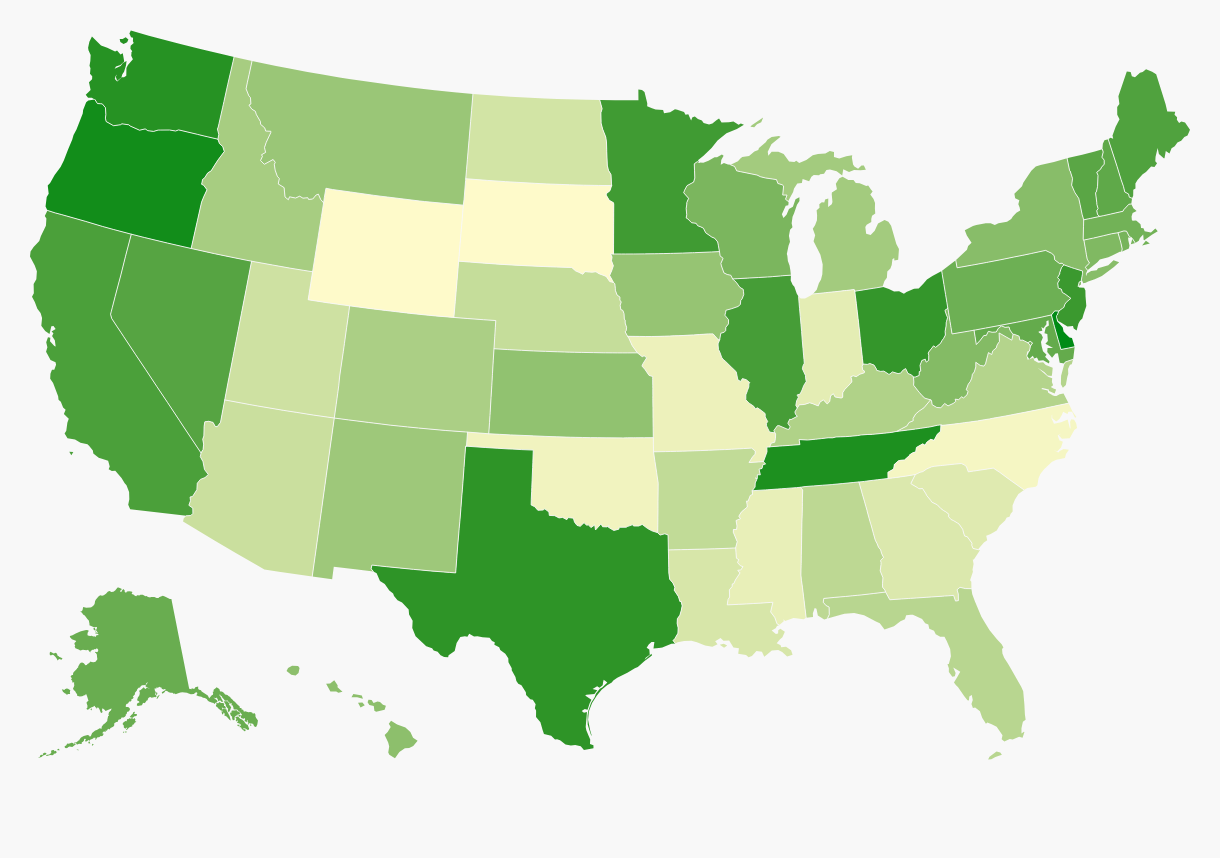
Individual Income Taxes
The individual income tax component, which accounts for 31.8 percent of each state’s total Index score, is important to both individuals and businesses because a significant number of businesses, including sole proprietorships, partnerships, and S corporations, report their income through the individual income tax code.
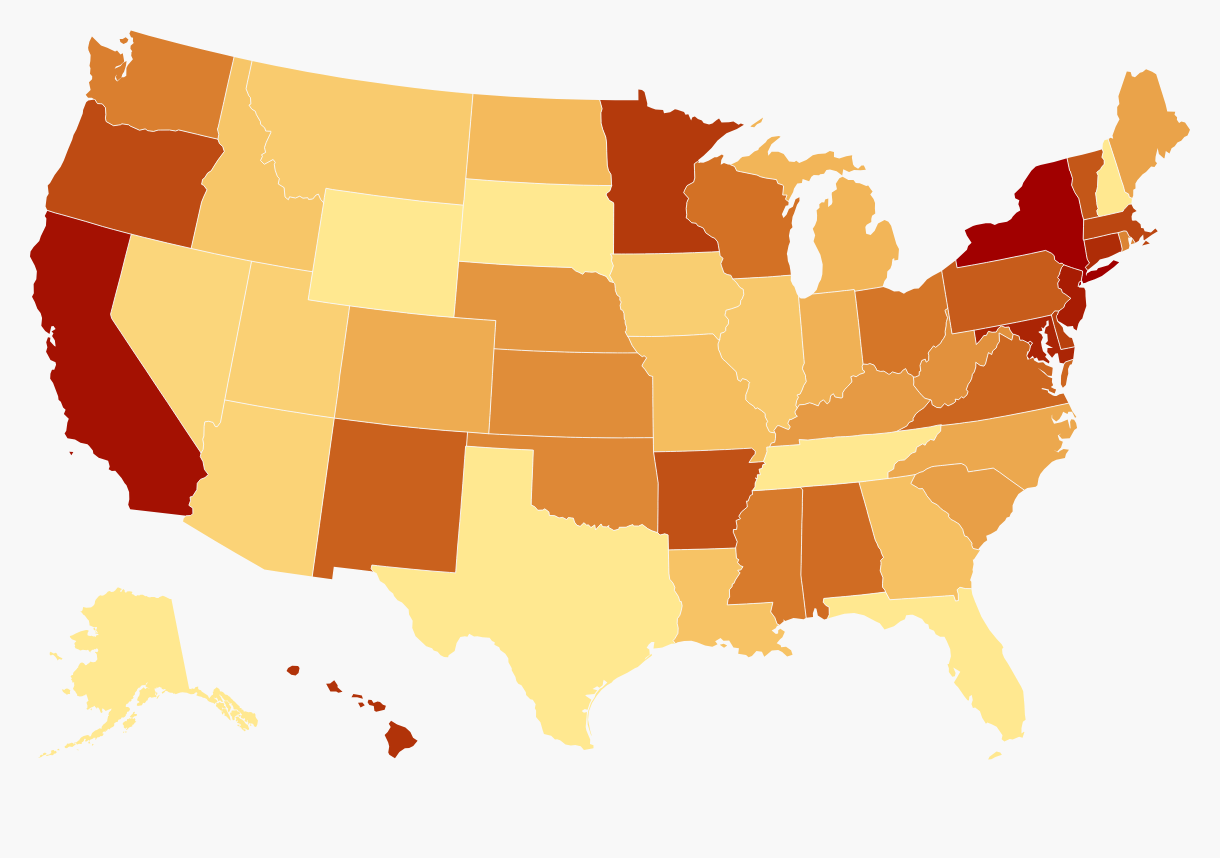
Sales Taxes
Sales tax makes up 21.2 percent of each state’s Index score. The type of sales tax familiar to taxpayers is a tax levied on the purchase price of a good at the point of sale. Due to the inclusion of some business inputs in most states’ sales tax bases, the rate and structure of the sales tax is an important consideration for many businesses. The sales tax can also hurt the business tax climate and tax competitiveness because as the sales tax rate climbs, customers make fewer purchases or seek low-tax alternatives. As a result, business is lost to lower-tax locations, causing lost profits, lost jobs, and lost tax revenue. The effect of differential sales tax rates among states or localities is apparent when a traveler crosses from a high-tax state to a neighboring low-tax state. Typically, a vast expanse of shopping malls springs up along the border in the low-tax jurisdiction.
Property Taxes
The property tax component, which includes taxes on real and personal property, net worth, and the transfer of assets, accounts for 14.5 percent of each state’s Index score. When properly structured, real property taxes exceed most other taxes in comporting with the benefit principle and can be fairly economically efficient. In the realm of public finance, they are often also prized for their comparative transparency among taxes, though that transparency may contribute to the public’s generally low view of property taxes.

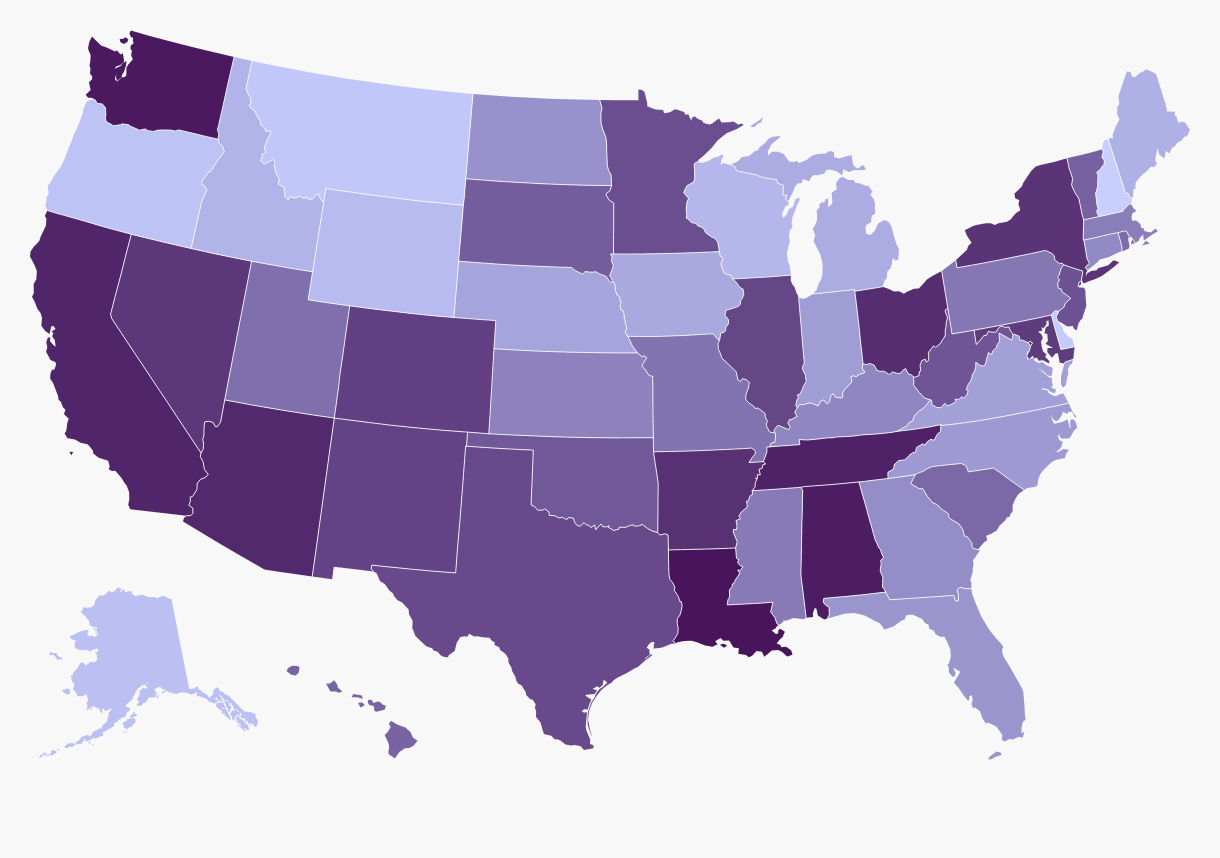
Unemployment Insurance Taxes
Unemployment insurance (UI) is a social insurance program jointly operated by the federal and state governments. Taxes are paid by employers into the UI program to finance benefits for workers recently unemployed. Compared to the other major taxes assessed in the State Tax Competitiveness Index, UI taxes are much less well-known. Every state has one, and all 50 of them are complex, variable-rate systems that impose different rates on different industries and different bases depending upon such factors as the health of the state’s UI trust fund.

2026 State Tax Competitiveness Index Ranks and Component Tax Ranks
| State | Overall Rank | Corporate Tax Rank | Individual Income Tax Rank | Sales Tax Rank | Property Tax Rank | Unemployment Insurance Tax Rank |
|---|---|---|---|---|---|---|
| Alabama | 37 | 16 | 35 | 48 | 18 | 19 |
| Alaska | 4 | 35 | 1 | 5 | 31 | 50 |
| Arizona | 14 | 13 | 9 | 45 | 10 | 1 |
| Arkansas | 34 | 15 | 40 | 43 | 16 | 10 |
| California | 48 | 41 | 49 | 46 | 27 | 26 |
| Colorado | 33 | 20 | 21 | 39 | 34 | 40 |
| Connecticut | 47 | 30 | 46 | 19 | 49 | 39 |
| Delaware | 24 | 50 | 43 | 2 | 2 | 2 |
| Florida | 5 | 17 | 1 | 16 | 20 | 8 |
| Georgia | 18 | 9 | 16 | 18 | 35 | 22 |
| Hawaii | 41 | 27 | 45 | 29 | 15 | 43 |
| Idaho | 9 | 21 | 14 | 8 | 3 | 36 |
| Illinois | 38 | 42 | 13 | 37 | 41 | 42 |
| Indiana | 10 | 7 | 20 | 14 | 4 | 15 |
| Iowa | 17 | 25 | 11 | 11 | 33 | 35 |
| Kansas | 23 | 26 | 28 | 21 | 26 | 4 |
| Kentucky | 25 | 19 | 25 | 20 | 30 | 30 |
| Louisiana | 31 | 10 | 15 | 50 | 22 | 9 |
| Maine | 26 | 40 | 23 | 9 | 45 | 21 |
| Maryland | 46 | 36 | 47 | 40 | 36 | 18 |
| Massachusetts | 43 | 33 | 42 | 22 | 48 | 45 |
| Michigan | 16 | 22 | 19 | 10 | 29 | 28 |
| Minnesota | 44 | 43 | 44 | 35 | 23 | 44 |
| Mississippi | 27 | 6 | 32 | 23 | 39 | 13 |
| Missouri | 12 | 5 | 17 | 25 | 12 | 5 |
| Montana | 6 | 24 | 12 | 3 | 17 | 25 |
| Nebraska | 22 | 14 | 26 | 12 | 46 | 3 |
| Nevada | 20 | 39 | 8 | 41 | 9 | 47 |
| New Hampshire | 3 | 37 | 1 | 1 | 44 | 23 |
| New Jersey | 49 | 44 | 48 | 34 | 42 | 46 |
| New Mexico | 28 | 23 | 37 | 38 | 1 | 17 |
| New York | 50 | 28 | 50 | 42 | 47 | 38 |
| North Carolina | 13 | 3 | 22 | 15 | 21 | 7 |
| North Dakota | 11 | 11 | 18 | 17 | 6 | 14 |
| Ohio | 39 | 45 | 33 | 44 | 5 | 11 |
| Oklahoma | 19 | 4 | 29 | 32 | 11 | 6 |
| Oregon | 35 | 49 | 41 | 4 | 28 | 41 |
| Pennsylvania | 36 | 34 | 38 | 24 | 13 | 34 |
| Rhode Island | 40 | 32 | 30 | 27 | 43 | 48 |
| South Carolina | 29 | 8 | 24 | 28 | 40 | 27 |
| South Dakota | 2 | 1 | 1 | 31 | 8 | 20 |
| Tennessee | 8 | 48 | 1 | 47 | 32 | 16 |
| Texas | 7 | 46 | 1 | 36 | 38 | 31 |
| Utah | 15 | 12 | 10 | 26 | 14 | 29 |
| Vermont | 42 | 38 | 39 | 30 | 50 | 12 |
| Virginia | 30 | 18 | 36 | 13 | 24 | 37 |
| Washington | 45 | 47 | 31 | 49 | 25 | 49 |
| West Virginia | 32 | 29 | 27 | 33 | 19 | 24 |
| Wisconsin | 21 | 31 | 34 | 7 | 7 | 32 |
| Wyoming | 1 | 1 | 1 | 6 | 37 | 33 |
| District of Columbia | 48 | 32 | 46 | 43 | 47 | 24 |
Source: Tax Foundation.
Notable Changes
-
Delaware fell four places overall (to 24th) as other states implemented substantial reforms while Delaware largely stood still. Delaware is hampered by being one of only two states to impose both income taxes and a state-level gross receipts tax, and by having a comparatively low unemployment trust fund solvency ratio, among other factors.
-
Georgia’s corporate income tax and individual income tax rates continued to phase down in 2025, with both declining from 5.39 to 5.19 percent. These rates will continue to decrease in the coming years if the state meets certain revenue goals. The rate reductions drove a 3-spot improvement in the state’s corporate income rank, a 1-place improvement in its individual income tax rank, and an improvement from 23rd to 22nd overall. Although it did not improve the property tax rank, Georgia also increased its tangible personal property tax de minimis exemption from a low $7,500 to a more generous $20,000.
-
Idaho, which has implemented a range of reforms in recent years, reduced its now-flat individual and corporate income tax rates from 5.695 to 5.3 percent in 2025, boosting it two additional places on the Index, moving from 11th to 9th overall.
-
Indiana’s state individual income tax rate decreased from 3.05 to 3 percent in 2025, but rising local income tax rates, paired with rate reductions in other states—including Louisiana, which also adopted a 3 percent single-rate income tax in 2025—saw Indiana’s overall rank fall slightly, from 9th to 10th. Future planned rate reductions to 2.9 percent should help the Hoosier State, if not offset by further income tax increases at the local level.
-
Illinois added global intangible low-taxed income (GILTI) to its tax base, which has since transitioned to a tax on net CFC-tested income (NCTI) at the federal level due to changes under the One Big Beautiful Bill Act (OBBBA). This change reduced Illinois’ score on our Index, but not enough to change its rank.
-
Iowa improved two places on the Index, from 19th to 17th overall, as the state implemented a flat 3.8 percent individual income tax in 2025. This represents the continuation of several years of ongoing reforms that have seen a dramatic improvement in Iowa’s rankings. The state’s corporate tax component rank slid as other states made improvements, but the planned consolidation of the state’s corporate income tax brackets into a 5.5 percent single-rate tax will further improve Iowa’s rankings in the coming years.
-
Louisiana improved six ranks on the 2026 Index, with further improvement expected in next year’s edition, due to reforms adopted in a late 2024 special session focused on tax competitiveness. Lawmakers enacted sweeping reform, which included a new flat individual income tax rate of 3 percent, a corporate income tax rate of 5.5 percent, and permanent full expensing. These reforms improved Louisiana from 31st to 15th on the individual income tax component of the Index and from 29th to 10th on the corporate tax component. In 2026, the state’s franchise (capital stock) tax will be repealed, and Louisiana will conform to ordinary treatment of S corporations rather than requiring them to file as C corporations, both of which will yield meaningful further improvement in the state’s Index rank.
-
Maine improved from 31st to 26th, primarily due to a decline in property tax collections as a percentage of personal income at a time when most states saw significant increases in property tax collections due to soaring assessed values insufficiently offset by mill levy (rate) reductions.
-
Maryland adopted the nation’s most aggressive package of tax increases in 2025. Lawmakers added two additional tax brackets on high earners, yielding a top marginal individual income tax rate of 6.5 percent, while also increasing the cap on county income tax rates to 3.3 percent. The state also established a 2 percent surtax on high earners’ capital gains, and imposed a new alternate-rate 3 percent sales tax on data, IT, and other business-to-business digital services. These changes dropped Maryland from 45th to 46th overall, sliding one place on the individual income tax component (from 46th to 47th) and five places on the sales tax component (from 35th to 40th).
-
Michigan’s overall rank slid two places, partially due to new targeted corporate incentives but mostly from rate competition in other states, with several—particularly Georgia, Idaho, Louisiana, Nebraska, and Utah—lowering individual and corporate income tax rates while Michigan did not.
-
Montana slid one place on the 2026 Index, from 5th to 6th. The state implemented a tiered property tax structure with different rates applying depending on the value of the property, effectively shifting the tax burden rather than providing meaningful relief. Simultaneously, New Hampshire leapfrogged Montana and several other high-ranking states on the Index with the repeal of its tax on interest and dividend income.
-
Nebraska improved one place on the Index, from 22nd to 21st, in part due to a reduction in the state’s top marginal individual income tax rate to 5.2 percent. In 2026, the individual income tax rate will decrease from 4.99 percent, and the corporate rate will be trimmed to 4.55 percent, with further reductions scheduled for 2027.
-
New Hampshire joined the ranks of states without an individual income tax with the elimination of its interest and dividends (I&D) tax on January 1, 2025. As a result, New Hampshire improved three places overall and 12 places on the individual income tax component.
-
New Mexico cut against broader national trends in enacting a corporate income tax increase by eliminating the benefit of a 4.8 percent lower rate and taxing all corporate income at 5.9 percent, but the state’s two-place slide in the Index was not driven by this policy change, but rather by improvements in the tax structures of competitor states.
-
Ohio improved two places, from 35th to 33rd, on the individual income tax component as the state’s top individual income tax rate declined from 3.5 percent to 3.125 percent. However, while this is among the lower top rates among income-taxing states, Ohio municipalities and school districts also possess individual income tax authority, yielding much higher combined rates than would be indicated by state rates alone. Next year, Ohio’s two remaining individual income tax rates will be consolidated as the state adopts a flat-rate 2.75 percent income tax.
-
For the second year in a row, Oregon’s rank dropped due to competitive reforms in other states as Oregon stood still. At the time of publication, Oregon lawmakers were considering changes in conformity to the federal Internal Revenue Code that could further harm the state’s tax competitiveness in future years.
-
In recent years, Pennsylvania has adopted meaningful reforms to its corporate income tax system, including aligning its previously stingy net operating loss (NOL) carryforwards with federal standards and phasing in reductions to the corporate income tax rate, which once stood at 9.99 percent. In 2025, the corporate rate fell from 8.49 to 7.99 percent, with future 0.5 percentage point reductions scheduled until the rate reaches 4.99 percent. Pennsylvania improved two places on the corporate tax component with this year’s rate reduction.
-
Rhode Island’s net operating loss (NOL) carryforward period was increased from 5 to 20 years, effective January 1, 2025, improving its corporate tax component ranking by three places. Additionally, the state recently increased its fuel and cigarette excise tax rates, hurting its sales and excise tax ranking. However, Rhode Island’s overall ranking did not change.
-
As part of a larger budget bill, South Carolina temporarily reduced its top individual income tax rate from 6.2 percent to 6 percent, effective July 1, 2025, and lasting until July 1, 2026. However, this change did not drive an improvement in the state’s individual income or overall scores due to movement from other states.
-
Utah lawmakers continue to implement incremental reductions in the state’s individual and corporate income tax rates. The reductions in 2025, from 4.55 to 4.5 percent for both taxes, were enough to improve Utah’s overall Index rank from 16th to 15th.
-
In Washington, lawmakers implemented a new 9.9 percent rate on the capital gains tax, causing the state to slide two places on the individual income tax component of the Index. The state’s top estate tax rate—already tied for the nation’s highest—was also increased from 20 to 35 percent. Nevertheless, a host of tax increases in Maryland resulted in Washington swapping places with it and improving by one rank. Washington’s adoption of new sales taxes on business purchases of digital products, including digital advertising, went into effect on October 1, after the July 1, 2025, snapshot date of this Index, but will affect Washington’s rank in future editions.
State Tax Competitiveness Index (2020-2026)
| State | 2020 | 2021 | 2022 | 2023 | 2024 | 2025 Rank | 2025 Score | 2026 Rank | 2026 Score | 2025-2026 Rank | 2025-2026 Score |
|---|---|---|---|---|---|---|---|---|---|---|---|
| Alabama | 39 | 39 | 40 | 40 | 38 | 36 | 4.79 | 37 | 4.80 | -1 | 0.01 |
| Alaska | 3 | 3 | 3 | 3 | 3 | 3 | 6.96 | 4 | 6.93 | -1 | -0.03 |
| Arizona | 18 | 18 | 19 | 15 | 15 | 15 | 5.45 | 14 | 5.52 | 1 | 0.07 |
| Arkansas | 41 | 42 | 39 | 39 | 37 | 35 | 4.90 | 34 | 4.93 | 1 | 0.03 |
| California | 48 | 48 | 48 | 48 | 48 | 48 | 3.87 | 48 | 3.81 | 0 | -0.05 |
| Colorado | 22 | 23 | 21 | 28 | 33 | 32 | 5.00 | 33 | 4.97 | -1 | -0.03 |
| Connecticut | 47 | 47 | 47 | 47 | 47 | 47 | 4.14 | 47 | 4.17 | 0 | 0.03 |
| Delaware | 17 | 17 | 17 | 18 | 18 | 20 | 5.32 | 24 | 5.22 | -4 | -0.11 |
| Florida | 4 | 4 | 4 | 4 | 4 | 4 | 6.82 | 5 | 6.84 | -1 | 0.02 |
| Georgia | 28 | 27 | 29 | 29 | 32 | 23 | 5.24 | 18 | 5.38 | 5 | 0.14 |
| Hawaii | 37 | 38 | 41 | 42 | 41 | 41 | 4.55 | 41 | 4.56 | 0 | 0.01 |
| Idaho | 14 | 13 | 14 | 10 | 9 | 11 | 5.63 | 9 | 5.69 | 2 | 0.06 |
| Illinois | 32 | 32 | 33 | 33 | 36 | 38 | 4.77 | 38 | 4.78 | 0 | 0.01 |
| Indiana | 10 | 8 | 11 | 11 | 11 | 9 | 5.71 | 10 | 5.66 | -1 | -0.05 |
| Iowa | 43 | 41 | 37 | 36 | 22 | 19 | 5.35 | 17 | 5.40 | 2 | 0.06 |
| Kansas | 27 | 28 | 24 | 22 | 23 | 25 | 5.20 | 23 | 5.22 | 2 | 0.02 |
| Kentucky | 19 | 19 | 20 | 20 | 21 | 24 | 5.21 | 25 | 5.20 | -1 | -0.01 |
| Louisiana | 40 | 40 | 44 | 38 | 39 | 37 | 4.79 | 31 | 5.06 | 6 | 0.27 |
| Maine | 26 | 26 | 22 | 32 | 29 | 31 | 5.05 | 26 | 5.14 | 5 | 0.09 |
| Maryland | 42 | 43 | 46 | 45 | 45 | 45 | 4.39 | 46 | 4.20 | -1 | -0.20 |
| Massachusetts | 36 | 37 | 36 | 37 | 44 | 43 | 4.45 | 43 | 4.45 | 0 | 0.00 |
| Michigan | 12 | 11 | 12 | 14 | 14 | 14 | 5.52 | 16 | 5.44 | -2 | -0.08 |
| Minnesota | 46 | 46 | 45 | 44 | 42 | 42 | 4.49 | 44 | 4.44 | -2 | -0.05 |
| Mississippi | 29 | 29 | 30 | 30 | 31 | 27 | 5.08 | 27 | 5.12 | 0 | 0.04 |
| Missouri | 13 | 9 | 9 | 9 | 13 | 13 | 5.55 | 12 | 5.62 | 1 | 0.07 |
| Montana | 5 | 5 | 5 | 5 | 5 | 5 | 6.30 | 6 | 6.19 | -1 | -0.11 |
| Nebraska | 25 | 25 | 25 | 25 | 28 | 22 | 5.24 | 22 | 5.27 | 0 | 0.03 |
| Nevada | 16 | 16 | 16 | 17 | 17 | 18 | 5.36 | 20 | 5.34 | -2 | -0.03 |
| New Hampshire | 7 | 7 | 7 | 7 | 7 | 6 | 5.98 | 3 | 7.20 | 3 | 1.23 |
| New Jersey | 50 | 50 | 49 | 49 | 49 | 49 | 3.68 | 49 | 3.71 | 0 | 0.03 |
| New Mexico | 20 | 21 | 31 | 23 | 24 | 26 | 5.09 | 28 | 5.09 | -2 | 0.00 |
| New York | 49 | 49 | 50 | 50 | 50 | 50 | 3.60 | 50 | 3.65 | 0 | 0.05 |
| North Carolina | 11 | 10 | 10 | 12 | 12 | 12 | 5.61 | 13 | 5.62 | -1 | 0.01 |
| North Dakota | 9 | 14 | 13 | 13 | 10 | 10 | 5.64 | 11 | 5.62 | -1 | -0.02 |
| Ohio | 34 | 34 | 34 | 34 | 35 | 39 | 4.75 | 39 | 4.78 | 0 | 0.02 |
| Oklahoma | 23 | 22 | 27 | 21 | 19 | 17 | 5.37 | 19 | 5.37 | -2 | 0.00 |
| Oregon | 8 | 12 | 28 | 31 | 26 | 33 | 5.02 | 35 | 4.92 | -2 | -0.10 |
| Pennsylvania | 35 | 35 | 35 | 35 | 34 | 34 | 4.97 | 36 | 4.91 | -2 | -0.06 |
| Rhode Island | 44 | 44 | 42 | 41 | 40 | 40 | 4.68 | 40 | 4.69 | 0 | 0.01 |
| South Carolina | 31 | 30 | 32 | 26 | 30 | 29 | 5.06 | 29 | 5.09 | 0 | 0.03 |
| South Dakota | 1 | 2 | 2 | 2 | 2 | 2 | 7.64 | 2 | 7.71 | 0 | 0.07 |
| Tennessee | 38 | 36 | 8 | 8 | 8 | 8 | 5.94 | 8 | 6.04 | 0 | 0.10 |
| Texas | 6 | 6 | 6 | 6 | 6 | 7 | 5.98 | 7 | 6.11 | 0 | 0.12 |
| Utah | 15 | 15 | 15 | 16 | 16 | 16 | 5.42 | 15 | 5.48 | 1 | 0.06 |
| Vermont | 45 | 45 | 43 | 43 | 43 | 44 | 4.42 | 42 | 4.52 | 2 | 0.10 |
| Virginia | 24 | 24 | 26 | 27 | 25 | 28 | 5.04 | 30 | 5.07 | -2 | 0.03 |
| Washington | 33 | 33 | 38 | 46 | 46 | 46 | 4.25 | 45 | 4.21 | 1 | -0.04 |
| West Virginia | 30 | 31 | 23 | 24 | 27 | 30 | 5.04 | 32 | 5.06 | -2 | 0.02 |
| Wisconsin | 21 | 20 | 18 | 19 | 20 | 21 | 5.32 | 21 | 5.30 | 0 | -0.03 |
| Wyoming | 2 | 1 | 1 | 1 | 1 | 1 | 7.67 | 1 | 7.74 | 0 | 0.07 |
| District of Columbia | 47 | 47 | 48 | 48 | 48 | 48 | 4.05 | 48 | 4.14 | 0 | 0.08 |
Source: Tax Foundation.
Meet the Authors
-

Janelle Fritts is a Senior Policy Analyst with the Tax Foundation’s Center for State Tax Policy. She is the lead researcher on the annual State Tax Competitiveness Index and serves as a resource to policymakers in their efforts to modernize and improve the structures of their state tax codes. Her work has been cited in The New York Times, the Associated Press, Bloomberg, and numerous state media outlets across the country.
-

Jared Walczak is a Senior Fellow at the Tax Foundation, where he spent five years as Vice President of State Projects, and president of Walczak Policy Consulting.
-

Abir Mandal is a Senior Policy Analyst with the Tax Foundation’s Center for State Tax Policy, where he conducts research on state tax competitiveness, business taxation, and property tax structure. He co-authors the State Tax Competitiveness Index, the Tax Foundation’s flagship annual study ranking the tax systems of all 50 states. His empirical research analyzes how state tax structures shape interstate migration of households and capital, as well as local government finance.
-

Katherine Loughead is the Vice President of State Tax Policy at the Tax Foundation, where she oversees the state tax policy team’s research agenda and serves as a resource to policymakers in their efforts to modernize and improve the structure of their state tax codes.


Tax Data by State
Get facts about taxes in your state and around the US