Preface to the New Edition
The study before you, which has been published as the State Business TaxA tax is a mandatory payment or charge collected by local, state, and national governments from individuals or businesses to cover the costs of general government services, goods, and activities. Climate Index since 2003, has been rebranded as the State Tax Competitiveness Index to better reflect what it assesses: states’ overall tax competitiveness, not just the business tax climate. But this isn’t just an exercise in slapping a new title on the cover and calling it a day. Rather, we have reworked the Index from the ground up to make it a better product.
For more than two decades, the Index has helped policymakers evaluate their tax codes, serving as a road map for reform. Each year, the study underwent methodological refinements—which we always outlined—to capture changing elements of the tax code, like the introduction of global intangible low-taxed income or the design of remote seller taxes following the Supreme Court’s Wayfair decision. But the pace of change has been rapid in recent years, with the adoption of the federal Tax Cuts and Jobs Act, the Supreme Court’s Wayfair decision, the rise of remote work and other outgrowths of the global pandemic (including a roiling of unemployment insurance tax regimes), the adoption of a nation’s-first digital advertising tax, and an emerging interest in new or expanded taxes on wealth, unrealized gains, data, digital products, and more.
We saw a need to address these more comprehensively, and to provide additional granularity in our evaluation of tax provisions already encompassed by the Index. The old Index did its job well. Indeed, independent evaluations demonstrated a strong correlation between Index ranks and state economic outcomes. But we wanted to expand and refresh the publication before it got stale, to stay ahead of new developments in tax. A refresh also gave us a chance to better systematize and rebalance the treatment of a few outlier state tax provisions that had to be shoehorned into the methodology of prior editions.
But we didn’t stop with a name change and a methodological update. We also rethought the presentation of the Index’s treasure trove of tax policy information. The Index’s 150+ variables are no longer hidden away in appendix tables, and the online publication, formerly just an interactive map accompanied by a lengthy PDF, has been reimagined for a digital environment.
For the first time, each state receives its own summary, highlighting several of the most notable features of its tax code and explaining why it ranks as it does on the Index—along with some state-specific reforms that would improve its tax competitiveness. And users now have access to interactive, sortable, filterable datasets. We invite you to explore. See your state’s policy choices on every variable in the Index. Add another state or two and compare them. Or drill down to a single variable or set of variables and see how all states perform on them.
Because the new State Tax Competitiveness Index has a revised methodology, rankings have shifted a bit more than we usually see from year to year. Some of the change, of course, is simply because states have been incredibly busy recently, adopting significant changes to their tax code. And some of it owes to our methodological changes.
To ensure an apples-to-apples comparison, and in the interest of transparency, we have backcast states’ rankings under the new methodology going back five years prior to this current edition. These are the controlling rankings, and are the ones that should be cited to show actual movement by states in recent years. This is nothing new: we’ve always backcast to account for methodological revisions. What’s different this year is the scope of the change, as we’ve added more variables and made more adjustments than in prior years.
Readers interested in the details of what has changed are invited to read on to learn about our revised methodology, and for explanations of our variables. Most readers, however, will likely wish to jump ahead to the overall rankings, their state’s page, or the newly interactive datasets.
For all readers, we hope that this refreshed publication, the 2025 State Tax Competitiveness Index, will serve as a useful guide for navigating state tax policy. It ranks, both overall and across five subindices—individual income taxes, corporate taxes, sales, use, and excise taxes, property and wealth taxes, and unemployment insurance taxes—how states compete, and where each has room to improve. And for would-be reformers, our datasets (now much more accessible!) are an invaluable guide to how states structure their tax codes, and where they diverge—for good and for ill—from their peers.
Even a good road map, however, is not always a sufficient substitute for a guide. That’s why the Tax Foundation has a team of state tax experts whose primary purpose is to help educate policymakers and the public. As always, we invite you to reach out with your questions. That’s why we’re here.
Jared Walczak
Vice President of State Projects, Tax Foundation
Executive Summary
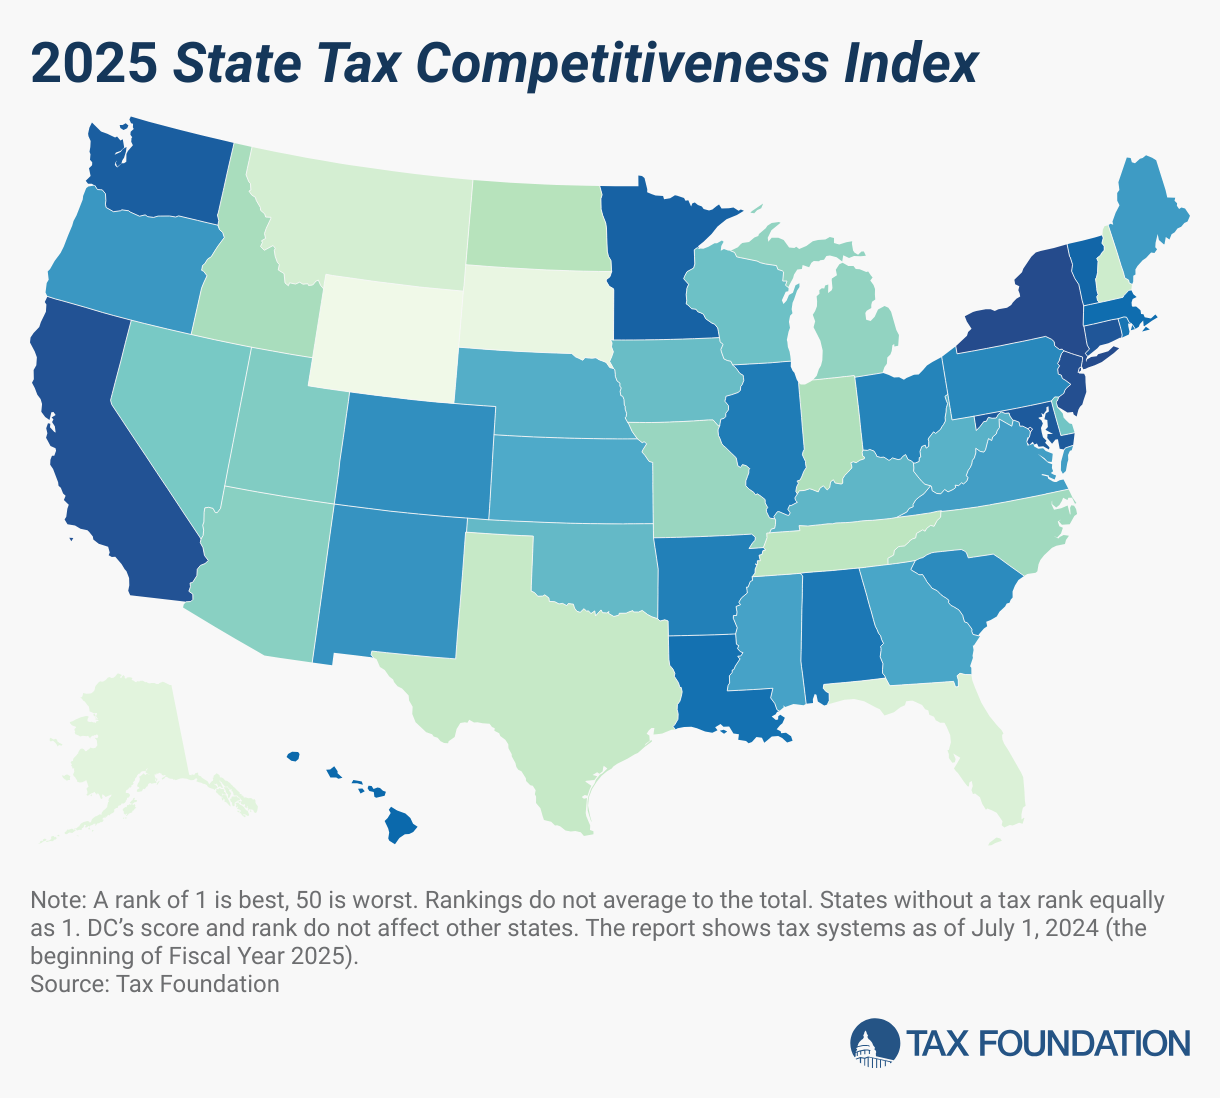
The Tax Foundation’s State Tax Competitiveness Index enables policymakers, taxpayers, and business leaders to gauge how their states’ tax systems compare. While there are many ways to show how much state governments collect in taxes, the Index evaluates how well states structure their tax systems and provides a road map for improvement.
The 10 best states in this year’s Index are:
The absence of a major tax is a common factor among many of the top 10 states. Property taxes and unemployment insurance taxes are levied in every state, but there are several states that do without one or more of the major taxes: the corporate income taxA corporate income tax (CIT) is levied by federal and state governments on business profits. Many companies are not subject to the CIT because they are taxed as pass-through businesses, with income reportable under the individual income tax. , the individual income taxAn individual income tax (or personal income tax) is levied on the wages, salaries, investments, or other forms of income an individual or household earns. The U.S. imposes a progressive income tax where rates increase with income. The Federal Income Tax was established in 1913 with the ratification of the 16th Amendment. Though barely 100 years old, individual income taxes are the largest source of tax revenue in the U.S. , or the sales taxA sales tax is levied on retail sales of goods and services and, ideally, should apply to all final consumption with few exemptions. Many governments exempt goods like groceries; base broadening, such as including groceries, could keep rates lower. A sales tax should exempt business-to-business transactions which, when taxed, cause tax pyramiding. . South Dakota and Wyoming have no corporate or individual income tax; Alaska has no individual income or state-level sales tax; Florida and Texas have no individual income tax; and New Hampshire and Montana have no sales tax, with New Hampshire also only imposing a narrow tax on interest and dividend income.
This does not mean, however, that a state cannot rank well while still levying all the major taxes. Indiana, for example, levies all the major tax types, as do all the other states that rank 11th to 16th: Idaho, North Carolina, Missouri, Arizona, Michigan, and Utah.
The 10 lowest-ranked, or worst, states in this year’s Index are:
- Massachusetts
- Hawaii
- Vermont
- Minnesota
- Washington
- Maryland
- Connecticut
- California
- New Jersey
- New York
The states in the bottom 10 tend to have a number of issues in common: complex, nonneutral taxes with comparatively high rates. New Jersey, for example, is hampered by some of the highest property taxA property tax is primarily levied on immovable property like land and buildings, as well as on tangible personal property that is movable, like vehicles and equipment. Property taxes are the single largest source of state and local revenue in the U.S. and help fund schools, roads, police, and other services. burdens in the country, has the highest-rate corporate income tax in the country, and has one of the highest-rate individual income taxes. Additionally, the state has a particularly aggressive treatment of international income, levies an inheritance taxAn inheritance tax is levied upon the value of inherited assets received by a beneficiary after a decedent’s death. Not to be confused with estate taxes, which are paid by the decedent’s estate based on the size of the total estate before assets are distributed, inheritance taxes are paid by the recipient or heir based on the value of the bequest received. , and maintains some of the nation’s worst-structured individual income taxes.
2025 State Tax Competitiveness Index Ranks and Component Tax Ranks
| State | Overall Rank | Corporate Tax Rank | Individual Income Tax Rank | Sales Tax Rank | Property Tax Rank | Unemployment Insurance Tax Rank |
|---|---|---|---|---|---|---|
| Alabama | 38 | 14 | 34 | 49 | 14 | 18 |
| Alaska | 3 | 34 | 1 | 5 | 30 | 45 |
| Arizona | 15 | 13 | 8 | 45 | 13 | 2 |
| Arkansas | 36 | 15 | 39 | 44 | 19 | 11 |
| California | 48 | 41 | 49 | 46 | 23 | 25 |
| Colorado | 32 | 10 | 18 | 37 | 36 | 39 |
| Connecticut | 47 | 31 | 47 | 21 | 50 | 40 |
| Delaware | 18 | 50 | 42 | 2 | 1 | 1 |
| Florida | 4 | 16 | 1 | 14 | 21 | 10 |
| Georgia | 26 | 12 | 31 | 23 | 34 | 24 |
| Hawaii | 42 | 25 | 46 | 28 | 24 | 49 |
| Idaho | 11 | 21 | 11 | 9 | 3 | 35 |
| Illinois | 37 | 42 | 13 | 38 | 41 | 43 |
| Indiana | 10 | 8 | 16 | 17 | 5 | 13 |
| Iowa | 20 | 23 | 19 | 11 | 32 | 33 |
| Kansas | 25 | 27 | 27 | 30 | 29 | 4 |
| Kentucky | 22 | 18 | 23 | 18 | 27 | 34 |
| Louisiana | 40 | 29 | 33 | 48 | 16 | 9 |
| Maine | 29 | 40 | 22 | 8 | 48 | 19 |
| Maryland | 46 | 37 | 45 | 39 | 35 | 20 |
| Massachusetts | 41 | 33 | 41 | 20 | 46 | 47 |
| Michigan | 14 | 9 | 14 | 12 | 28 | 26 |
| Minnesota | 44 | 43 | 44 | 34 | 26 | 42 |
| Mississippi | 27 | 6 | 32 | 25 | 38 | 15 |
| Missouri | 13 | 4 | 20 | 24 | 11 | 5 |
| Montana | 5 | 19 | 10 | 3 | 18 | 21 |
| Nebraska | 24 | 20 | 26 | 13 | 45 | 3 |
| Nevada | 17 | 39 | 7 | 40 | 7 | 46 |
| New Hampshire | 6 | 32 | 12 | 1 | 39 | 27 |
| New Jersey | 49 | 44 | 48 | 35 | 43 | 50 |
| New Mexico | 31 | 22 | 37 | 41 | 2 | 16 |
| New York | 50 | 28 | 50 | 42 | 47 | 37 |
| North Carolina | 12 | 3 | 21 | 16 | 20 | 7 |
| North Dakota | 9 | 7 | 17 | 15 | 4 | 12 |
| Ohio | 35 | 45 | 25 | 43 | 6 | 14 |
| Oklahoma | 21 | 5 | 28 | 32 | 15 | 6 |
| Oregon | 30 | 49 | 40 | 4 | 31 | 41 |
| Pennsylvania | 34 | 38 | 38 | 22 | 9 | 36 |
| Rhode Island | 39 | 35 | 30 | 26 | 37 | 48 |
| South Carolina | 33 | 11 | 24 | 33 | 42 | 28 |
| South Dakota | 2 | 1 | 1 | 31 | 10 | 22 |
| Tennessee | 8 | 48 | 1 | 47 | 33 | 17 |
| Texas | 7 | 46 | 1 | 36 | 40 | 30 |
| Utah | 16 | 17 | 9 | 27 | 12 | 29 |
| Vermont | 43 | 36 | 43 | 29 | 49 | 8 |
| Virginia | 28 | 24 | 36 | 10 | 22 | 38 |
| Washington | 45 | 47 | 15 | 50 | 25 | 44 |
| West Virginia | 23 | 26 | 29 | 19 | 17 | 23 |
| Wisconsin | 19 | 30 | 35 | 6 | 8 | 32 |
| Wyoming | 1 | 1 | 1 | 7 | 44 | 31 |
| District of Columbia | 48 | 32 | 47 | 41 | 48 | 25 |
Understanding the Index and Tax Competition
Tax competition is a little like WAR—not conflict, but Wins Above Replacement. The term comes from baseball, where it is intended as a sabermetric statistic to measure how many more wins a team can claim due to a specific player above the amount that would be generated by a replacement-level player. It’s much the same way in public finance: a well-structured tax code won’t make the Wyoming Basin a metropolis, nor will poor tax structure make Manhattan a ghost town. But tax structure does play a role in a state’s economic successes or failures, and often a substantial one. Every state can benefit from a simple, neutral, transparent, pro-growth tax structure.
The Index scores states across five subindices, each representing a major component of state tax codes: corporate taxes; individual income taxes; sales, use, and excise taxes; property and wealth taxes; and unemployment insurance taxes. Rather than weighting each subindex equally, their weight is determined according to the variance across states in each category, which has the effect of assigning more weight to areas where states have more opportunities in which to compete.
Of course, it is difficult to introduce any structural flaws to the design of a tax one does not impose, so some states, by forgoing a tax altogether (the individual income tax, the corporate income tax, or the sales tax) score perfectly on a subindex or some portion of one. This is why states like Wyoming and South Dakota, which both forgo income taxes, do so well on the Index. States that can avoid imposing one or more of the major taxes either have to lean very heavily on the other major tax types (which can mean lower rankings on those components), choose to operate on leaner budgets, take advantage of natural resources like oil and gas, or have demographics (like Florida) where other taxes can generate a surprising amount of revenue.
In other words, the Wyoming model may not be possible in some states—but the Indiana, Idaho, and North Carolina models are. These states all rank in the top 12 on the Index while imposing all of the major taxes, but at moderate rates with comparatively well-designed tax structures.
For taxpayers, the Index is a good starting point for understanding how their state compares to its peers. But for policymakers and others interested in how to improve the structure of their state’s tax code, it’s more than that: it’s a valuable diagnostic tool, with tables that allow readers to compare their state to its peers on a wide range of factors—tax rates, yes, but also throwback rules, the treatment of net operating losses, recapture provisions, indexation, spit roll taxation, convenience rules, expensing, and much more.
If you saddled South Dakota with New York’s tax code, the state would struggle. People are clearly willing to pay a premium to live in New York—on real estate, on consumer purchases, and yes, on taxes. But there are limits, to say nothing of the fact that a system that is bearable in Manhattan may be considerably more burdensome in Syracuse. And even in states like New York—in the post-pandemic recovery, perhaps especially in states like New York—tax burdens, and tax structures, matter.
Taxes are not everything, but they do matter, and they are within the control of policymakers. Even within a given revenue target, there are better and worse ways to raise revenue.
The Index measures tax structure, not all the other things businesses care about, like an educated workforce, quality of life, proximity to relevant markets, or even the weather—and some of these things involve trade-offs. Taxes, however, are an important part of the mix, and modernizing a state’s tax structure helps position it for growth. States that rank better on the Index have better-structured tax codes, and states with better-structured tax codes get Wins Above Replacement.
Notable Ranking Changes in This Year’s Index
Arkansas
Arkansas improved two places overall, from 38th to 36th, with the state reducing its top marginal corporate income tax rate from 5.1 percent to 4.3 percent and its top marginal individual income tax rate from 4.7 percent to 3.9 percent. Additionally, Arkansas consolidated its individual income tax bracketsA tax bracket is the range of incomes taxed at given rates, which typically differ depending on filing status. In a progressive individual or corporate income tax system, rates rise as income increases. There are seven federal individual income tax brackets; the federal corporate income tax system is flat. from three to two. This yielded a four-place improvement on the corporate component, from 19th to 15th, though the individual income tax rate reductions were not enough to secure an improvement in that component due to intense competition in other states.
California
California uncapped a 1.1 percent non-UI payroll taxA payroll tax is a tax paid on the wages and salaries of employees to finance social insurance programs like Social Security, Medicare, and unemployment insurance. Payroll taxes are social insurance taxes that comprise 24.8 percent of combined federal, state, and local government revenue, the second largest source of that combined tax revenue. , applying it to all income and functionally yielding a 14.4 percent top marginal rate on wage income. The state also re-suspended net operating loss carryforwards, making it once again the only state not to provide any ability to apply past losses to current or future year profits under the corporate income tax. These changes did not, however, budge the state’s overall rank of 48th, after only New York and New Jersey.
Colorado
Despite a continued trimming of state income tax rates from 4.4 to 4.25 percent, Colorado slid slightly in Index rankings as other states not only cut rates more deeply but also implemented other reforms.
Connecticut
Connecticut’s capital stock tax rate declined from 0.31 to 0.26 percent, not enough to change the state’s rankings, though the eventual phaseout of the tax will have a positive effect on the state’s Index ranks.
Georgia
In 2024, Georgia transitioned from a graduated individual income tax with a top rate of 5.75 percent to a flat taxAn income tax is referred to as a “flat tax” when all taxable income is subject to the same tax rate, regardless of income level or assets. structure with a rate of 5.39 percent. The corporate income tax rate, per H.B. 1023, is now aligned with the individual income tax rate. Both rates are also scheduled to decrease to 4.99 percent by 2028. As a result of these structural reforms, Georgia moved up six places overall on the Index, including three places on the individual income tax component and two places on the corporate tax component.
Idaho
Idaho’s individual and corporate income tax rates declined from 5.8 to 5.695 percent, though due to rate relief and structural reforms in other states, these rate reductions did not improve the state’s rankings.
Indiana
Indiana’s individual income tax rate decreased from 3.15 percent in 2023 to 3.05 percent in 2024 due to H.B. 1001, enacted in May 2023. The rate is scheduled to drop to 2.9 percent by 2027. Indiana also implemented a filing and withholdingWithholding is the income an employer takes out of an employee’s paycheck and remits to the federal, state, and/or local government. It is calculated based on the amount of income earned, the taxpayer’s filing status, the number of allowances claimed, and any additional amount the employee requests. threshold to protect nonresidents who spend up to 30 days in the state and removed the transactions threshold from its definition of economic nexus, providing additional protection for small remote retailers. As a result, the state now ranks 10th overall on the Index, an improvement of two places, and improved from 20th to 16th on the individual income tax component.
Iowa
Iowa improved two places overall, to 20th, as the state continues to implement meaningful reforms. The corporate income tax phased down from 8.3 to 7.1 percent, resulting in an improvement of five places on the corporate component of the Index. A reduction of the top individual income tax rate from 6.0 to 5.7 percent, combined with a reduction in brackets from four to three, did not yield an improvement in the individual component rank since other states made larger changes. However, Iowa can expect continued gains as reforms continue to phase in, particularly once the state reaches its target of a 3.8 percent single-rate individual income tax. The state has improved its overall rank from 44th to 20th, its individual rank from 42nd to 19th, and its corporate rank from 45th to 23rd since 2020 thanks to a multi-year comprehensive reform package that continues to phase in. Beginning in 2025, Iowa will fully repeal its inheritance tax and implement a 3.8 percent flat individual income tax, both of which will substantially improve the state’s rankings.
Kansas
Kansas improved one place on the individual component due to the passage of S.B. 1 in June 2024, which retroactively reduced the top marginal rate from 5.7 to 5.58 percent, consolidated three brackets into two, and increased the standard deductionThe standard deduction reduces a taxpayer’s taxable income by a set amount determined by the government. It was nearly doubled for all classes of filers by the 2017 Tax Cuts and Jobs Act (TCJA) as an incentive for taxpayers not to itemize deductions when filing their federal income taxes. , personal exemption, and dependent exemption, among other tax changes. The corporate income tax rate also declined from 7 to 6.5 percent, though this did not improve the state’s rank on the corporate component.
Kentucky
Kentucky’s individual income tax rate declined from 4.5 to 4.0 percent as part of a continued revenue-contingent phasedown of income tax rates, with each phased reduction subject to an affirmative vote of the legislature. These changes helped Kentucky improve by one Index rank overall.
Louisiana
The Louisiana legislature eliminated the state’s throwout rule, which taxes “nowhere income” in the state from which sales are made because the seller lacks sufficient nexus to be taxed in the destination state, leading to taxation in the wrong state at the wrong rate. This change improved the state’s corporate component ranking by two places, from 31st to 29th.
Minnesota
Minnesota is now the only state to tax long-term capital gains at a higher rate than ordinary income (excepting Washington, which taxes high earners’ capital gains income but not wage income), with the state sliding two places overall on the Index.
Mississippi
Mississippi improved two places on the Index, from 29th to 27th, as its capital stock (franchise) tax rate declined from 0.1 to 0.075 percent and its now-flat individual income tax rate phased down from 5 to 4.7 percent, on the way to an ultimate rate of 4 percent. The franchise tax is also scheduled for complete elimination.
Missouri
A slight trimming of Missouri’s top individual income tax rate, from 4.95 to 4.8 percent, was enough to maintain the state’s overall rank of 13th, but not to improve it in a highly competitive tax environment.
Montana
In 2021, Montana lawmakers enacted legislation compressing the state’s seven individual income tax brackets into two and reducing the top marginal rate to 6.5 percent in 2024. Policymakers subsequently enhanced the rate reduction, bringing the top rate to 5.9 percent. Combined with high nonresident income tax filing and withholding thresholds and a well-structured income tax generally, these changes drove a dramatic improvement in the individual income tax component rank, from 22nd to 10th place.
Nebraska
Continued rate relief in Nebraska yielded a ranking improvement of four places overall, from 28th to 24th, as individual and corporate income tax rates both declined substantially to 5.84 percent. These rate reductions resulted in a seven-place improvement on the corporate component, from 27th to 20th, and an improvement of three places, from 29th to 26th, on the individual income tax component of the Index.
New Hampshire
With the enactment of S.B. 189 in July 2023, New Hampshire decoupled from the federal limitation on the deductibility of business net interest expenses under IRC Section 163(j). As a result, as of January 1, 2024, businesses may now fully deduct their interest expenses in the year those expenses are incurred. This change, following on the heels of rate reductions to New Hampshire’s two business taxes, helped New Hampshire’s corporate component ranking improve by eight places, from 40th to 32nd. New Hampshire also continued to phase down its interest and dividends (I&D) tax this year, but given New Hampshire’s already highly competitive standing on this component, that change did not result in an improvement in rank on the individual tax component.
New Jersey
New Jersey largely removed GILTI from its tax baseThe tax base is the total amount of income, property, assets, consumption, transactions, or other economic activity subject to taxation by a tax authority. A narrow tax base is non-neutral and inefficient. A broad tax base reduces tax administration costs and allows more revenue to be raised at lower rates. , a positive reform that was nonetheless not enough to budge the state from its unenviable position between New York and California, at 49th overall.
North Carolina
North Carolina’s flat-rate individual income tax was reduced from 4.75 to 4.5 percent, but due to reforms in other states, this failed to improve the state’s ranking, and the state actually slid from 11th to 12th overall as other states made meaningful structural reforms.
Ohio
A cut to Ohio’s top individual income tax rate, from 3.75 to 3.5 percent, yielded a three-place improvement in the individual income tax component rank, from 28th to 25th. Ohio’s state-level income tax rate is now highly competitive, but the state remains burdened by high-rate local income taxes.
Oregon
Oregon’s rank dropped primarily due to relatively minor changes in its property and unemployment insurance tax components. However, competition among the states in the middle of the Index, with many states cutting rates and improving their tax structures, was such that the state lost ground by standing still.
Pennsylvania
Pennsylvania reduced its high-rate corporate income tax from 9 to 8.49 percent, a positive development but one that failed to leapfrog other states given how much of an outlier the state’s corporate income tax rate remains. However, the rate is scheduled to continue declining to 4.99 percent in coming years, which will yield meaningful improvements on the Index. Similarly, legislation was recently adopted that will see the state’s anomalously stingy net operating loss provisions begin improving next year, which should also result in ranking improvements.
Tennessee
Tennessee slashed its gross receipts taxGross receipts taxes are applied to a company’s gross sales, without deductions for a firm’s business expenses, like compensation, costs of goods sold, and overhead costs. Unlike a sales tax, a gross receipts tax is assessed on businesses and applies to transactions at every stage of the production process, leading to tax pyramiding. rate from 0.3 to 0.15 percent and made reforms to its state capital stock (franchise) tax to reduce burdens on businesses. Until these taxes are eliminated, however, Tennessee is unlikely to improve on its ranking of 8th overall.
Utah
Utah implemented another round of modest individual and corporate income tax rate reductions, trimming rates from 4.65 to 4.55 percent. However, Utah still slid from 15th to 16th overall due to significant improvements elsewhere across the country, including the advent of much lower top (or single) rate income taxes in some states.
Wisconsin
Wisconsin’s property tax rank improved by five places as a result of AB 245, enacted in June 2023, which eliminated Wisconsin’s business personal property tax beginning with the January 1, 2024, property tax assessment. This caused Wisconsin to join the ranks of the states that no longer levy tangible personal property taxes and yielded a five-place improvement on the property tax component, from 13th to 8th, and an improvement of one place overall.
2025 State Tax Competitiveness Index (2020-2025)
| State | 2020 | 2021 | 2022 | 2023 | 2024 Rank | 2024 Score | 2025 Rank | 2025 Score | 2024-2025 Rank Change | 2024-2025 Score Change |
|---|---|---|---|---|---|---|---|---|---|---|
| Alabama | 39 | 40 | 40 | 41 | 39 | 4.73 | 38 | 4.77 | -1 | 0.03 |
| Alaska | 3 | 3 | 3 | 3 | 3 | 7.17 | 3 | 7.05 | 0 | -0.12 |
| Arizona | 19 | 19 | 18 | 16 | 16 | 5.48 | 15 | 5.46 | -1 | -0.02 |
| Arkansas | 45 | 46 | 42 | 38 | 38 | 4.74 | 36 | 4.85 | -2 | 0.11 |
| California | 48 | 48 | 48 | 48 | 48 | 3.89 | 48 | 3.88 | 0 | -0.01 |
| Colorado | 22 | 22 | 25 | 27 | 31 | 5.06 | 32 | 5.02 | 1 | -0.04 |
| Connecticut | 47 | 47 | 47 | 47 | 47 | 4.15 | 47 | 4.13 | 0 | -0.02 |
| Delaware | 18 | 18 | 19 | 18 | 18 | 5.37 | 18 | 5.35 | 0 | -0.02 |
| Florida | 4 | 4 | 4 | 4 | 4 | 6.81 | 4 | 6.78 | 0 | -0.03 |
| Georgia | 30 | 29 | 28 | 29 | 32 | 5.03 | 26 | 5.10 | -6 | 0.07 |
| Hawaii | 38 | 41 | 43 | 43 | 44 | 4.49 | 42 | 4.52 | -2 | 0.03 |
| Idaho | 17 | 17 | 14 | 13 | 10 | 5.61 | 11 | 5.60 | 1 | -0.01 |
| Illinois | 33 | 34 | 35 | 34 | 36 | 4.82 | 37 | 4.77 | 1 | -0.05 |
| Indiana | 13 | 13 | 13 | 11 | 12 | 5.57 | 10 | 5.63 | -2 | 0.07 |
| Iowa | 44 | 39 | 38 | 37 | 22 | 5.19 | 20 | 5.30 | -2 | 0.11 |
| Kansas | 31 | 31 | 26 | 23 | 25 | 5.13 | 25 | 5.13 | 0 | 0.00 |
| Kentucky | 20 | 20 | 21 | 21 | 23 | 5.19 | 22 | 5.18 | -1 | -0.01 |
| Louisiana | 42 | 44 | 45 | 39 | 40 | 4.69 | 40 | 4.74 | 0 | 0.04 |
| Maine | 27 | 26 | 23 | 28 | 27 | 5.13 | 29 | 5.06 | 2 | -0.07 |
| Maryland | 41 | 43 | 46 | 46 | 46 | 4.33 | 46 | 4.35 | 0 | 0.02 |
| Massachusetts | 34 | 33 | 34 | 33 | 41 | 4.55 | 41 | 4.56 | 0 | 0.01 |
| Michigan | 12 | 11 | 12 | 12 | 14 | 5.55 | 14 | 5.49 | 0 | -0.06 |
| Minnesota | 46 | 45 | 44 | 44 | 42 | 4.54 | 44 | 4.48 | 2 | -0.06 |
| Mississippi | 29 | 30 | 30 | 31 | 29 | 5.09 | 27 | 5.09 | -2 | 0.00 |
| Missouri | 15 | 9 | 10 | 9 | 13 | 5.56 | 13 | 5.54 | 0 | -0.02 |
| Montana | 5 | 5 | 5 | 5 | 5 | 6.18 | 5 | 6.32 | 0 | 0.13 |
| Nebraska | 28 | 28 | 24 | 24 | 28 | 5.09 | 24 | 5.16 | -4 | 0.07 |
| Nevada | 16 | 15 | 17 | 17 | 17 | 5.42 | 17 | 5.37 | 0 | -0.05 |
| New Hampshire | 7 | 7 | 7 | 7 | 6 | 6.03 | 6 | 6.05 | 0 | 0.02 |
| New Jersey | 50 | 50 | 49 | 49 | 49 | 3.64 | 49 | 3.69 | 0 | 0.06 |
| New Mexico | 24 | 27 | 33 | 26 | 30 | 5.07 | 31 | 5.02 | 1 | -0.04 |
| New York | 49 | 49 | 50 | 50 | 50 | 3.61 | 50 | 3.62 | 0 | 0.01 |
| North Carolina | 11 | 10 | 11 | 10 | 11 | 5.60 | 12 | 5.57 | 1 | -0.03 |
| North Dakota | 10 | 16 | 15 | 14 | 9 | 5.63 | 9 | 5.67 | 0 | 0.04 |
| Ohio | 36 | 37 | 37 | 36 | 35 | 4.84 | 35 | 4.87 | 0 | 0.04 |
| Oklahoma | 26 | 23 | 31 | 22 | 19 | 5.30 | 21 | 5.27 | 2 | -0.04 |
| Oregon | 9 | 12 | 29 | 30 | 26 | 5.13 | 30 | 5.05 | 4 | -0.08 |
| Pennsylvania | 37 | 36 | 36 | 35 | 34 | 4.91 | 34 | 4.93 | 0 | 0.02 |
| Rhode Island | 40 | 38 | 39 | 40 | 37 | 4.80 | 39 | 4.75 | 2 | -0.05 |
| South Carolina | 32 | 32 | 32 | 32 | 33 | 5.01 | 33 | 4.99 | 0 | -0.03 |
| South Dakota | 2 | 2 | 2 | 2 | 2 | 7.58 | 2 | 7.65 | 0 | 0.06 |
| Tennessee | 35 | 35 | 8 | 8 | 8 | 5.86 | 8 | 5.94 | 0 | 0.08 |
| Texas | 6 | 6 | 6 | 6 | 7 | 6.00 | 7 | 6.00 | 0 | -0.01 |
| Utah | 14 | 14 | 16 | 15 | 15 | 5.48 | 16 | 5.43 | 1 | -0.05 |
| Vermont | 43 | 42 | 41 | 42 | 43 | 4.54 | 43 | 4.50 | 0 | -0.03 |
| Virginia | 23 | 25 | 27 | 25 | 24 | 5.16 | 28 | 5.09 | 4 | -0.07 |
| Washington | 8 | 8 | 9 | 45 | 45 | 4.47 | 45 | 4.44 | 0 | -0.03 |
| West Virginia | 25 | 24 | 22 | 19 | 21 | 5.19 | 23 | 5.17 | 2 | -0.02 |
| Wisconsin | 21 | 21 | 20 | 20 | 20 | 5.28 | 19 | 5.32 | -1 | 0.04 |
| Wyoming | 1 | 1 | 1 | 1 | 1 | 7.73 | 1 | 7.65 | 0 | -0.08 |
| District of Columbia | 47 | 47 | 47 | 48 | 48 | 4.01 | 48 | 4.07 | 0 | 0.06 |
Introduction
Taxation is inevitable, but the specifics of a state’s tax structure matter greatly. The measure of total taxes paid is relevant, but other elements of a state tax system can also enhance or harm the competitiveness of a state’s business environment. The State Tax Competitiveness Index distills many complex considerations to an easy-to-understand ranking.
The modern market is characterized by mobile capital and labor, with all types of businesses, small and large, tending to locate where they have the greatest competitive advantage. The evidence shows that states with the best tax systems will be the most competitive at attracting new businesses and most effective at generating economic and employment growth. It is true that taxes are but one factor in business decision-making. Other concerns also matter–such as access to raw materials or infrastructure or a skilled labor pool–but a simple, sensible tax system can positively impact business operations with regard to these resources. Furthermore, unlike changes to a state’s health-care, transportation, or education systems, which can take decades to implement, changes to the tax code can quickly improve a state’s competitiveness.
It is important to remember that even in our global economy, states’ stiffest competition often comes from other states. The Department of Labor reports that most mass job relocations are from one U.S. state to another rather than to a foreign location.[1] Certainly, job creation is rapid overseas, as previously underdeveloped nations enter the world economy, though in the aftermath of federal tax reform, U.S. businesses no longer face the third-highest corporate tax rate in the world, but rather one in line with averages for industrialized nations.[2] State lawmakers are right to be concerned about how their states rank in the global competition for jobs and capital, but they need to be more concerned with companies moving from Detroit, Michigan, to Dayton, Ohio, than from Detroit to New Delhi, India. This means that state lawmakers must be aware of how their states’ business climates match up against their immediate neighbors and to other regional competitor states.
Anecdotes about the impact of state tax systems on business investment are plentiful. In Illinois in the early 2000s, hundreds of millions of dollars of capital investments were delayed when then-Governor Rod Blagojevich (D) proposed a hefty gross receipts tax.[3] Only when the legislature resoundingly defeated the bill did the investment resume. In 2005, California-based Intel decided to build a multibillion-dollar chip-making facility in Arizona due to its favorable corporate income tax system.[4] In 2010, Northrup Grumman chose to move its headquarters to Virginia over Maryland, citing the better business tax climate.[5] In 2015, General Electric and Aetna threatened to decamp from Connecticut if the governor signed a budget that would increase corporate tax burdens, and General Electric actually did so.[6] Anecdotes such as these reinforce what we know from economic theory: taxes matter to businesses, and those places with the most competitive tax systems will reap the benefits of business-friendly tax climates.
Tax competition is an unpleasant reality for state revenue and budget officials, but it is an effective restraint on state and local taxes. When a state imposes higher taxes than a neighboring state, businesses will cross the border to some extent. Therefore, states with more competitive tax systems score well in the Index because they are best suited to generate economic growth.
State lawmakers are mindful of their states’ tax competitiveness, but they are sometimes tempted to lure businesses with lucrative tax incentives and subsidies instead of broad-based tax reform. This can be a dangerous proposition, as the example of Dell Computers and North Carolina illustrates. North Carolina agreed to $240 million worth of incentives to lure Dell to the state. Many of the incentives came in the form of tax credits from the state and local governments. Unfortunately, Dell announced in 2009 that it would be closing the plant after only four years of operations.[7] A 2007 USA TODAY article chronicled similar problems other states have had with companies that receive generous tax incentives.[8]
Lawmakers make these deals under the banner of job creation and economic development, but the truth is that if a state needs to offer such packages, it is most likely covering for an undesirable business tax climate. A far more effective approach is the systematic improvement of the state’s business tax climate for the long term to improve the state’s competitiveness. When assessing which changes to make, lawmakers need to remember two rules:
- Taxes matter to business. Business taxes affect business decisions, job creation and retention, plant location, competitiveness, the transparency of the tax system, and the long-term health of a state’s economy. Most importantly, taxes diminish profits. If taxes take a larger portion of profits, that cost is passed along to either consumers (through higher prices), employees (through lower wages or fewer jobs), shareholders (through lower dividends or share value), or some combination of the above. Thus, a state with lower tax costs will be more attractive to business investment and more likely to experience economic growth.
- States do not enact tax changes (increases or cuts) in a vacuum. Every tax law will in some way change a state’s competitive position relative to its immediate neighbors, its region, and even globally. Ultimately, it will affect the state’s national standing as a place to live and to do business. Entrepreneurial states can take advantage of the tax increases of their neighbors to lure businesses out of high-tax states.
To some extent, tax-induced economic distortions are a fact of life, but policymakers should strive to maximize the occasions when businesses and individuals are guided by business principles and minimize those cases where economic decisions are influenced, micromanaged, or even dictated by a tax system. The more riddled a tax system is with politically motivated preferences, the less likely it is that business decisions will be made in response to market forces. The Index rewards those states that minimize tax-induced economic distortions.
Ranking the competitiveness of 50 very different tax systems presents many challenges, especially when a state dispenses with a major tax entirely. Should Indiana’s tax system, which includes three relatively neutral taxes on sales, individual income, and corporate income, be considered more or less competitive than Alaska’s tax system, which includes a particularly burdensome corporate income tax but no statewide tax on individual income or sales?
The Index deals with such questions by comparing the states on more than 150 variables in the five major areas of taxation (corporate taxes; individual income taxes; sales, use, and excise taxes; property and wealth taxes; and unemployment insurance taxes) and then adding the results to yield a final, overall ranking. This approach rewards states on particularly strong aspects of their tax systems (or penalizes them on particularly weak aspects), while measuring the general competitiveness of their overall tax systems. The result is a score that can be compared to other states’ scores. Ultimately, both Alaska and Indiana score well.
Literature Review
Economists have not always agreed on how individuals and businesses react to taxes. As early as 1956, Charles Tiebout postulated that if citizens were faced with an array of communities that offered different types or levels of public goods and services at different costs or tax levels, then all citizens would choose the community that best satisfied their particular demands, revealing their preferences by “voting with their feet.” Tiebout’s article is the seminal work on the topic of how taxes affect the location decisions of taxpayers.
Tiebout suggested that citizens with high demands for public goods would concentrate in communities with high levels of public services and high taxes while those with low demands would choose communities with low levels of public services and low taxes. Competition among jurisdictions results in a variety of communities, each with residents who all value public services similarly.
However, businesses sort out the costs and benefits of taxes differently from individuals. For businesses, which can be more mobile and must earn profits to justify their existence, taxes reduce profitability. Theoretically, businesses could be expected to be more responsive than individuals to the lure of low-tax jurisdictions. Research suggests that corporations engage in “yardstick competition,” comparing the costs of government services across jurisdictions. Shleifer (1985) first proposed comparing regulated franchises in order to determine efficiency. Salmon (1987) extended Shleifer’s work to look at subnational governments. Besley and Case (1995) showed that “yardstick competition” affects voting behavior, and Bosch and Sole-Olle (2006) further confirmed the results found by Besley and Case. Tax changes that are out of sync with neighboring jurisdictions will impact voting behavior.
The economic literature over the past 60 years has slowly cohered around this hypothesis. Ladd (1998) summarizes the post-World War II empirical tax research literature in an excellent survey article, breaking it down into three distinct periods of differing ideas about taxation: (1) taxes do not change behavior; (2) taxes may or may not change business behavior depending on the circumstances; and (3) taxes definitely change behavior.
Period one, with the exception of Tiebout, included the 1950s, 1960s, and 1970s and is summarized succinctly in three survey articles: Due (1961), Oakland (1978), and Wasylenko (1981). Due’s was a polemic against tax giveaways to businesses, and his analytical techniques consisted of basic correlations, interview studies, and the examination of taxes relative to other costs. He found no evidence to support the notion that taxes influence business location. Oakland was skeptical of the assertion that tax differentials at the local level had no influence at all. However, because econometric analysis was relatively unsophisticated at the time, he found no significant results to support his intuition. Wasylenko’s survey of the literature found some of the first evidence indicating that taxes do influence business location decisions. However, the statistical significance was lower than that of other factors such as labor supply and agglomeration economies. Therefore, he dismissed taxes as a secondary factor at most.
Period two was a brief transition during the early- to mid-1980s. This was a time of great ferment in tax policy as Congress passed major tax bills, including the so-called Reagan tax cut in 1981 and a dramatic reform of the federal tax code in 1986. Articles revealing the economic significance of tax policy proliferated and became more sophisticated. For example, Wasylenko and McGuire (1985) extended the traditional business location literature to nonmanufacturing sectors and found, “Higher wages, utility prices, personal income tax rates, and an increase in the overall level of taxation discourage employment growth in several industries.” However, Newman and Sullivan (1988) still found a mixed bag in “their observation that significant tax effects [only] emerged when models were carefully specified.”
Ladd was writing in 1998, so her “period three” started in the late 1980s and continued up to 1998, when the quantity and quality of articles increased significantly. Articles that fit into period three begin to surface as early as 1985, as Helms (1985) and Bartik (1985) put forth forceful arguments based on empirical research that taxes guide business decisions. Helms concluded that a state’s ability to attract, retain, and encourage business activity is significantly affected by its pattern of taxation. Furthermore, tax increases significantly retard economic growth when the revenue is used to fund transfer payments. Bartik concluded that the conventional view that state and local taxes have little effect on business is false.
Papke and Papke (1986) found that tax differentials among locations may be an important business location factor, concluding that consistently high business taxes can represent a hindrance to the location of industry. Interestingly, they use the same type of after-tax model used by Tannenwald (1996), who reaches a different conclusion.
Bartik (1989) provides strong evidence that taxes have a negative impact on business start-ups. He finds specifically that property taxes, because they are paid regardless of profit, have the strongest negative effect on business. Bartik’s econometric model also predicts tax elasticities of -0.1 to -0.5 that imply a 10 percent cut in tax rates will increase business activity by 1 to 5 percent. Bartik’s findings, as well as those of Mark, McGuire, and Papke (2000), and ample anecdotal evidence of the importance of property taxes, buttress the argument for inclusion of a property index devoted to property-type taxes in the Index.
By the early 1990s, the literature had expanded sufficiently for Bartik (1991) to identify 57 studies on which to base his literature survey. Ladd succinctly summarizes Bartik’s findings:
The large number of studies permitted Bartik to take a different approach from the other authors. Instead of dwelling on the results and limitations of each individual study, he looked at them in the aggregate and in groups. Although he acknowledged potential criticisms of individual studies, he convincingly argued that some systematic flaw would have to cut across all studies for the consensus results to be invalid. In striking contrast to previous reviewers, he concluded that taxes have quite large and significant effects on business activity.
Ladd’s “period three” surely continues to this day. Agostini and Tulayasathien (2001) examined the effects of corporate income taxes on the location of foreign direct investment in U.S. states. They determined that for “foreign investors, the corporate tax rate is the most relevant tax in their investment decision.” Therefore, they found that foreign direct investment was quite sensitive to states’ corporate tax rates.
Mark, McGuire, and Papke (2000) found that taxes are a statistically significant factor in private-sector job growth. Specifically, they found that personal property taxes and sales taxes have economically large negative effects on the annual growth of private employment.
Harden and Hoyt (2003) point to Phillips and Gross (1995) as another study contending that taxes impact state economic growth, and they assert that the consensus among recent literature is that state and local taxes negatively affect employment levels. Harden and Hoyt conclude that the corporate income tax has the most significant negative impact on the rate of growth in employment.
Gupta and Hofmann (2003) regressed capital expenditures on a variety of factors, including weights of apportionmentApportionment is the determination of the percentage of a business’s profits subject to a given jurisdiction’s corporate income tax or other business tax. US states apportion business profits based on some combination of the percentage of company property, payroll, and sales located within their borders. formulas, the number of tax incentives, and burden figures. Their model covered 14 years of data and determined that firms tend to locate property in states where they are subject to lower income tax burdens. Furthermore, Gupta and Hofmann suggest that throwback requirements are the most influential on the location of capital investment, followed by apportionment weights and tax rates, and that investment-related incentives have the least impact.
Other economists have found that taxes on specific products can produce behavioral results similar to those that were found in these general studies. For example, Fleenor (1998) looked at the effect of excise taxAn excise tax is a tax imposed on a specific good or activity. Excise taxes are commonly levied on cigarettes, alcoholic beverages, soda, gasoline, insurance premiums, amusement activities, and betting, and typically make up a relatively small and volatile portion of state and local and, to a lesser extent, federal tax collections. differentials between states on cross-border shopping and the smuggling of cigarettes. Moody and Warcholik (2004) examined the cross-border effects of beer excises. Their results, supported by the literature in both cases, showed significant cross-border shopping and smuggling between low-tax states and high-tax states.
Fleenor found that shopping areas sprouted in counties of low-tax states that shared a border with a high-tax state, and that approximately 13.3 percent of the cigarettes consumed in the United States during FY 1997 were procured via some type of cross-border activity. Similarly, Moody and Warcholik found that in 2000, 19.9 million cases of beer, on net, moved from low- to high-tax states. This amounted to some $40 million in sales and excise tax revenue lost in high-tax states.
Although the literature has largely congealed around a general consensus that taxes are a substantial factor in the decision-making process for businesses, disputes remain, and some scholars are unconvinced.
Based on a substantial review of the literature on business climates and taxes, Wasylenko (1997) concludes that taxes do not appear to have a substantial effect on economic activity among states. However, his conclusion is premised on there being few significant differences in state tax systems. He concedes that high-tax states will lose economic activity to average or low-tax states “as long as the elasticity is negative and significantly different from zero.” Indeed, he approvingly cites a State Policy Reports article that finds that the highest-tax states have acknowledged that high taxes may be responsible for the low rates of job creation in those states.[9]
Wasylenko’s rejoinder is that policymakers routinely overestimate the degree to which tax policy affects business location decisions and that as a result of this misperception, they respond readily to public pressure for jobs and economic growth by proposing lower taxes. According to Wasylenko, other legislative actions are likely to accomplish more positive economic results because in reality, taxes do not drive economic growth.
However, there is ample evidence that states compete for businesses using their tax systems. A notable example comes from Illinois, where in early 2011 lawmakers passed two major tax increases. The individual income tax rate increased from 3 percent to 5 percent, and the corporate income tax rate rose from 7.3 percent to 9.5 percent.[10] The result was that many businesses threatened to leave the state, including some very high-profile Illinois companies such as Sears and the Chicago Mercantile Exchange. By the end of the year, lawmakers had cut deals with both firms, totaling $235 million over the next decade, to keep them from leaving the state.[11]
A new literature review, Kleven et al. (2019), summarizes recent evidence for tax-driven migration. Meanwhile, Giroud and Rauh (2019) use microdata on multistate firms to estimate the impact of state taxes on business activity, and find that C corporation employment and establishments have short-run corporate tax elasticities of -0.4 to -0.5, while pass-through entities show elasticities of -0.2 to -0.4, meaning that, for each percentage-point increase in the rate, employment decreases by 0.4 to 0.5 percent for C corporations subject to the corporate income tax, and by 0.2 to 0.4 percent within pass-through businesses subject to the individual income tax.
Measuring the Impact of Tax Differentials
Some recent contributions to the literature on state taxation criticize business and tax climate studies in general.[12] Authors of such studies contend that comparative reports like the State Tax Competitiveness Index do not take into account those factors which directly impact a state’s business climate. However, a careful examination of these criticisms reveals that the authors believe taxes are unimportant to businesses and therefore dismiss the studies as merely being designed to advocate low taxes.
Peter Fisher’s Grading Places: What Do the Business Climate Rankings Really Tell Us? now published by Good Jobs First, criticizes four indices: The U.S. Business Policy Index published by the Small Business and Entrepreneurship Council, Beacon Hill’s Competitiveness Report, the American Legislative Exchange Council’s Rich States, Poor States, and the previous version of study. The first edition also critiqued the Cato Institute’s Fiscal Policy Report Card and the Economic Freedom Index by the Pacific Research Institute. In the report’s first edition, published before Fisher summarized his objections: “The underlying problem with the … indexes, of course, is twofold: none of them actually do a very good job of measuring what it is they claim to measure, and they do not, for the most part, set out to measure the right things to begin with” (Fisher 2005). In the second edition, he identified three overarching questions: (1) whether the indices included relevant variables, and only relevant variables; (2) whether these variables measured what they purport to measure; and (3) how the index combines these measures into a single index number (Fisher 2013). Fisher’s primary argument is that if the indexes did what they purported to do, then all five would rank the states similarly.
Fisher’s conclusion holds little weight because the five indices serve such dissimilar purposes, and each group has a different area of expertise. There is no reason to believe that the Tax Foundation’s Index, which depends entirely on state tax laws, would rank the states in the same or similar order as an index that includes crime rates, electricity costs, and health care (the Small Business and Entrepreneurship Council’s Small Business Survival Index), or infant mortality rates and the percentage of adults in the workforce (Beacon Hill’s State Competitiveness Report), or charter schools, tort reform, and minimum wage laws (the Pacific Research Institute’s Economic Freedom Index).
The Tax Foundation’s State Tax Competitiveness Index is an indicator of which states’ tax systems are the most hospitable to economic growth. The Index does not purport to measure economic opportunity or freedom, or even the broad business climate, but rather tax competitiveness, and its variables reflect this focus. We do so not only because the Tax Foundation’s expertise is in taxes, but because every component of the Index is subject to immediate change by state lawmakers. It is by no means clear what the best course of action is for state lawmakers who want to thwart crime, for example, either in the short or long term, but they can change their tax codes now. Contrary to Fisher’s 1970s view that the effects of taxes are “small or non-existent,” our study reflects strong evidence that business decisions are significantly impacted by tax considerations.
Although Fisher does not feel tax climates are important to states’ economic growth, other authors contend the opposite. Bittlingmayer, Eathington, Hall, and Orazem (2005) find in their analysis of several business climate studies that a state’s tax climate does affect its economic growth rate and that several indices are able to predict growth, and that this study’s predecessor “explains growth consistently.” This finding was confirmed by Anderson (2006) in a study for the Michigan House of Representatives, and more recently by Kolko, Neumark, and Mejia (2013), who, in an analysis of the ability of 10 business climate indices to predict economic growth, concluded that this study’s predecessor, State Business Tax Climate Index, yielded “positive, sizable, and statistically significant estimates for every specification” they measured, and specifically cited the Index as one of two business climate indices (out of 10) with particularly strong and robust evidence of predictive power.
Bittlingmayer et al. also found that relative tax competitiveness matters, especially at the borders, and therefore, indices that place a high premium on tax policies do a better job of explaining growth. They also observed that studies focused on a single topic do better at explaining economic growth at borders. Lastly, the article concludes that the most important elements of the business climate are tax and regulatory burdens on business (Bittlingmayer et al. 2005). These findings support the argument that taxes impact business decisions and economic growth, and they support the validity of the Index.
Fisher and Bittlingmayer et al. hold opposing views about the impact of taxes on economic growth. Fisher finds support from Robert Tannenwald, formerly of the Boston Federal Reserve, who argues that taxes are not as important to businesses as public expenditures. Tannenwald compares 22 states by measuring the after-tax rate of return to cash flow of a new facility built by a representative firm in each state. This very different approach attempts to compute the marginal effective tax rate of a hypothetical firm and yields results that make taxes appear trivial.
The taxes paid by businesses should be a concern to everyone because they are ultimately borne by individuals through lower wages, increased prices, and decreased shareholder value. States do not institute tax policy in a vacuum. Every change to a state’s tax system makes its business tax climate more or less competitive compared to other states and makes the state more or less attractive to business. Ultimately, anecdotal and empirical evidence, along with the cohesion of recent literature around the conclusion that taxes matter a great deal to business, show that the Index is an important and useful tool for policymakers who want to make their states’ tax systems welcoming to business.
Methodological Changes
The State Tax Competitiveness Index (STCI) is the successor to the State Business Tax Climate Index (SBTCI), which was published by the Tax Foundation from 2003 to 2023. Continuing in the tradition of its predecessor, the new Index assesses state tax competitiveness and the soundness of states’ tax codes. While it maintains the same general structure as the old Index, it incorporates meaningful methodological changes aimed at creating a more transparent and modern approach to evaluating state tax competitiveness.
What Has Remained the Same
Similar to the SBTCI, the State Tax Competitiveness Index contains five major components:
- Corporate Taxes (includes corporate income taxes and gross receipts taxes)
- Individual Income Taxes
- Sales, Use, and Excise Taxes
- Property and Wealth Taxes
- Unemployment Insurance Taxes
Each component, as before, has two equally weighted subindices: the rate subindex and the base subindex. Where applicable, both state and average local tax rates are used to assess the state’s tax competitiveness. However, components are not weighted equally. Instead, each component is weighted based on the variability (standard deviation) of the 50 states’ scores from the mean. This results in a heavier weighting of components with greater variability. Traditionally, individual income taxes and sales taxes have had the highest weights, while unemployment insurance taxes have had the lowest weight. This remains true in the new Index.
Alternative weighting schemes, such as equal weights or weights based on the revenue-generating importance of a tax, are possible, but sensitivity tests show they produce relatively similar results. For example, the correlation between the actual Index ranks and those using equal weights is about 0.85, with most states in the top 10 and bottom 10 retaining their ranks. However, we believe the current weighting scheme better reflects the importance of tax competition and provides stronger rewards and penalties in areas where competition for human, physical, and financial capital is most intense.
What Has Changed
Corporate Taxes
Since corporate income taxes and gross receipts taxes are fundamentally different systems for taxing corporations, we assess them separately, with each now receiving a 50-percent weight in both the rate and base subindices. In the previous version of the Index, gross receipts taxes were underweighted compared to corporate income taxes, especially in the base subindex, with particular challenges arising in the two states (Delaware and Oregon) that impose both corporate income and gross receipts taxes at the state level.
Additionally, significant changes have been made to the treatment of net operating losses and their respective deductions. Since carryforward provisions are much more important than carryback provisions in the federal tax code, we now assign an 80-percent weight to carryforwards and a 20-percent weight to carrybacks when assessing net operating loss deductions. Both provisions help firms pay taxes based on their average, rather than annual, profitability. However, carrybacks are rarely used by states and function similarly to carryforwards. A generous carryforward period (of 20 years or above) with no statutory dollar cap now allows a state to score highly on the base subindex, even if it doesn’t offer a carryback. This differs from the old Index, where carryback treatment was given greater weight, and where conformity to federal treatment was assessed on par with the most generous state-specific carryforward treatment rather than assessing the discrete elements (carryforward period and carryforward cap) separately.
Individual Income Taxes
In the rate subindex, the top rate variable now includes the state’s top marginal income tax rate and the average local income tax rate in the two largest jurisdictions. Previously, we used the average local income tax rate in the largest jurisdiction and the state capital. Our new approach notably affects states like Pennsylvania and Kentucky, where the largest cities tend to have the highest local income tax rates. The rate subindex now includes a new variable that reflects the progressivity of the individual income tax rate structure. This variable is calculated by dividing the state’s top marginal income tax rate by the marginal rate for joint filers with a median household income (which varies by state). The higher the ratio, the greater the progressivity of the rate structure and the stronger the incentive for high earners to consider relocating to other jurisdictions. The rate subindex gives equal weight to the top rate variable and the progressivity index, which accounts for the rate structure’s progressivity, the number of brackets, the top tax bracket threshold, and income recapture.
The base subindex, in addition to previously used marriage penaltyA marriage penalty is when a household’s overall tax bill increases due to a couple marrying and filing taxes jointly. A marriage penalty typically occurs when two individuals with similar incomes marry; this is true for both high- and low-income couples. , indexation, double taxationDouble taxation is when taxes are paid twice on the same dollar of income, regardless of whether that’s corporate or individual income. , alternative minimum tax, Section 179 expensing, and other variables, now includes the filing and withholding threshold index. This variable assesses states’ individual income tax filing and withholding requirements for nonresidents who perform a limited amount of work in the state. States that score well on this variable provide meaningful filing and withholding relief to most nonresidents who spend a limited amount of time working in the state.
Sales, Use, and Excise Taxes
The rate subindex now includes both the general state and local sales tax rate index and the excise tax index, weighted at 75 percent and 25 percent, respectively, to roughly reflect the revenue-generating potential of these taxes. The excise tax index, in addition to previously included taxes on gasoline, diesel, tobacco, beer, and distilled spirits, now incorporates the vape tax rate, reflecting the growing importance of this tax. Additionally, if the state imposes a digital advertising tax (currently only in Maryland), it is penalized by up to 15 percent of the score in this subindex, depending on the tax rate.
The base subindex now accounts for several additional business inputs, goods, and services, particularly in the digital space. The Index has traditionally penalized states for taxing manufacturing machinery, raw materials, farm equipment, office equipment, industrial utilities, and information services, among others. Now, the category of business inputs has been expanded to include software-as-a-service (SaaS), platform-as-a-service (PaaS), payroll services, and other business-to-business digital goods. Taxing these new business-to-business transactions leads to tax pyramidingTax pyramiding occurs when the same final good or service is taxed multiple times along the production process. This yields vastly different effective tax rates depending on the length of the supply chain and disproportionately harms low-margin firms. Gross receipts taxes are a prime example of tax pyramiding in action. and should be avoided. Final consumption goods and services, which could be used for modest base broadeningBase broadening is the expansion of the amount of economic activity subject to tax, usually by eliminating exemptions, exclusions, deductions, credits, and other preferences. Narrow tax bases are non-neutral, favoring one product or industry over another, and can undermine revenue stability. (and for which states are rewarded in the Index), now include e-books and digital video.
Property Taxes
The rate subindex, as before, consists of the effective property tax rate index and the capital stock tax index. We now use property taxes paid as a percentage of personal income as the sole measure of the effective property tax burden. We removed the per capita property tax collections variable for simplicity, as the two variables were highly collinear (with a correlation coefficient of 0.94), and there was limited justification for using both.
The base subindex now provides a more comprehensive treatment of tangible personal property (TPP) taxation. In addition to the dummy variable indicating whether the state taxes this type of property (as before, states are penalized for doing so), we now account for the prevalence and size of TPP de minimis exemptions, which minimize compliance costs for small and medium-sized businesses (states are rewarded for having higher de minimis exemptions). Additionally, instead of using dummy variables for estate and inheritance taxes (where states were penalized for having these taxes regardless of the rate), we now compare maximum estate and inheritance tax rates and penalize states with higher bequest tax rates.
Unemployment Insurance Taxes
The biggest changes have occurred in the rate subindex. When assessing actual UI tax rates, we are now factoring in the interaction between minimum and maximum UI tax rates and the taxable wage base in each state. These interactions provide a more precise estimate of the total tax burden on different types of firms. Essentially, we now penalize low-rate states if their taxable wage base is significantly higher than the federal level of $7,000. Similarly, we penalize high-rate states, but the size of the penalty increases with the taxable wage base. For example, a state with a maximum UI tax rate of 10 percent and a taxable wage base of $20,000 would perform as well as a state with a maximum UI tax rate of 5.4 percent and a taxable wage base of $37,000.
Additionally, the rate subindex now accounts for effective tax burdens as estimated by the US Department of Labor. We are using two variables—employer contribution rates as a percentage of taxable wages and total wages—as part of our actual UI tax rate assessment. States with relatively low values for these variables (e.g., Alabama or Virginia) do not overburden employers with high effective UI tax rates, unlike states with relatively high values (e.g., Hawaii and Pennsylvania).
The rate subindex now also accounts for the solvency of a state’s UI trust fund. When these funds become insolvent (as in the cases of California and New York), states must borrow from the federal government and then find ways to repay these federal loans, either by issuing bonds or raising other taxes. There is a recommended level of solvency, and we now reward states with higher levels of UI trust fund solvency while penalizing those with insolvent UI trust funds. This helps ensure that states are rewarded for creating a stable UI tax environment, rather than imposing artificially low UI taxes during expansionary periods and relying on surcharges and rate increases during economic downturns.
The actual UI tax rate now plays a major role in the rate subindex (60 percent), followed by the potential UI tax rate (20 percent) and UI trust fund solvency (20 percent).
The base subindex still uses the same major variables as before, including the experience rating formula used in a state, several types of charging methods and benefits excluded from charging, and other smaller elements of the base, such as the solvency tax, taxes for socialized costs, reserve taxes, and voluntary contributions. We adjusted several weights within the base subindex to simplify the UI tax component of the Index and make it more transparent.
Methodology
The Tax Foundation’s State Tax Competitiveness Index has a hierarchical structure built from five components:
- Individual Income Taxes
- Sales, Use, and Excise Taxes
- Corporate Taxes
- Property and Wealth Taxes
- Unemployment Insurance Taxes
Using the economic literature as our guide, we designed these five components to score each state’s tax competitiveness on a scale of 0 (worst) to 10 (best). Each component is devoted to a major area of state taxation and includes numerous tax rate and tax base variables. Overall, there are 153 variables measured in this report.
The five components are not weighted equally, as they are in some indices. Rather, each component is weighted based on the variability of the 50 states’ scores from the mean. The standard deviation of each component is calculated and a weight for each component is created from that measure. The result is a heavier weighting of those components with greater variability. The weighting of each of the five major components is:
- 30.5% — Individual Income Taxes
- 22.8% — Sales, Use, and Excise Taxes
- 21.3% — Corporate Taxes
- 14.9% — Property Taxes
- 10.5% — Unemployment Insurance Taxes
This improves the explanatory power of the State Tax Competitiveness Index as a whole because components with higher standard deviations are those areas of tax law where some states have significant competitive advantages. Businesses that are comparing states for new or expanded locations must give greater emphasis to tax climates when the differences are large. On the other hand, components in which the 50 state scores are clustered together—closely distributed around the mean—are those areas of tax law where businesses are more likely to de-emphasize tax factors in their location decisions.
For example, Delaware is known to have a significant advantage in sales tax competition, because its tax rate of zero attracts businesses and shoppers from all over the Mid-Atlantic region. That advantage and its drawing power increase every time another state raises its sales tax. Texas, meanwhile, goes without individual or corporate income taxes, though it does impose an uncompetitive “margins” tax on gross receipts. When other states’ income taxes rise, the Texas advantage becomes more alluring.
In contrast with this variability in state income and sales tax rates, unemployment insurance tax systems are relatively similar around the nation, so a small change in one state’s law could change its component ranking dramatically—but, due to the Index’s weights, with only a modest impact on overall ranks.
Within each component are two equally weighted subindices devoted to measuring the impact of the tax rates and the tax bases. Each subindex is composed of one or more dummy or scalar variables. Dummy variables, which can take the values of 0 or 1, describe various binary tax provisions (e.g., whether a state indexes its individual income tax brackets for inflationInflation is when the general price of goods and services increases across the economy, reducing the purchasing power of a currency and the value of certain assets. The same paycheck covers less goods, services, and bills. It is sometimes referred to as a “hidden tax,” as it leaves taxpayers less well-off due to higher costs and “bracket creep,” while increasing the government’s spending power. or offers specific job or R&D credits to corporations), while scalar variables describe tax rates, tax progressivity, effective tax burdens (in the property and unemployment insurance tax components), and other categorical or discrete tax provisions.
Relative Versus Absolute Indexing
The State Tax Competitiveness Index is designed as a relative index rather than an absolute or ideal index. In other words, each variable is ranked relative to the variable’s range in other states. The relative scoring scale is from 0 to 10, with zero meaning not “worst possible” but rather worst among the 50 states.
Many states’ tax rates are so close to each other that an absolute index would not provide enough information about the differences among the states’ tax systems, especially for pragmatic business owners and individuals who want to know which states have the best tax system in each region.
Comparing States Without a Tax. One problem associated with a relative scale is that it is mathematically impossible to compare states with a given tax to states that do not have the tax. As a zero rate is the lowest possible rate and the most neutral base, since it creates the most favorable tax climate for economic growth, those states with a zero rate on individual income, corporate income, or sales gain an immense competitive advantage. Therefore, states without a given tax generally receive a 10, and the Index measures all the other states against each other.
A few notable exceptions to this rule exist. The first is in Washington and New Hampshire, which do not have taxes on wage income but apply various rates to interest and dividends (in the case of New Hampshire) or capital gains (in the case of Washington). We use implied tax rates for those states, which account for the nationwide composition of the different components of individual income. The second exception is found in Nevada, where a payroll tax (for purposes other than unemployment insurance) is also included in the individual income tax component. The final exception is in zero sales tax states—Alaska, Montana, New Hampshire, Oregon, and Delaware—which do not have general sales taxes but still do not score a perfect 10 in that component section because of excise taxes on gasoline, beer, and other products, which are included in that section. Alaska, moreover, forgoes a state sales tax, but does permit local option sales taxes.
Normalizing Final Scores. Another challenge with using a relative scale within the components is that the average scores across the five components vary. This alters the value of not having a given tax across major indices. For example, the unadjusted average score of the corporate income tax component is 6.71 while the average score of the sales tax component is 5.39. To address this issue, scores on the five major components are “normalized,” which brings the average score for all of them to 5.00, excluding states that do not have the given tax. This is accomplished by multiplying each state’s score by a constant value.
Once the scores are normalized, it is possible to compare states across indices. For example, because of normalization, it is possible to say that Connecticut’s score of 5.08 on corporate income taxes is better than its score of 3.58 on the individual income tax.
Time Frame Measured by the Index (Snapshot Date)
The Index measures each state’s tax competitiveness as it stands at the beginning of the standard state fiscal year, July 1. Therefore, this edition is the 2025 Index and represents the tax climate of each state as of July 1, 2024, the first day of fiscal year 2025 for most states.
District of Columbia
The District of Columbia (DC) is only included as an exhibit and its scores and “phantom ranks” offered do not affect the scores or ranks of other states.
Past Rankings and Scores
This report includes 2020-2024 Index rankings that can be used for comparison with the 2025 rankings and scores. These differ from previously published Index rankings and scores (including all prior versions of the State Business Tax Climate Index) due to the enactment of retroactive statutes, backcasting of the methodological changes, and corrections to variables brought to our attention since the last report was published. The scores and rankings in this report are definitive.
Corporate Taxes
This component measures the impact of each state’s principal tax on business activities and accounts for 21.3 percent of each state’s total score. It is well established that the extent of business taxation can affect a business’s level of economic activity within a state. For example, Newman found that differentials in state corporate income taxes were a major factor influencing the movement of industry to Southern states.[13] Two decades later, with global investment greatly expanded, Agostini and Tulayasathien determined that a state’s corporate tax rate is the most relevant tax for foreign investors’ investment decisions.[14]
Most states levy standard corporate income taxes on profits (gross receipts minus expenses). Some states, however, problematically impose taxes on the gross receipts of businesses with few or no deductions for expenses. Between 2005 and 2010, for example, Ohio phased in the Commercial Activities Tax (CAT), which has a rate of 0.26 percent. Washington has the Business and Occupation (B&O) Tax, which is a multi-rate tax (depending on industry) on the gross receipts of Washington businesses. Delaware has a similar Manufacturers’ and Merchants’ License Tax, as does Tennessee with its Business Tax, Virginia with its locally-levied Business/Professional/Occupational License (BPOL) Tax, and West Virginia with its local Business & Occupation (B&O) Tax. Texas also added the Margin Tax, a complicated gross receipts tax, in 2007; Nevada adopted the gross receipts-based multi-rate Commerce Tax in 2015; and Oregon implemented a new modified gross receipts tax in 2020. However, in 2011, Michigan passed a significant corporate tax reform that eliminated the state’s modified gross receipts tax and replaced it with a 6 percent corporate income tax, effective January 1, 2012. The previous tax had been in place since 2007, and Michigan’s repeal followed others in Kentucky (2006) and New Jersey (2006). Several states contemplated gross receipts taxes in 2017, but none were adopted.
Since gross receipts taxes and corporate income taxes are levied on different bases, we separately compare gross receipts taxes to each other, and corporate income taxes to each other. Gross receipts taxes and corporate income taxes each account for 50 percent of rate and base subindices.
For states with corporate income taxes, the corporate tax rate subindex is calculated by assessing two key areas: the top tax rate and the number of brackets. States that levy neither a corporate income tax nor a gross receipts tax achieve a perfectly neutral system in regard to business income and thus receive a perfect score. For states with gross receipts taxes, the corporate tax subindex is calculated by assessing the applicable gross receipts rate.
States that do impose a corporate tax generally will score well if they have a low rate (North Carolina, Missouri, Oklahoma, Mississippi, North Dakota, and Indiana). States with a high rate or a complex and multiple-rate system score poorly (Delaware, Oregon, Tennessee, New Jersey, Minnesota, and Illinois).
To calculate the parallel subindex for the corporate tax base, four broad areas are assessed: tax credits, treatment of net operating losses, treatment of capital investment and foreign income, and an “other” category that includes variables such as conformity to the Internal Revenue Code, protections against double taxation, and the taxation of throwback income, among others. For states that impose gross receipts taxes, two types of deductions are assessed: for expenses on employee compensation and for cost of goods sold.
States that score well on the corporate tax base subindex generally will have few business tax credits, generous carryback and carryforward provisions, ons for net operating losses, conformity to the Internal Revenue Code, and provisions that alleviate double taxation.
Table 3. Corporate Income Tax Component of the State Tax Competitiveness Index (2020–2025)
| State | 2020 | 2021 | 2022 | 2023 | 2024 Rank | 2024 Score | 2025 Rank | 2025 Score | 2024-2025 Rank | 2024-2025 Score |
|---|---|---|---|---|---|---|---|---|---|---|
| Alabama | 17 | 17 | 12 | 12 | 12 | 5.57 | 14 | 5.51 | 2 | -0.06 |
| Alaska | 31 | 30 | 30 | 31 | 32 | 4.99 | 34 | 4.93 | 2 | -0.06 |
| Arizona | 11 | 12 | 13 | 13 | 13 | 5.56 | 13 | 5.53 | 0 | -0.03 |
| Arkansas | 29 | 28 | 27 | 25 | 19 | 5.38 | 15 | 5.50 | -4 | 0.12 |
| California | 30 | 31 | 41 | 41 | 41 | 4.63 | 41 | 4.61 | 0 | -0.03 |
| Colorado | 10 | 11 | 8 | 9 | 9 | 5.68 | 10 | 5.65 | 1 | -0.04 |
| Connecticut | 24 | 24 | 23 | 24 | 30 | 5.11 | 31 | 5.08 | 1 | -0.03 |
| Delaware | 50 | 50 | 50 | 50 | 50 | 1.49 | 50 | 1.45 | 0 | -0.04 |
| Florida | 14 | 8 | 9 | 15 | 15 | 5.52 | 16 | 5.48 | 1 | -0.04 |
| Georgia | 13 | 14 | 15 | 14 | 14 | 5.54 | 12 | 5.57 | -2 | 0.03 |
| Hawaii | 22 | 21 | 21 | 22 | 23 | 5.33 | 25 | 5.30 | 2 | -0.03 |
| Idaho | 26 | 25 | 24 | 23 | 20 | 5.36 | 21 | 5.35 | 1 | -0.01 |
| Illinois | 37 | 36 | 37 | 37 | 42 | 4.60 | 42 | 4.58 | 0 | -0.03 |
| Indiana | 8 | 5 | 5 | 6 | 7 | 5.76 | 8 | 5.73 | 1 | -0.03 |
| Iowa | 45 | 43 | 34 | 34 | 28 | 5.17 | 23 | 5.33 | -5 | 0.16 |
| Kansas | 32 | 29 | 26 | 27 | 26 | 5.19 | 27 | 5.22 | 1 | 0.03 |
| Kentucky | 16 | 16 | 17 | 17 | 17 | 5.47 | 18 | 5.43 | 1 | -0.03 |
| Louisiana | 34 | 32 | 31 | 30 | 31 | 5.10 | 29 | 5.10 | -2 | 0.00 |
| Maine | 40 | 38 | 39 | 39 | 39 | 4.74 | 40 | 4.71 | 1 | -0.03 |
| Maryland | 36 | 35 | 35 | 35 | 36 | 4.86 | 37 | 4.83 | 1 | -0.03 |
| Massachusetts | 33 | 33 | 32 | 32 | 33 | 4.97 | 33 | 4.94 | 0 | -0.03 |
| Michigan | 6 | 6 | 6 | 7 | 8 | 5.72 | 9 | 5.69 | 1 | -0.03 |
| Minnesota | 42 | 41 | 42 | 42 | 43 | 4.48 | 43 | 4.42 | 0 | -0.05 |
| Mississippi | 9 | 10 | 11 | 11 | 6 | 5.81 | 6 | 5.78 | 0 | -0.03 |
| Missouri | 4 | 4 | 4 | 4 | 4 | 6.10 | 4 | 6.04 | 0 | -0.06 |
| Montana | 21 | 22 | 19 | 19 | 22 | 5.33 | 19 | 5.42 | -3 | 0.08 |
| Nebraska | 28 | 27 | 29 | 28 | 27 | 5.18 | 20 | 5.36 | -7 | 0.18 |
| Nevada | 41 | 39 | 38 | 38 | 38 | 4.74 | 39 | 4.71 | 1 | -0.03 |
| New Hampshire | 39 | 40 | 40 | 40 | 40 | 4.71 | 32 | 4.97 | -8 | 0.26 |
| New Jersey | 44 | 44 | 44 | 44 | 44 | 4.17 | 44 | 4.29 | 0 | 0.12 |
| New Mexico | 18 | 18 | 18 | 18 | 18 | 5.41 | 22 | 5.35 | 4 | -0.06 |
| New York | 19 | 19 | 25 | 26 | 25 | 5.23 | 28 | 5.20 | 3 | -0.03 |
| North Carolina | 3 | 3 | 3 | 3 | 3 | 6.35 | 3 | 6.31 | 0 | -0.05 |
| North Dakota | 5 | 7 | 7 | 8 | 10 | 5.67 | 7 | 5.75 | -3 | 0.08 |
| Ohio | 46 | 46 | 45 | 45 | 45 | 3.97 | 45 | 3.95 | 0 | -0.02 |
| Oklahoma | 12 | 13 | 14 | 5 | 5 | 5.89 | 5 | 5.86 | 0 | -0.03 |
| Oregon | 25 | 45 | 49 | 49 | 49 | 2.50 | 49 | 2.32 | 0 | -0.18 |
| Pennsylvania | 43 | 42 | 43 | 43 | 37 | 4.76 | 38 | 4.82 | 1 | 0.06 |
| Rhode Island | 35 | 34 | 33 | 33 | 34 | 4.94 | 35 | 4.91 | 1 | -0.03 |
| South Carolina | 7 | 9 | 10 | 10 | 11 | 5.67 | 11 | 5.64 | 0 | -0.03 |
| South Dakota | 1 | 1 | 1 | 1 | 1 | 10.00 | 1 | 10.00 | 0 | 0.00 |
| Tennessee | 49 | 49 | 48 | 48 | 48 | 3.28 | 48 | 3.57 | 0 | 0.29 |
| Texas | 47 | 47 | 46 | 46 | 46 | 3.96 | 46 | 3.94 | 0 | -0.02 |
| Utah | 15 | 15 | 16 | 16 | 16 | 5.50 | 17 | 5.45 | 1 | -0.04 |
| Vermont | 38 | 37 | 36 | 36 | 35 | 4.90 | 36 | 4.87 | 1 | -0.03 |
| Virginia | 20 | 20 | 20 | 20 | 21 | 5.36 | 24 | 5.32 | 3 | -0.03 |
| Washington | 48 | 48 | 47 | 47 | 47 | 3.89 | 47 | 3.87 | 0 | -0.02 |
| West Virginia | 23 | 23 | 22 | 21 | 24 | 5.31 | 26 | 5.25 | 2 | -0.06 |
| Wisconsin | 27 | 26 | 28 | 29 | 29 | 5.13 | 30 | 5.10 | 1 | -0.03 |
| Wyoming | 1 | 1 | 1 | 1 | 1 | 10.00 | 1 | 10.00 | 0 | 0.00 |
| District of Columbia | 29 | 28 | 30 | 31 | 32 | 5.08 | 32 | 5.05 | 0 | -0.03 |
Source: Tax Foundation.
Corporate Tax Rate
The corporate tax rate subindex is designed to gauge how a state’s corporate income tax top marginal rate, bracket structure, and gross receipts rate affect its competitiveness compared to other states, as the extent of taxation can affect a business’s level of economic activity within a state.[15]
A state’s corporate tax is levied in addition to the federal corporate income tax of 21 percent, substantially reduced by the Tax Cuts and Jobs Act of 2017 from a graduated-rate tax with a top rate of 35 percent, the highest rate among industrialized nations. Two states levy neither a corporate income tax nor a gross receipts tax: South Dakota and Wyoming. These states automatically score a perfect 10 on this subindex. Therefore, this section ranks the remaining 48 states relative to each other.
Top Corporate Income Tax Rate. New Jersey’s 11.5 percent rate (including a temporary and retroactive surcharge) qualifies for the worst ranking among states that levy one, followed by Minnesota’s 9.8 percent rate. Other states with comparatively high corporate income tax rates are Illinois (9.5 percent), Alaska (9.4 percent), Maine (8.93 percent), and California (8.84 percent). By contrast, North Carolina’s rate of 2.5 percent is the lowest nationally, followed by Missouri’s and Oklahoma’s (both at 4 percent), Colorado’s at 4.25 percent, Arkansas’s at 4.3 percent, and North Dakota’s at 4.31 percent. Other states with comparatively low top corporate tax rates are Utah (4.55 percent), Arizona and Indiana (both at 4.9 percent), and Kentucky, Mississippi, and South Carolina (all at 5 percent). Gross receipts taxes are assessed separately using the general rate (ignoring some specific sectors that may face higher rates), which ranges from 0.111 percent in Nevada to 0.75 percent in Texas.
Graduated Rate Structure. A variable that is used to assess the economic drag created by multiple-rate corporate income tax systems is the number of tax brackets. Twenty-nine states and the District of Columbia have single-rate systems, and they score best. Single-rate systems are consistent with the sound tax principles of simplicity and neutrality. Alaska’s 10-bracket system earns the worst score in this category. In contrast to the individual income tax, there is no meaningful “ability to pay” concept in corporate taxation. Jeffery Kwall notes that
graduated corporate rates are inequitable—that is, the size of a corporation bears no necessary relation to the income levels of the owners. Indeed, low-income corporations may be owned by individuals with high incomes, and high-income corporations may be owned by individuals with low incomes.[16]
A single-rate system minimizes the incentive for firms to engage in expensive, counterproductive tax planning to mitigate the damage of higher marginal tax rates that some states levy as taxable incomeTaxable income is the amount of income subject to tax, after deductions and exemptions. Taxable income differs from—and is less than—gross income. rises.
Corporate Tax Base
This subindex measures the economic impact of each state’s definition of what should be subject to corporate taxation.
The four criteria used to measure the competitiveness of each state’s corporate tax base are given equal weight: the availability of certain tax credits, the ability of taxpayers to deduct net operating losses, the availability of deductions for capital investment and foreign income, and a host of smaller tax base issues that combine to make up the other fourth of the corporate tax base subindex.
Under a gross receipts tax, some of these tax base criteria (net operating losses and some corporate income tax base variables) are replaced by the availability of deductions from gross receipts for employee compensation costs and cost of goods sold. States are rewarded for granting these deductions because they diminish the greatest disadvantage of using gross receipts as the base for corporate taxation: the uneven effective tax rates that various industries pay, depending on how many levels of production are hit by the tax.
Net Operating Losses. The corporate income tax is designed to tax only the profits of a corporation. However, a yearly profit snapshot may not fully capture a corporation’s true profitability. For example, a corporation in a highly cyclical industry may look very profitable during boom years but lose substantial amounts during bust years. When examined over the entire business cycle, the corporation may actually have an average profit margin.
The deduction for net operating losses (NOLs) helps ensure that, over time, the corporate income tax is a tax on average profitability. Without the NOL deduction, corporations in cyclical industries pay much higher taxes than those in stable industries, even assuming identical average profits over time. Simply put, the NOL deduction helps level the playing field between cyclical and noncyclical industries. Under the Tax Cuts and Jobs Act, the federal government allows losses to be carried forward indefinitely, though they may only reduce taxable income by 80 percent in any given year. Because gross receipts taxes inherently preclude the possibility of carrying net operating losses backward or forward, the Index treats states with statewide gross receipts taxes as having the equivalent of no NOL carryback or carryforward provisions. The carryforward provisions are more important in the federal tax code and thus weighted more heavily (80 percent) than the carryback provisions (20 percent) on the Index.
Number of Years Allowed for Carryback and Carryforward. This variable measures the number of years allowed on a carryback or carryforward of an NOL deduction. The longer the overall time span, the higher the probability that the corporate income tax is being levied on the corporation’s average profitability. Following the federal treatment of NOLs, states entered FY 2025 with more favorable carryforward provisions (allowing carryforwards for up to an unlimited number of years) compared to carryback provisions (limited to a maximum of three years). States score well on the Index if they conform to federal guidelines or offer their own robust system for carryforwards and carrybacks.
Caps on the Amount of Carryback and Carryforward. When companies have a larger NOL than they can deduct in one year, most states permit them to carry deductions of any amount back to previous years’ returns or forward to future returns. States that limit those amounts are ranked lower in the Index. Two states, Idaho and Montana, limit the amount of carrybacks (to $100,000 and $500,000, respectively), though they do better than many of their peers in offering any carryback provisions at all. Of states that allow a carryforward of losses, only Illinois, New Hampshire, and Pennsylvania limit carryforwards. Illinois’ cap, originally intended to apply only to tax years 2021 through 2025, was recently increased from $100,000 to $500,000 and extended through 2027.
Gross Receipts Tax Deductions. Proponents of gross receipts taxation invariably praise the steadier flow of tax receipts into government coffers in comparison with the fluctuating revenue generated by corporate income taxes, but this stability comes at a great cost. The attractively low statutory rates associated with gross receipts taxes are an illusion. Since gross receipts taxes are levied many times in the production process, the effective tax rate on a product is much higher than the statutory rate would suggest. Effective tax rates under a gross receipts tax vary dramatically by industry or individual business, a stark departure from the principle of tax neutrality. Firms with few steps in their production chain are relatively lightly taxed under a gross receipts tax, and vertically integrated, high-margin firms prosper, while firms with longer production chains are exposed to a substantially higher tax burden. The pressure of this economic imbalance often leads lawmakers to enact separate rates for each industry, an inevitably unfair and inefficient process.
Two reforms that states can make to mitigate this damage are to permit deductions from gross receipts for employee compensation costs and cost of goods sold, effectively moving toward a regular corporate income tax.
Delaware, Nevada, Ohio, Oregon, Tennessee, and Washington score the worst, because their gross receipts taxes do not offer full deductions for either the cost of goods sold or employee compensation. Texas offers a deduction for either the cost of goods sold or employee compensation but not both. The Virginia BPOL tax, the West Virginia B&O tax, and the Pennsylvania business privilege tax are not included in this survey, because they are assessed at the local level and not levied uniformly across the state.
Federal Income Used as State Tax Base. States that use federal definitions of income reduce the tax compliance burden on their taxpayers. Two states (Arkansas and Mississippi) do not conform to federal definitions of corporate income, and they score poorly.
Allowance of Federal ACRS and MACRS DepreciationDepreciation is a measurement of the “useful life” of a business asset, such as machinery or a factory, to determine the multiyear period over which the cost of that asset can be deducted from taxable income. Instead of allowing businesses to deduct the cost of investments immediately (i.e., full expensing), depreciation requires deductions to be taken over time, reducing their value and discouraging investment. . The vast array of federal depreciation schedules is, by itself, a tax complexity nightmare for businesses. The specter of having 50 different schedules would be a disaster from a tax complexity standpoint. This variable measures the degree to which states have adopted the federal Accelerated Cost RecoveryCost recovery refers to how the tax system permits businesses to recover the cost of investments through depreciation or amortization. Depreciation and amortization deductions affect taxable income, effective tax rates, and investment decisions. System (ACRS) and Modified Accelerated Cost Recovery System (MACRS) depreciation schedules. One state (California) adds complexity by failing to fully conform to the federal system.
Deductibility of Depletion. The deduction for depletion works similarly to depreciation, but it applies to natural resources. As with depreciation, tax complexity would be staggering if all 50 states imposed their own depletion schedules. This variable measures the degree to which states have adopted the federal depletion schedules. Thirteen states are penalized because they do not fully conform to the federal system: Alaska, California, Delaware, Iowa, Louisiana, Maryland, Minnesota, Mississippi, New Hampshire, North Carolina, Oklahoma, Oregon, and Tennessee.
Alternative Minimum Tax. The federal alternative minimum tax (AMT) was created to ensure that all taxpayers paid some minimum level of taxes every year. Unfortunately, it does so by creating a parallel tax system to the standard corporate income tax code. Evidence shows that the AMT does not increase efficiency or improve fairness in any meaningful way. It nets little money for the government, imposes compliance costs that in some years are actually larger than collections, and encourages firms to cut back or shift their investments.[17] As such, states that have mimicked the federal AMT put themselves at a competitive disadvantage through needless tax complexity. Four states have an AMT on corporations and thus score poorly: California, Kentucky, Minnesota, and New Hampshire.
Deductibility of Foreign Taxes Paid. This variable measures the extent of double taxation on income used to pay foreign taxes, i.e., paying a tax on money the taxpayer has already mailed to foreign taxing authorities. States can avoid this double taxation by allowing the deduction of taxes paid to foreign jurisdictions. Twenty-three states allow deductions for foreign taxes paid and score well. The remaining states with corporate income taxation do not allow deductions for foreign taxes paid and thus score poorly.
Indexation of the Tax Code. For states that have multiple-bracket corporate income taxes, it is important to index the brackets for inflation. That prevents de facto tax increases on the nominal increase in income due to inflation. Put simply, this “inflation tax” results in higher tax burdens on taxpayers, usually without their knowledge or consent. All 15 states with graduated corporate income taxes fail to index their tax brackets: Alaska, Arkansas, Hawaii, Iowa, Kansas, Louisiana, Maine, Mississippi, Nebraska, New Jersey, New Mexico, New York, North Dakota, Oregon, and Vermont.
Throwback. To reduce the double taxation of corporate income, states use apportionment formulas that seek to determine how much of a company’s income a state can properly tax. Generally, states require a company with nexus (that is, sufficient connection to the state to justify the state’s power to tax its income) to apportion its income to the state based on some ratio of the company’s in-state property, payroll, and sales compared to its total property, payroll, and sales.
Among the 50 states, there is little harmony in apportionment formulas. Many states weight the three factors equally while others weight the sales factor more heavily or have transitioned to a single sales factor formula (a recent trend in state tax policy). Since many businesses make sales into states where they do not have nexus, businesses can end up with “nowhere income,” income that is not taxed by any state. To counter this phenomenon, many states have adopted what are called throwback rules because they identify nowhere income and throw it back into a state where it will be taxed, even though it was not earned in that state.
Throwback and throwout rules for sales of tangible property add yet another layer of tax complexity. Since two or more states can theoretically lay claim to “nowhere” income, rules have to be created and enforced to decide who gets to tax it. States with corporate income taxation are almost evenly divided between those with and without throwback rules. Twenty-four states avoid imposing them, while 21 states and the District of Columbia do.
Section 168(k) Expensing. Because corporate income taxes are intended to fall on net income, they should include deductions for business expenses—including investment in machinery and equipment. Historically, however, businesses have been required to depreciate the value of these purchases over time. In recent years, the federal government offered “bonus depreciationBonus depreciation allows firms to deduct a larger portion of certain “short-lived” investments in new or improved technology, equipment, or buildings in the first year. Allowing businesses to write off more investments partially alleviates a bias in the tax code and incentivizes companies to invest more, which, in the long run, raises worker productivity, boosts wages, and creates more jobs. ” to accelerate the deduction for these investments, and under the Tax Cuts and Jobs Act, investments in machinery and equipment are fully deductible in the first year, a policy known as “full expensingFull expensing allows businesses to immediately deduct the full cost of certain investments in new or improved technology, equipment, or buildings. It alleviates a bias in the tax code and incentivizes companies to invest more, which, in the long run, raises worker productivity, boosts wages, and creates more jobs. .” This provision is set to expire in 2027 and has already started to phase out. Sixteen states follow the federal government in offering the 60 percent write-off of eligible property, while three offer “bonus depreciation” short of the federal amount. Oklahoma and Mississippi are the only two states that have transitioned to permanent full expensing.
Net Interest Limitation. Federal law now restricts the deduction of business interest, limiting the deduction to 30 percent of modified income, with the ability to carry the remainder forward to future tax years. This change was intended to eliminate the bias in favor of debt financing (over equity financing) in the federal code, but particularly when states adopt this limitation without incorporating its counterbalancing provision, full expensing, the result is higher investment costs. Thirty-three states and the District of Columbia conform to the net interest limitation.
Inclusion of GILTI. Historically, states have largely avoided taxing international income. Following federal tax reform, however, some states have latched onto the federal provision for the taxation of GILTI, intended as a guardrail for the new federal territorial system of taxation, as a means to broaden their tax bases to include foreign business activity. States that tax GILTI are penalized in the Index, while states receive partial credit for moderate taxation of GILTI (for instance, by adopting the Section 250 deduction) and are rewarded for decoupling or almost fully decoupling from GILTI (by, for instance, treating it as largely deductible foreign dividend income in addition to providing the Section 250 deduction).
Tax Credits
Many states provide tax credits that lower the effective tax rates for certain industries and investments, often for large firms from out of state that are considering a move. Policymakers create these deals under the banner of job creation and economic development, but the truth is that if a state needs to offer such packages, it is most likely covering for a bad business tax climate. Economic development and job creation tax credits complicate the tax system, narrow the tax base, drive up tax rates for companies that do not qualify, distort the free market, and often fail to achieve economic growth.[18]
A more effective approach is to systematically improve the business tax climate for the long term. Thus, this component rewards those states that do not offer the following tax credits, with states that offer them scoring poorly.
Investment Tax Credits. Investment tax credits typically offer an offset against tax liability if the company invests in new property, plants, equipment, or machinery in the state offering the credit. Sometimes, the new investment will have to be “qualified” and approved by the state’s economic development office. Investment tax credits distort the market by rewarding investment in new property as opposed to the renovation of old property.
Job Tax Credits. Job tax credits typically offer an offset against tax liability if the company creates a specified number of jobs over a specified period of time. Sometimes, the new jobs will have to be “qualified” and approved by the state’s economic development office, allegedly to prevent firms from claiming that jobs shifted were jobs added. Even if administered efficiently, job tax credits can misfire in a number of ways. They induce businesses whose economic position would be best served by spending more on new equipment or marketing to hire new employees instead. They also favor businesses that are expanding anyway, punishing firms that are already struggling. Thus, states that offer such credits score poorly on the Index.
Research and Development (R&D) Tax Credits. Research and development tax credits reduce the amount of tax due by a company that invests in “qualified” research and development activities. The theoretical argument for R&D tax credits is that they encourage the kind of basic research that is not economically justifiable in the short run but that is better for society in the long run. In practice, their negative side effects—greatly complicating the tax system and establishing a government agency as the arbiter of what types of research meet a criterion so difficult to assess—far outweigh the potential benefits. Thus, states that offer such credits score poorly on the Index.
Individual Income Taxes
The individual income tax component, which accounts for 30.5 percent of each state’s total Index score, is important to both individuals and businesses because a significant number of businesses, including sole proprietorships, partnerships, and S corporations, report their income through the individual income tax code.
Taxes can have a significant impact on an individual’s decision to become a self-employed entrepreneur. Gentry and Hubbard found, “While the level of the marginal tax rateThe marginal tax rate is the amount of additional tax paid for every additional dollar earned as income. The average tax rate is the total tax paid divided by total income earned. A 10 percent marginal tax rate means that 10 cents of every next dollar earned would be taken as tax. has a negative effect on entrepreneurial entry, the progressivity of the tax also discourages entrepreneurship, and significantly so for some groups of households.”[19] Using education as a measure of potential for innovation, Gentry and Hubbard found that a progressive taxA progressive tax is one where the average tax burden increases with income. High-income families pay a disproportionate share of the tax burden, while low- and middle-income taxpayers shoulder a relatively small tax burden. system “discourages entry into self-employment for people of all educational backgrounds.” Moreover, citing Carroll, Holtz-Eakin, Rider, and Rosen,[20] Gentry and Hubbard contend, “Higher tax rates reduce investment, hiring, and small business income growth.” Less neutral individual income tax systems, therefore, hurt entrepreneurship and a state’s tax competitiveness.
Another important reason individual income tax rates are critical for businesses is the cost of labor. Labor typically constitutes a major business expense, so anything that hurts the labor pool will also affect business decisions and the economy. Complex, poorly designed tax systems that extract an inordinate amount of tax revenue reduce both the quantity and quality of the labor pool. This is consistent with the findings of Wasylenko and McGuire,[21] who found that individual income taxes affect businesses indirectly by influencing the location decisions of individuals. A progressive, multi-rate income tax exacerbates this problem by increasing the marginal tax rate at higher levels of income, continually reducing the value of work vis-à-vis the value of leisure.
For example, suppose a worker has to choose between one hour of additional work worth $40 and one hour of leisure which to him is worth $38. A rational person would choose to work for another hour. But if a 10 percent income tax rate reduces the after-tax value of labor to $36, then a rational person would stop working and take the hour to pursue leisure. Additionally, workers earning higher wages who face progressively higher marginal tax rates are more likely to be discouraged from working additional hours. In the aggregate, the income tax reduces the available labor supply.[22]
The individual income tax rate subindex measures the impact of tax rates on the marginal dollar of individual income using three criteria: the top tax rate and the progressivity of the individual income tax code. The rates and brackets used are for a single taxpayer, not a couple filing a joint return.
The individual income tax base subindex takes into account measures enacted to prevent double taxation, whether the code is indexed for inflation, and how the tax code treats married couples compared to singles. States that score well protect married couples from being taxed more severely than if they had filed as two single individuals. They also protect taxpayers from double taxation by recognizing S corporations under the individual tax code and indexing their brackets, exemptions, and deductions for inflation. The base subindex also accounts for the filing and withholding thresholds for nonresidents.
States that do not impose an individual income tax generally receive a perfect score, and states that do impose an individual income tax will generally score well if they have a flat, low tax rate with few deductions and exemptions. States that score poorly have complex, multiple-rate systems.
The seven states without an individual income tax or non-UI payroll tax are, not surprisingly, the highest-scoring states on this component: Alaska, Florida, South Dakota, Tennessee, Texas, Washington, and Wyoming. Nevada, which taxes wage income (but not unearned income) at a low rate under a capped non-UI payroll tax, also does extremely well in this component of the Index. New Hampshire also scores well, because while the state levies a tax on individual income in the form of interest and dividends, it does not tax wages and salaries. Arizona, Montana, Utah, Indiana, Illinois, Idaho, Michigan, North Dakota, Iowa, and Colorado score highly because they have a single, comparatively low tax rate.
Scoring near the bottom of this component are states that have high tax rates and very progressive bracket structures. They generally fail to index their brackets, exemptions, and deductions for inflation, do not allow for deductions of foreign or other state taxes, penalize married couples filing jointly, and do not recognize S corporations.
Table 4. Individual Income Tax Component of the State Tax Competitiveness Index (2020–2025)
| State | 2020 | 2021 | 2022 | 2023 | 2024 Rank | 2024 Score | 2025 Rank | 2025 Score | 2024-2025 Rank | 2024-2025 Score |
|---|---|---|---|---|---|---|---|---|---|---|
| Alabama | 32 | 33 | 31 | 33 | 33 | 4.93 | 34 | 4.89 | 1 | -0.04 |
| Alaska | 1 | 1 | 1 | 1 | 1 | 10.00 | 1 | 10.00 | 0 | 0.00 |
| Arizona | 14 | 14 | 14 | 8 | 8 | 6.41 | 8 | 6.31 | 0 | -0.11 |
| Arkansas | 43 | 44 | 44 | 42 | 39 | 4.57 | 39 | 4.66 | 0 | 0.09 |
| California | 50 | 50 | 49 | 49 | 49 | 2.41 | 49 | 2.37 | 0 | -0.04 |
| Colorado | 15 | 15 | 15 | 16 | 16 | 5.69 | 18 | 5.64 | 2 | -0.05 |
| Connecticut | 47 | 47 | 47 | 47 | 47 | 3.49 | 47 | 3.44 | 0 | -0.04 |
| Delaware | 40 | 42 | 42 | 41 | 41 | 4.55 | 42 | 4.54 | 1 | -0.01 |
| Florida | 1 | 1 | 1 | 1 | 1 | 10.00 | 1 | 10.00 | 0 | 0.00 |
| Georgia | 35 | 35 | 34 | 35 | 34 | 4.89 | 31 | 5.08 | -3 | 0.19 |
| Hawaii | 46 | 46 | 46 | 46 | 46 | 3.72 | 46 | 3.76 | 0 | 0.05 |
| Idaho | 19 | 19 | 16 | 15 | 11 | 5.89 | 11 | 5.85 | 0 | -0.04 |
| Illinois | 10 | 11 | 11 | 12 | 14 | 5.80 | 13 | 5.81 | -1 | 0.01 |
| Indiana | 17 | 17 | 18 | 18 | 20 | 5.59 | 16 | 5.71 | -4 | 0.12 |
| Iowa | 42 | 39 | 38 | 39 | 17 | 5.62 | 19 | 5.62 | 2 | 0.00 |
| Kansas | 24 | 24 | 24 | 25 | 27 | 5.25 | 27 | 5.26 | 0 | 0.01 |
| Kentucky | 23 | 22 | 22 | 23 | 23 | 5.37 | 23 | 5.40 | 0 | 0.03 |
| Louisiana | 38 | 38 | 37 | 29 | 31 | 5.07 | 33 | 5.01 | 2 | -0.06 |
| Maine | 16 | 16 | 17 | 17 | 21 | 5.57 | 22 | 5.53 | 1 | -0.03 |
| Maryland | 45 | 45 | 45 | 45 | 45 | 3.81 | 45 | 3.81 | 0 | 0.00 |
| Massachusetts | 12 | 12 | 12 | 13 | 40 | 4.56 | 41 | 4.54 | 1 | -0.01 |
| Michigan | 13 | 13 | 13 | 14 | 12 | 5.83 | 14 | 5.75 | 2 | -0.08 |
| Minnesota | 44 | 43 | 43 | 44 | 44 | 4.33 | 44 | 4.35 | 0 | 0.02 |
| Mississippi | 30 | 30 | 30 | 31 | 32 | 5.07 | 32 | 5.06 | 0 | -0.01 |
| Missouri | 21 | 20 | 20 | 21 | 18 | 5.61 | 20 | 5.58 | 2 | -0.03 |
| Montana | 22 | 21 | 21 | 20 | 22 | 5.49 | 10 | 5.92 | -12 | 0.43 |
| Nebraska | 27 | 27 | 27 | 28 | 29 | 5.16 | 26 | 5.28 | -3 | 0.11 |
| Nevada | 7 | 7 | 8 | 7 | 7 | 7.09 | 7 | 6.96 | 0 | -0.13 |
| New Hampshire | 11 | 10 | 10 | 11 | 10 | 5.93 | 12 | 5.84 | 2 | -0.10 |
| New Jersey | 49 | 48 | 48 | 48 | 48 | 2.50 | 48 | 2.57 | 0 | 0.07 |
| New Mexico | 28 | 28 | 36 | 37 | 37 | 4.80 | 37 | 4.73 | 0 | -0.07 |
| New York | 48 | 49 | 50 | 50 | 50 | 2.00 | 50 | 2.11 | 0 | 0.10 |
| North Carolina | 18 | 18 | 19 | 19 | 19 | 5.60 | 21 | 5.57 | 2 | -0.03 |
| North Dakota | 20 | 23 | 23 | 24 | 15 | 5.79 | 17 | 5.69 | 2 | -0.10 |
| Ohio | 33 | 31 | 26 | 26 | 28 | 5.21 | 25 | 5.28 | -3 | 0.07 |
| Oklahoma | 34 | 34 | 33 | 32 | 25 | 5.29 | 28 | 5.24 | 3 | -0.06 |
| Oregon | 37 | 37 | 41 | 43 | 43 | 4.50 | 40 | 4.56 | -3 | 0.06 |
| Pennsylvania | 39 | 40 | 39 | 38 | 38 | 4.70 | 38 | 4.68 | 0 | -0.03 |
| Rhode Island | 25 | 25 | 25 | 27 | 30 | 5.16 | 30 | 5.11 | 0 | -0.05 |
| South Carolina | 26 | 26 | 28 | 22 | 24 | 5.37 | 24 | 5.35 | 0 | -0.02 |
| South Dakota | 1 | 1 | 1 | 1 | 1 | 10.00 | 1 | 10.00 | 0 | 0.00 |
| Tennessee | 8 | 8 | 1 | 1 | 1 | 10.00 | 1 | 10.00 | 0 | 0.00 |
| Texas | 1 | 1 | 1 | 1 | 1 | 10.00 | 1 | 10.00 | 0 | 0.00 |
| Utah | 9 | 9 | 9 | 9 | 9 | 6.05 | 9 | 5.99 | 0 | -0.06 |
| Vermont | 41 | 41 | 40 | 40 | 42 | 4.51 | 43 | 4.51 | 1 | 0.00 |
| Virginia | 36 | 36 | 35 | 36 | 35 | 4.85 | 36 | 4.81 | 1 | -0.04 |
| Washington | 1 | 1 | 1 | 10 | 13 | 5.83 | 15 | 5.74 | 2 | -0.08 |
| West Virginia | 29 | 29 | 29 | 30 | 26 | 5.28 | 29 | 5.23 | 3 | -0.05 |
| Wisconsin | 31 | 32 | 32 | 34 | 36 | 4.85 | 35 | 4.84 | -1 | -0.01 |
| Wyoming | 1 | 1 | 1 | 1 | 1 | 10.00 | 1 | 10.00 | 0 | 0.00 |
| District of Columbia | 46 | 46 | 46 | 48 | 48 | 3.45 | 47 | 3.50 | -1 | 0.05 |
Source: Tax Foundation.
Individual Income Tax Rate
The rate subindex compares the states that tax individual income after setting aside the four states that do not and therefore receive perfect scores: Alaska, Florida, South Dakota, and Wyoming. Tennessee, Texas, and Washington do not have an individual income tax, but they do tax S corporationAn S corporation is a business entity which elects to pass business income and losses through to its shareholders. The shareholders are then responsible for paying individual income taxes on this income. Unlike subchapter C corporations, an S corporation (S corp) is not subject to the corporate income tax (CIT). income—and Texas and Washington tax LLC income—through their gross receipts taxes. Nevada has a low-rate payroll tax on wage income. New Hampshire, meanwhile, does not tax wage and salary income but does tax interest and dividend income.
Top Marginal Tax Rate. California has the highest top income tax rate of 13.3 percent. Other states with high top rates include Hawaii (11.0 percent), New York (10.9 percent), New Jersey (10.75 percent), Oregon (9.9 percent), Minnesota (9.85 percent), Massachusetts (9 percent with an additional 0.63 percent payroll tax), and Vermont (8.75 percent).
States with the lowest top statutory rates are Arizona and North Dakota (both at 2.5 percent); New Hampshire (3 percent); Indiana (3.05 percent); Pennsylvania (3.07 percent); Ohio (3.5 percent); Arkansas (3.9 percent); Kentucky (4 percent); Michigan, Louisiana, and Colorado (4.25 percent); North Carolina (4.5 percent); Utah (4.55 percent); Mississippi (4.7 percent); and Oklahoma (4.75 percent).[23]
In addition to statewide income tax rates, some states allow local-level income taxes.[24] We represent these as the average between the rates in the two largest jurisdictions. In some cases, states authorizing local-level income taxes still keep the level of income taxation modest overall. For instance, Alabama, Indiana, Michigan, and Pennsylvania allow local income add-ons, but are still among the states with the lowest overall rates. However, in recent years, local income tax rates have gone up considerably, offsetting some of the benefits of recent state income tax reforms.
Top Tax Bracket Threshold. This variable assesses the degree to which pass-through businesses are subject to reduced after-tax return on investment as net income rises. States are rewarded for a top rate that kicks in at lower levels of income, because doing so approximates a less distortionary flat-rate system. For example, Alabama has a progressive income tax structure with three income tax rates. However, because Alabama’s top rate of 5 percent applies to all taxable income over $3,000, the state’s income tax rate structure is nearly flat.
States with flat-rate systems score the best on this variable because their top rate kicks in at the first dollar of income (after accounting for the standard deduction and personal exemption). They are Arizona, Colorado, Idaho, Illinois, Indiana, Kentucky, Michigan, New Hampshire, North Carolina, Pennsylvania, and Utah. States with high kick-in levels score the worst. These include New York ($25 million); California, Massachusetts, and New Jersey ($1 million); and Connecticut ($500,000).
Number of Brackets. States with flat income tax systems essentially have one bracket and score highly on this variable. On the other end of the spectrum, Hawaii scores worst with 12 brackets, followed by California with 10 brackets, New York with 9 brackets, Maryland with 8 brackets, and Connecticut, New Jersey, and Missouri with 7 brackets.
Progressivity of the Individual Income Tax Rate Structure. This variable assesses the ratio of the top marginal tax rate (faced by high earners and most pass-through entities) to the marginal tax rate that a household with median income faces in a given tax year. States with flat income taxes or where the top rate kicks in at relatively low income levels (e.g., Kansas, Missouri, or Virginia) score a 1 on this variable, meaning tax incentives for high earners are not distorted. States with highly progressive individual income tax codes include Vermont (with a ratio of 2.61, as the top marginal tax rate of 8.75 percent is much higher than the 3.35 percent rate faced by a median household), California (2.22), and New York (1.98). High earners in these states face significantly higher-than-average tax burdens and may be incentivized to make costly relocation decisions.[25]
Income Recapture. Connecticut and New York apply the rate of the top income tax bracket to previous taxable income after the taxpayer crosses the top bracket threshold, while Arkansas imposes different tax tables depending on the filer’s level of income. New York’s recapture provision is the most damaging and results in an approximately $22,000 penalty for reaching the top bracket. Income recapture provisions are poor policy, because they result in dramatically high marginal tax rates at the point of their kick-in, and they are nontransparent in that they raise tax burdens substantially without being reflected in the statutory rate.
Individual Income Tax Base
States define taxable income differently, with some creating greater impediments to economic activity than others. The base subindex gives equal weight to 10 variables, including double taxation, indexation of tax provisions, the marriage penalty, and filing and withholding thresholds, among other factors.
The states with no individual income tax achieve perfect neutrality. Nevada’s payroll tax keeps the state from achieving a perfect store. Of the other 43 states, Montana, Arizona, Illinois, Maine, Idaho, Utah, Missouri, and Michigan have the best scores, avoiding many problems with the definition of taxable income that plague other states. Meanwhile, states where the tax base is found to cause an unnecessary drag on economic activity include New Jersey, California, New York, Pennsylvania, Maryland, Connecticut, Arkansas, and Delaware.
Marriage Penalty. A marriage penalty exists when a state’s standard deduction and tax brackets for married taxpayers filing jointly are not double those for single filers. As a result, two singles (if combined) can have a lower tax bill than a married couple filing jointly with the same income. This is discriminatory and has serious business ramifications. The top-earning 20 percent of taxpayers are dominated (85 percent) by married couples. This same 20 percent also has the highest concentration of business owners of all income groups.[26] Because of these concentrations, marriage penalties have the potential to affect a significant share of pass-through businesses. Twenty states and the District of Columbia have marriage penalties built into their income tax brackets.
Some states attempt to get around the marriage penalty problem by allowing married couples to file as if they were singles or by offering an offsetting tax creditA tax credit is a provision that reduces a taxpayer’s final tax bill, dollar-for-dollar. A tax credit differs from deductions and exemptions, which reduce taxable income rather than the taxpayer’s tax bill directly. . While helpful in offsetting the dollar cost of the marriage penalty, these solutions come at the expense of added tax complexity. Still, states that allow married couples to file as singles do not receive a marriage penalty score reduction.
Filing and Withholding Thresholds. This variable assesses states’ individual income tax filing and withholding requirements for nonresidents who conduct a limited amount of work in the state. States that score well on this variable provide meaningful filing and withholding relief to most nonresidents who spend a limited amount of time working in the state.
States that require filing and withholding only after nonresidents have worked in the state more than 30 days receive a perfect score. For states that have income-based thresholds, we converted those thresholds into their days-based equivalents based on a median daily household income. However, because income thresholds tend to be significantly more complex than day-based thresholds, states with income-based thresholds receive a 25 percent penalty.
States that have an individual income tax and receive a perfect score on this variable are Indiana and Montana, which both require filing and withholding only after a nonresident has worked in the state more than 30 days. The District of Columbia receives a perfect score because federal law prohibits DC from levying income taxes on nonresidents. Arizona receives a perfect score for withholding, but its lack of a meaningful filing threshold yields a total score of 5.00.
Louisiana, North Dakota, Utah, and West Virginia have relatively generous day-based thresholds, but these thresholds are available only to individuals who live in states that forgo an individual income tax or have a “substantially similar exclusion.” Since only 30 percent of the US population lives in states that forgo an individual income tax or have substantial day-based filing and withholding thresholds, these states receive a 70 percent penalty for the approximately 70 percent of the US population that does not qualify for relief under their thresholds.
Double Taxation of Capital Income. Since most states with an individual income tax system mimic the federal income tax code, they also possess its greatest flaw: the double taxation of capital income. Double taxation is brought about by the interaction between the corporate income tax and the individual income tax. The ultimate source of most capital income—interest, dividends, and capital gains—is corporate profits. The corporate income tax reduces the level of profits that can eventually be used to generate interest or dividend payments or capital gains.[27] This capital income must then be declared by the receiving individual and taxed. The result is the double taxation of this capital income—first at the corporate level and again at the individual level.
All states that tax all types of income score poorly by this criterion. New Hampshire, which taxes individuals on interest and dividends, scores somewhat better because it does not tax capital gains. Washington scores even better on this metric because it taxes certain capital gains income but does not tax wage and salary income. Nevada’s payroll tax does not apply to capital income, and thus scores perfectly on this measure, along with states that forgo all income taxation.
Federal Income Used as State Tax Base. Despite the shortcomings of the federal government’s definition of income, states that use it reduce the tax compliance burden on taxpayers. Five states score poorly because they do not conform to federal definitions of individual income: Alabama, Arkansas, Mississippi, New Jersey, and Pennsylvania.
Alternative Minimum Tax. At the federal level, the alternative minimum tax was created in 1969 to ensure that all taxpayers paid some minimum level of taxes every year. Unfortunately, it does so by creating a parallel tax system to the standard individual income tax code. AMTs are an inefficient way to prevent tax deductions and credits from totally eliminating tax liability. As such, states that have mimicked the federal AMT put themselves at a competitive disadvantage through needless tax complexity. Four states score poorly for imposing an AMT on individuals: California, Colorado, Connecticut, and Minnesota.
Credit for Taxes Paid. This variable measures the extent of double taxation on income used to pay foreign and state taxes, i.e., paying the same taxes twice. States can avoid double taxation by allowing a credit for state taxes paid to other jurisdictions.
Recognition of S Corporation Status. One important development in the federal tax system was the creation of the LLC and the S corporation. LLCs and S corporations provide businesses with some of the benefits of incorporation, such as limited liability, without the overhead of becoming a traditional C corporation. The profits of these entities are taxed under the individual income tax code, which avoids the double taxation problems that plague the corporate income tax system. Every state with a full individual income tax recognizes LLCs to at least some degree, and all but Louisiana recognize S corporations.
Indexation of the Tax Code. Indexing the tax code for inflation is critical to prevent de facto tax increases on the nominal increase in income due to inflation. This “inflation tax” results in higher tax burdens on taxpayers, usually without their knowledge or consent. Three areas of the individual income tax are commonly indexed for inflation: the standard deduction, personal exemptions, and tax brackets. Twenty-five states index all three or do not impose an individual income tax; 15 states and the District of Columbia index one or two of the three; and 10 states do not index at all.
Sales, Use, and Excise Taxes
Sales tax makes up 22.8 percent of each state’s Index score. The type of sales tax familiar to taxpayers is a tax levied on the purchase price of a good at the point of sale. Due to the inclusion of some business inputs in most states’ sales tax bases, the rate and structure of the sales tax is an important consideration for many businesses. The sales tax can also hurt the business tax climate and tax competitiveness because as the sales tax rate climbs, customers make fewer purchases or seek low-tax alternatives. As a result, business is lost to lower-tax locations, causing lost profits, lost jobs, and lost tax revenue.[28] The effect of differential sales tax rates among states or localities is apparent when a traveler crosses from a high-tax state to a neighboring low-tax state. Typically, a vast expanse of shopping malls springs up along the border in the low-tax jurisdiction.
On the positive side, sales taxes levied on goods and services at the point of sale to the end-user have at least two virtues. First, they are transparent: the tax is never confused with the price of goods by customers. Second, since they are levied at the point of sale, they are less likely to cause economic distortions than taxes levied at some intermediate stage of production (such as a gross receipts tax or sales taxes on business-to-business transactions).
The negative impact of sales taxes is well documented in the economic literature and through anecdotal evidence. For example, Bartik found that high sales taxes, especially sales taxes levied on equipment, had a negative effect on small business start-ups.[29] Moreover, companies have been known to avoid locating factories or facilities in certain states because the factory’s machinery would be subject to the state’s sales tax.[30]
States that create the most tax pyramiding and economic distortion, and therefore score the worst, are states that levy a sales tax that generally allows no exclusions for business inputs.[31] Hawaii, New Mexico, South Dakota, and Washington are examples of states that tax many business inputs. The ideal base for sales taxation is all goods and services at the point of sale to the end-user.
Excise taxes are selective sales taxes levied on specific goods. Goods subject to excise taxation are typically (but not always) perceived to be luxuries or vices, the latter of which are less sensitive to drops in demand when the tax increases their price. Examples typically include tobacco, liquor, and gasoline. The sales tax component of the Index takes into account the excise tax rates each state levies.
The five states without a state sales tax—Alaska,[32] Delaware, Montana, New Hampshire, and Oregon—achieve the best sales tax component scores. Among states with a sales tax, those with low general rates and broad bases, and which avoid tax pyramiding, do best. Wisconsin, Wyoming, Maine, Idaho, Virginia, Iowa, Michigan, Nebraska, and Florida all do well, with well-structured sales taxes and modest excise tax rates.
At the other end of the spectrum, Washington, Alabama, Louisiana, Tennessee, and California fare the worst, imposing high rates and taxing a range of business inputs, such as utilities, services, manufacturing, and leases—and maintaining relatively high excise taxes. Louisiana and Tennessee have the highest combined state and local rates of nearly 9.6 percent. In general, these states levy high sales tax rates that apply to a wide range of business input items.
Table 5. Sales, Use, and Excise Tax Component of the State Tax Competitiveness Index (2020–2025)
| State | 2020 | 2021 | 2022 | 2023 | 2024 Rank | 2024 Score | 2025 Rank | 2025 Score | 2024-2025 Rank | 2024-2025 Score |
|---|---|---|---|---|---|---|---|---|---|---|
| Alabama | 50 | 50 | 50 | 50 | 49 | 2.99 | 49 | 3.17 | 0 | 0.18 |
| Alaska | 5 | 5 | 5 | 5 | 5 | 8.08 | 5 | 7.86 | 0 | -0.22 |
| Arizona | 45 | 45 | 45 | 45 | 45 | 3.83 | 45 | 3.84 | 0 | 0.01 |
| Arkansas | 43 | 44 | 43 | 44 | 44 | 3.88 | 44 | 3.89 | 0 | 0.01 |
| California | 44 | 43 | 44 | 46 | 46 | 3.78 | 46 | 3.81 | 0 | 0.03 |
| Colorado | 32 | 32 | 38 | 37 | 37 | 4.16 | 37 | 4.19 | 0 | 0.03 |
| Connecticut | 25 | 25 | 24 | 23 | 21 | 4.84 | 21 | 4.87 | 0 | 0.03 |
| Delaware | 2 | 1 | 2 | 2 | 2 | 8.92 | 2 | 8.93 | 0 | 0.01 |
| Florida | 18 | 16 | 14 | 15 | 13 | 5.19 | 14 | 5.22 | 1 | 0.02 |
| Georgia | 24 | 22 | 21 | 21 | 22 | 4.83 | 23 | 4.83 | 1 | 0.00 |
| Hawaii | 26 | 26 | 26 | 26 | 25 | 4.78 | 28 | 4.67 | 3 | -0.11 |
| Idaho | 12 | 12 | 12 | 12 | 11 | 5.44 | 9 | 5.46 | -2 | 0.02 |
| Illinois | 34 | 34 | 33 | 32 | 35 | 4.37 | 38 | 4.18 | 3 | -0.19 |
| Indiana | 21 | 19 | 20 | 20 | 17 | 5.00 | 17 | 5.02 | 0 | 0.03 |
| Iowa | 16 | 17 | 16 | 17 | 14 | 5.18 | 11 | 5.41 | -3 | 0.23 |
| Kansas | 37 | 37 | 30 | 30 | 29 | 4.66 | 30 | 4.65 | 1 | -0.01 |
| Kentucky | 11 | 11 | 11 | 10 | 18 | 4.93 | 18 | 4.95 | 0 | 0.03 |
| Louisiana | 48 | 48 | 48 | 48 | 48 | 3.07 | 48 | 3.23 | 0 | 0.16 |
| Maine | 8 | 9 | 8 | 8 | 8 | 5.84 | 8 | 5.86 | 0 | 0.02 |
| Maryland | 13 | 13 | 37 | 40 | 39 | 4.11 | 39 | 4.10 | 0 | -0.01 |
| Massachusetts | 22 | 24 | 22 | 22 | 19 | 4.90 | 20 | 4.92 | 1 | 0.02 |
| Michigan | 9 | 8 | 9 | 9 | 10 | 5.59 | 12 | 5.40 | 2 | -0.19 |
| Minnesota | 31 | 31 | 31 | 31 | 31 | 4.62 | 34 | 4.38 | 3 | -0.24 |
| Mississippi | 29 | 28 | 27 | 27 | 26 | 4.75 | 25 | 4.77 | -1 | 0.01 |
| Missouri | 23 | 23 | 23 | 25 | 24 | 4.79 | 24 | 4.78 | 0 | -0.01 |
| Montana | 3 | 3 | 3 | 3 | 3 | 8.87 | 3 | 8.85 | 0 | -0.02 |
| Nebraska | 14 | 14 | 13 | 14 | 12 | 5.23 | 13 | 5.24 | 1 | 0.01 |
| Nevada | 35 | 38 | 36 | 36 | 41 | 4.01 | 40 | 4.03 | -1 | 0.02 |
| New Hampshire | 1 | 2 | 1 | 1 | 1 | 8.92 | 1 | 8.93 | 0 | 0.01 |
| New Jersey | 36 | 36 | 35 | 35 | 38 | 4.12 | 35 | 4.37 | -3 | 0.25 |
| New Mexico | 46 | 46 | 46 | 42 | 42 | 4.01 | 41 | 4.01 | -1 | 0.00 |
| New York | 42 | 42 | 41 | 41 | 40 | 4.04 | 42 | 3.97 | 2 | -0.07 |
| North Carolina | 19 | 20 | 19 | 19 | 16 | 5.04 | 16 | 5.07 | 0 | 0.02 |
| North Dakota | 15 | 15 | 15 | 16 | 15 | 5.16 | 15 | 5.17 | 0 | 0.01 |
| Ohio | 41 | 41 | 42 | 43 | 43 | 3.94 | 43 | 3.97 | 0 | 0.03 |
| Oklahoma | 38 | 33 | 32 | 33 | 33 | 4.45 | 32 | 4.45 | -1 | 0.01 |
| Oregon | 4 | 4 | 4 | 4 | 4 | 8.61 | 4 | 8.62 | 0 | 0.01 |
| Pennsylvania | 28 | 27 | 25 | 24 | 23 | 4.82 | 22 | 4.84 | -1 | 0.03 |
| Rhode Island | 30 | 29 | 29 | 29 | 28 | 4.69 | 26 | 4.71 | -2 | 0.02 |
| South Carolina | 33 | 35 | 34 | 34 | 34 | 4.37 | 33 | 4.39 | -1 | 0.02 |
| South Dakota | 40 | 40 | 40 | 39 | 32 | 4.51 | 31 | 4.53 | -1 | 0.02 |
| Tennessee | 47 | 47 | 47 | 47 | 47 | 3.64 | 47 | 3.66 | 0 | 0.02 |
| Texas | 39 | 39 | 39 | 38 | 36 | 4.20 | 36 | 4.21 | 0 | 0.01 |
| Utah | 27 | 30 | 28 | 28 | 27 | 4.70 | 27 | 4.68 | 0 | -0.02 |
| Vermont | 20 | 21 | 18 | 18 | 30 | 4.64 | 29 | 4.65 | -1 | 0.01 |
| Virginia | 10 | 10 | 10 | 11 | 9 | 5.65 | 10 | 5.43 | 1 | -0.22 |
| Washington | 49 | 49 | 49 | 49 | 50 | 2.94 | 50 | 2.94 | 0 | 0.00 |
| West Virginia | 17 | 18 | 17 | 13 | 20 | 4.89 | 19 | 4.92 | -1 | 0.03 |
| Wisconsin | 7 | 7 | 6 | 6 | 6 | 6.10 | 6 | 6.00 | 0 | -0.10 |
| Wyoming | 6 | 6 | 7 | 7 | 7 | 5.95 | 7 | 5.97 | 0 | 0.02 |
| District of Columbia | 41 | 41 | 41 | 41 | 43 | 4.00 | 41 | 4.01 | -2 | 0.02 |
Source: Tax Foundation.
Sales Tax Rate
The tax rate itself is important, and a state with a high sales tax rate reduces demand for in-state retail sales. Consumers will turn more frequently to cross-border or certain online purchases, leaving less business activity in the state. This subindex measures the highest possible sales tax rate applicable to in-state retail shopping and taxable business-to-business transactions (with the weight of 75 percent) as well as a range of excise taxes (with the weight of 25 percent). Four states—Delaware, Montana, New Hampshire, and Oregon—do not have state or local sales taxes and thus are assigned a sales tax rate of zero. Alaska is sometimes counted among states with no sales tax since it does not levy a statewide sales tax. However, Alaska localities are allowed to levy sales taxes and the weighted statewide average of these taxes is 1.82 percent.
The Index measures the state and local sales tax rate in each state. A combined rate is computed by adding the general state rate to the weighted average of the county and municipal rates. This subindex includes state and local sales tax rates, excise tax rates for major excise taxes, and digital advertising tax rates (currently only imposed by Maryland).
State Sales Tax Rate. Of the 45 states (and the District of Columbia) with a statewide sales tax, Colorado’s 2.9 percent rate is the lowest. Five states have a 4 percent state-level sales tax: Alabama, Georgia, Hawaii, New York, and Wyoming. At the other end is California with a 7.25 percent state sales tax, including a mandatory statewide local add-on tax. Tied for second highest are Indiana, Mississippi, Rhode Island, and Tennessee (all at 7 percent). Other states with high statewide rates include Minnesota (6.88 percent) and Nevada (6.85 percent).
Local Option Sales Tax Rates. Thirty-eight states authorize the use of local option sales taxes at the county and/or municipal level, and in some states, the local option sales tax significantly increases the tax rate faced by consumers.[33] Local jurisdictions in Colorado, for example, add an average of 4.91 percent in local sales taxes to the state’s 2.9 percent state-level rate, bringing the total average sales tax rate to 7.81 percent. This may be an understatement in some localities with much higher local add-ons, but by weighting each locality’s rate, the Index computes a statewide average of local rates that is comparable to the average in other states.
Alabama and Louisiana have the highest average local option sales taxes (5.29 and 5.12 percent, respectively), and in both states the average local option sales tax is higher than the state sales tax rate. Other states with high local option sales taxes include Colorado (4.91 percent), New York (4.53 percent), and Oklahoma (4.50 percent).
States with the highest combined state and average local sales tax rates are Louisiana (9.56 percent), Tennessee (9.56 percent), Arkansas (9.47 percent), Washington (9.45 percent), and Alabama (9.29 percent). At the low end are Alaska (1.82 percent), Hawaii (4.50 percent), Wyoming (5.44 percent), Maine (5.50 percent), and Wisconsin (5.70 percent).
Excise Tax Rates. Excise taxes are single-product sales taxes. Many of them are intended to reduce consumption of the product bearing the tax. Others, like the gasoline tax, are often used to fund specific projects such as road construction.
Gasoline and diesel excise taxes (levied per gallon) are usually justified as a form of user tax paid by those who benefit from road construction and maintenance. Though gas taxes—along with tolls—are one of the best ways to raise revenue for transportation projects (roughly approximating a user feeA user fee is a charge imposed by the government for the primary purpose of covering the cost of providing a service, directly raising funds from the people who benefit from the particular public good or service being provided. A user fee is not a tax, though some taxes may be labeled as user fees or closely resemble them. for infrastructure use), gasoline represents a large input for most businesses, so states that levy higher rates have a less competitive tax climate. State excise taxes on gasoline range from 69.82 cents in California to 8.95 cents per gallon in Alaska. The Index captures states’ base excise taxes in addition to other gallonage-based fees and ad valorem taxes placed upon gasoline. General sales tax rates that apply to gasoline are included in this calculated rate, but states that include, or partially include, gasoline in the sales tax base are rewarded in the sales tax breadth measure.
Tobacco, vaping, spirits, and beer excise taxes can discourage in-state consumption and encourage consumers to seek lower prices in neighboring jurisdictions.[34] This impacts a wide swath of retail outlets, such as convenience stores, that move large volumes of tobacco and beer products. The problem is exacerbated for those retailers located near the border of states with lower excise taxes as consumers move their shopping out of state—referred to as cross-border shopping.[35]
There is also the growing problem of cross-border smuggling of products from states and areas that levy low excise taxes on tobacco into states that levy high excise taxes on tobacco. This both increases criminal activity and reduces taxable sales by legitimate retailers.
States with the highest tobacco taxes per pack of 20 cigarettes are New York (at $5.35), Maryland ($5.00), Connecticut ($4.35), Rhode Island ($4.25), Minnesota ($3.77), and Massachusetts ($3.51), while states with the lowest tobacco taxes are Missouri ($0.17), Georgia ($0.37), North Dakota ($0.44), North Carolina ($0.45), and South Carolina and Idaho ($0.57).
States with the highest vaping taxes on a per mL basis are Maryland ($2.25), California ($1.47), Minnesota ($1.40), Vermont ($1.38), and Massachusetts ($1.24). Eighteen states have not levied any taxes on vaping products, maximizing the potential for harm reduction from vaping and state competitiveness, but the states that levy the lowest taxes on vapes are Delaware, Georgia, Kansas, North Carolina, and Wisconsin (each at $0.05).
States with the highest beer taxes on a per gallon basis are Tennessee ($1.29), Alaska ($1.07), Kentucky and Hawaii ($0.93), and South Carolina ($0.77), while states with the lowest beer taxes are Wyoming ($0.02), Missouri and Wisconsin ($0.06), and Colorado, Oregon, and Pennsylvania (each at $0.08). States with the highest spirits taxes per gallon are Washington ($36.55), Oregon ($22.86), and Virginia ($22.06), while states with the lowest spirits taxes are Wyoming and New Hampshire (these two states gain revenue directly from alcohol sales through government-run stores and have set prices low enough that they are comparable to buying spirits without taxes), Missouri ($2.00), and Colorado ($2.28).
Digital Advertising Tax. Currently imposed only in Maryland, the digital advertising tax is a harmful and nonneutral tax applied to gross revenue from digital advertising services. The definitions and sourcing rules for this tax are ambiguous and nontransparent, resulting in the double taxation of digital advertising profits.[36] Several other states are debating imposing this tax using Maryland as a model, and the new Index now penalizes states for imposing such a tax.
Sales Tax Base
The sales tax base subindex is computed according to five features of each state’s sales tax:
- Whether the base includes a variety of business-to-business transactions such as machinery, raw materials, office equipment, farm equipment, business leases, and several digital goods and services (software-as-a-service, platform-as-a-service, payroll services, B2B digital goods)
- Whether the base includes goods and services typically purchased by consumers, such as groceries, clothing, gasoline, e-books, and digital video services
- Whether the base includes services, such as financial, fitness, landscaping, repair, parking, dry cleaning, barber, and veterinary
- Whether the state leans on sales tax holidays, which temporarily exempt select goods from the sales tax
The top five states on this subindex—New Hampshire, Delaware, Montana, Oregon, and Alaska—are the five states without a general state sales tax. However, none receives a perfect score because each levies gasoline, diesel, tobacco, and beer excise taxes. States like Wisconsin, Iowa, Kansas, Maine, Illinois, Oklahoma, Florida, and Missouri achieve high scores on their tax base by avoiding the problems of tax pyramiding and adhering to low excise tax rates.
States with the worst scores on the base subindex are Hawaii, South Dakota, Ohio, Alabama, New Mexico, Louisiana, New Jersey, Arizona, and Washington. Their tax systems hamper economic growth by including too many business inputs, excluding too many consumer goods and services, and imposing excessive rates of excise taxation.
Sales Tax on Business-to-Business Transactions (Business Inputs). When a business must pay sales taxes on manufacturing equipment, raw materials, or digital services it uses in the production process, then that tax becomes part of the price of whatever the business makes with that equipment, materials, or digital services. The business must then collect sales tax on its own products, resulting in a tax charged on a price that already contains taxes. This tax pyramiding invariably results in some industries being taxed more heavily than others, which violates the principle of neutrality and causes economic distortions.
These variables are often inputs to other business operations. For example, a manufacturing firm will count the cost of transporting its final goods to retailers as a significant cost of doing business. Most firms, small and large alike, hire accountants, lawyers, and other professional service providers. If these services are taxed, then it is more expensive for every business to operate.
To understand how business-to-business sales taxes can distort the market, suppose a sales tax was levied on the sale of flour to a bakery. The bakery is not the end user because the flour will be baked into bread and sold to consumers. Economic theory is not clear as to which party will ultimately bear the burden of the tax. The tax could be “passed forward” onto the customer or “passed backward” onto the bakery.[37] Where the tax burden falls depends on how sensitive the demand for bread is to price changes. If customers tend not to change their bread-buying habits when the price rises, then the tax can be fully passed forward onto consumers. However, if the consumer reacts to higher prices by buying less, then the tax will have to be absorbed by the bakery as an added cost of doing business.
The hypothetical sales tax on all flour sales would distort the market, because different businesses that use flour have customers with varying price sensitivities. Suppose the bakery is able to pass the entire tax on flour forward to the consumer but the pizzeria down the street cannot. The owners of the pizzeria would face a higher cost structure and profits would drop. Since profits are the market signal for opportunity, the tax would tilt the market away from pizza-making. Fewer entrepreneurs would enter the pizza business, and existing businesses would hire fewer people. In both cases, the sales tax charged to purchasers of bread and pizza would be partly a tax on a tax because the tax on flour would be built into the price. Economists call this tax pyramiding, and public finance scholars overwhelmingly oppose applying the sales tax to business inputs due to the resulting pyramiding and lack of transparency.
Besley and Rosen found that for many products, the after-tax price of the good increased by the same amount as the tax itself.[38] That means a sales tax increase was passed along to consumers on a one-for-one basis. For other goods, however, they found that the price of the good rose by twice the amount of the tax, meaning that the tax increase translates into an even larger burden for consumers than is typically thought. Note that these inputs should only be exempt from sales tax if they are truly inputs into the production process. If they are consumed by an end user, they are properly includable in the state’s sales tax base.
In addition to traditional business inputs like raw materials and manufacturing equipment, the new version of the Index also accounts for digital business inputs, such as software-as-a-service, platform-as-a-service, payroll services, and other B2B digital goods. As digital services become a larger part of personal consumption and business transactions, digital taxation will increasingly shape state tax competitiveness in the years ahead.
States that create the most tax pyramiding and economic distortion, and therefore score the worst, are states that levy a sales tax that generally allows no exclusions for business inputs. Hawaii, South Dakota, New Mexico, and Washington are examples of states that tax many business inputs.
Sales Tax Breadth. An economically neutral sales tax base includes all final retail sales of goods and services purchased by the end users. In practice, however, states tend to include most goods, but relatively few services, in their sales tax bases, a growing issue in an increasingly service-oriented economy. Using John Mikesell’s methodology, we estimate that, nationwide, sales taxes extended to about 35 percent of all final consumption.[39] Exempting any goods or services narrows the tax base, drives up the sales tax rate on those items still subject to tax, and introduces unnecessary distortions into the market. A well-structured sales tax, however, does not fall upon business inputs. Therefore, states that tax services that are business inputs score poorly on the Index, while states are rewarded for expanding their base to include more final retail sales of goods and services, including digital services (e-books and digital video).
Sales Tax on Gasoline. There is no economic reason to exempt gasoline from the sales tax, as it is a final retail purchase by consumers. However, all but seven states do so. While all states levy an excise tax on gasoline, these funds are often dedicated for transportation purposes, making them a form of user tax distinct from the general sales tax. The five states that fully include gasoline in their sales tax base (Florida, Hawaii, Illinois, Indiana, and Michigan) get a better score. Several other states receive partial credit for applying an ad valorem tax to gasoline sales, but at a different rate than the general sales tax. New York currently applies local sales taxes only.
Sales Tax on Groceries. A well-structured sales tax includes all end-user goods in the tax base, to keep the base broad and rates low, and prevent distortions in the marketplace. Many states exempt groceries to reduce the incidence of the sales tax on low-income residents. Such an exemption, however, also benefits grocers and higher-income residents, and creates additional compliance costs due to the necessity of maintaining complex, ever-changing lists of exempt and nonexempt products. Public assistance programs such as the Women, Infants, and Children (WIC) program or the Supplement Nutrition Assistance Program (SNAP) provide more targeted assistance than excluding groceries from the sales tax base. Thirteen states include or partially include groceries in their sales tax base.
Remote Seller Protections. With the Supreme Court’s elimination of the physical presence requirement for imposing sales tax collection obligations, all states with sales taxes are now requiring remote sellers to collect and remit sales tax. While most states have adopted safe harbors for small sellers and have a single point of administration for all state and local sales taxes, a few diverge from these practices, imposing substantial compliance costs on out-of-state retailers. Alabama, Alaska (which only has local sales taxes), Colorado, and Louisiana lack uniform administration.
Property Taxes
The property tax component, which includes taxes on real and personal property, net worth, and the transfer of assets, accounts for 14.9 percent of each state’s Index score.
When properly structured, real property taxes exceed most other taxes in comporting with the benefit principle and can be fairly economically efficient. In the realm of public finance, they are often also prized for their comparative transparency among taxes, though that transparency may contribute to the public’s generally low view of property taxes. The Tax Foundation’s Survey of Tax Attitudes found that local property taxes are perceived as the second most unfair state or local tax.[40]
Property taxes matter to businesses, and the tax rate on commercial property is often higher than the tax on comparable residential property. Additionally, many localities and states levy taxes on the personal property or equipment owned by a business. They can be on assets ranging from cars to machinery and equipment to office furniture and fixtures, but are separate from real property taxes, which are taxes on land and buildings.
Businesses remitted over $1.07 trillion in state and local taxes in fiscal year 2022, of which $373 billion (34.7 percent) was for property taxes. The property taxes included tax on real, personal, and utility property owned by businesses.[41] Since property taxes can be a large burden on businesses, they can have a significant effect on location decisions.
Mark, McGuire, and Papke find taxes that vary from one location to another within a region could be uniquely important determinants of intraregional location decisions.[42] They find that higher rates of two business taxes—the sales tax and the personal property tax—are associated with lower employment growth. They estimate that a tax hike on personal property of one percentage point reduces annual employment growth by 2.44 percentage points.
Bartik,[43] finding that property taxes are a significant factor in business location decisions, estimates that a 10 percent increase in business property taxes decreases the number of new plants opening in a state by between 1 and 2 percent. Bartik backs up his earlier findings by concluding that higher property taxes negatively affect the establishment of small businesses.[44] He elaborates that the particularly strong negative effect of property taxes occurs because they are paid regardless of profits, and many small businesses are not profitable in their first few years, so high property taxes would be more influential than profit-based taxes on the start-up decision.
States that keep statewide property taxes low better position themselves to attract business investment. Localities competing for business can put themselves at a greater competitive advantage by keeping personal property taxes low.
Taxes on capital stock, tangible and intangible property, inventory, real estate transfers, estates, inheritance, and gifts are also included in the property tax component of the Index. The states that score the best on property tax are Delaware, New Mexico, Idaho, North Dakota, Indiana, Ohio, Nevada, Wisconsin, and Pennsylvania. These states generally have low property tax rates, measured as a percentage of income. They also avoid distortionary taxes like estate, inheritance, gift, and other wealth taxes. States that score poorly on the property tax component are Vermont, Connecticut, Maine, New York, Massachusetts, Nebraska, Wyoming, and Illinois. These states generally have high property tax rates and levy one or several wealth-based taxes.
The property tax portion of the Index is composed of two equally weighted subindices devoted to measuring the economic impact of both rates and bases. The rate subindex consists of property tax collections (measured as a percentage of personal income) and capital stock taxes. The base portion consists of dummy variables detailing whether each state levies wealth taxes such as inheritance, estate, gift, inventory, tangible or intangible property, and other similar taxes.[45]
Table 6. Property Tax Component of the State Tax Competitiveness Index (2020–2025)
| State | 2020 | 2021 | 2022 | 2023 | 2024 Rank | 2024 Score | 2025 Rank | 2025 Score | 2024-2025 Rank | 2024-2025 Score |
|---|---|---|---|---|---|---|---|---|---|---|
| Alabama | 16 | 17 | 16 | 15 | 15 | 5.43 | 14 | 5.47 | -1 | 0.04 |
| Alaska | 30 | 31 | 30 | 31 | 31 | 4.98 | 30 | 4.92 | -1 | -0.07 |
| Arizona | 14 | 12 | 12 | 12 | 10 | 5.65 | 13 | 5.68 | 3 | 0.04 |
| Arkansas | 28 | 29 | 29 | 25 | 25 | 5.16 | 19 | 5.23 | -6 | 0.07 |
| California | 15 | 14 | 13 | 18 | 18 | 5.27 | 23 | 5.18 | 5 | -0.10 |
| Colorado | 33 | 33 | 34 | 36 | 37 | 4.47 | 36 | 4.48 | -1 | 0.01 |
| Connecticut | 50 | 50 | 50 | 50 | 50 | 2.57 | 50 | 2.76 | 0 | 0.19 |
| Delaware | 1 | 1 | 1 | 2 | 1 | 6.66 | 1 | 6.58 | 0 | -0.08 |
| Florida | 17 | 15 | 14 | 16 | 17 | 5.36 | 21 | 5.22 | 4 | -0.13 |
| Georgia | 32 | 32 | 32 | 32 | 32 | 4.94 | 34 | 4.82 | 2 | -0.11 |
| Hawaii | 12 | 13 | 17 | 27 | 21 | 5.20 | 24 | 5.17 | 3 | -0.04 |
| Idaho | 6 | 5 | 5 | 5 | 3 | 6.32 | 3 | 6.36 | 0 | 0.03 |
| Illinois | 41 | 42 | 42 | 39 | 44 | 4.08 | 43 | 4.14 | -1 | 0.07 |
| Indiana | 3 | 4 | 3 | 4 | 4 | 6.26 | 5 | 6.32 | 1 | 0.06 |
| Iowa | 35 | 34 | 35 | 34 | 34 | 4.68 | 32 | 4.88 | -2 | 0.20 |
| Kansas | 26 | 24 | 27 | 26 | 28 | 5.08 | 29 | 4.99 | 1 | -0.09 |
| Kentucky | 20 | 23 | 22 | 20 | 22 | 5.20 | 27 | 5.07 | 5 | -0.13 |
| Louisiana | 27 | 27 | 23 | 19 | 19 | 5.26 | 16 | 5.31 | -3 | 0.05 |
| Maine | 45 | 43 | 46 | 48 | 47 | 3.39 | 48 | 3.16 | 1 | -0.23 |
| Maryland | 36 | 36 | 36 | 35 | 36 | 4.50 | 35 | 4.52 | -1 | 0.02 |
| Massachusetts | 42 | 44 | 45 | 45 | 46 | 3.92 | 46 | 3.93 | 0 | 0.01 |
| Michigan | 31 | 28 | 31 | 30 | 30 | 5.04 | 28 | 5.06 | -2 | 0.02 |
| Minnesota | 25 | 21 | 20 | 24 | 27 | 5.11 | 26 | 5.10 | -1 | -0.01 |
| Mississippi | 38 | 39 | 41 | 40 | 41 | 4.29 | 38 | 4.33 | -3 | 0.05 |
| Missouri | 9 | 8 | 10 | 9 | 11 | 5.64 | 11 | 5.69 | 0 | 0.05 |
| Montana | 23 | 22 | 26 | 22 | 20 | 5.23 | 18 | 5.29 | -2 | 0.06 |
| Nebraska | 43 | 45 | 43 | 46 | 45 | 3.97 | 45 | 3.93 | 0 | -0.04 |
| Nevada | 7 | 6 | 6 | 7 | 7 | 6.02 | 7 | 6.04 | 0 | 0.03 |
| New Hampshire | 44 | 47 | 47 | 42 | 40 | 4.29 | 39 | 4.31 | -1 | 0.02 |
| New Jersey | 40 | 40 | 40 | 41 | 43 | 4.21 | 42 | 4.16 | -1 | -0.05 |
| New Mexico | 2 | 2 | 2 | 1 | 2 | 6.58 | 2 | 6.45 | 0 | -0.13 |
| New York | 47 | 48 | 48 | 47 | 48 | 3.25 | 47 | 3.30 | -1 | 0.04 |
| North Carolina | 21 | 18 | 18 | 17 | 16 | 5.36 | 20 | 5.23 | 4 | -0.14 |
| North Dakota | 5 | 9 | 8 | 6 | 6 | 6.20 | 4 | 6.34 | -2 | 0.13 |
| Ohio | 4 | 3 | 4 | 3 | 5 | 6.23 | 6 | 6.26 | 1 | 0.04 |
| Oklahoma | 24 | 26 | 28 | 29 | 12 | 5.55 | 15 | 5.41 | 3 | -0.14 |
| Oregon | 29 | 25 | 25 | 28 | 29 | 5.06 | 31 | 4.92 | 2 | -0.14 |
| Pennsylvania | 8 | 7 | 7 | 8 | 8 | 5.92 | 9 | 5.97 | 1 | 0.05 |
| Rhode Island | 48 | 46 | 44 | 44 | 38 | 4.44 | 37 | 4.40 | -1 | -0.05 |
| South Carolina | 39 | 38 | 38 | 38 | 39 | 4.31 | 41 | 4.19 | 2 | -0.13 |
| South Dakota | 11 | 30 | 21 | 14 | 14 | 5.44 | 10 | 5.93 | -4 | 0.48 |
| Tennessee | 34 | 35 | 33 | 33 | 33 | 4.81 | 33 | 4.83 | 0 | 0.02 |
| Texas | 37 | 37 | 39 | 43 | 42 | 4.25 | 40 | 4.29 | -2 | 0.05 |
| Utah | 10 | 10 | 9 | 10 | 9 | 5.79 | 12 | 5.68 | 3 | -0.11 |
| Vermont | 49 | 49 | 49 | 49 | 49 | 3.08 | 49 | 2.92 | 0 | -0.16 |
| Virginia | 18 | 20 | 19 | 23 | 24 | 5.18 | 22 | 5.19 | -2 | 0.01 |
| Washington | 22 | 19 | 24 | 21 | 26 | 5.13 | 25 | 5.16 | -1 | 0.03 |
| West Virginia | 13 | 11 | 11 | 11 | 23 | 5.18 | 17 | 5.31 | -6 | 0.12 |
| Wisconsin | 19 | 16 | 15 | 13 | 13 | 5.49 | 8 | 6.00 | -5 | 0.51 |
| Wyoming | 46 | 41 | 37 | 37 | 35 | 4.53 | 44 | 4.09 | 9 | -0.44 |
| District of Columbia | 46 | 48 | 49 | 50 | 50 | 2.81 | 48 | 3.20 | -2 | 0.39 |
Source: Tax Foundation.
Property Tax Rate
The property tax rate subindex consists of property tax collections as a percent of personal income (80 percent of the subindex score) and capital stock taxes (20 percent of the subindex score). The heavy weighting of tax collections is due to their importance to businesses and individuals and their increasing size and visibility to all taxpayers. Tax collections as a percentage of personal income forms an effective rate that gives taxpayers a sense of how much of their income is devoted to property taxes.
While these measures are not ideal—having effective tax rates of personal and real property for both businesses and individuals would be preferable—they are the best measures available due to the significant data constraints regarding property tax collections. Since a high percentage of property taxes are levied at the local level, there are countless jurisdictions. The sheer number of different localities makes data collection virtually impossible. The few studies that tackle the subject use representative towns or cities instead of the entire state. Thus, the best source for data on property taxes is the Census Bureau, because it can compile the data and reconcile definitional problems.
States that maintain low effective rates are more likely to promote growth than states with high rates and collections.
Effective Property Tax Rate. Property tax collections as a percent of personal income are derived by dividing the Census Bureau’s figure for total property tax collections by personal income in each state. This provides an effective property tax rate. States with the highest effective rates and therefore the worst scores are Vermont (5.13 percent), Maine (5.09 percent), New Jersey (4.81 percent), New Hampshire (4.64 percent), New York (4.44 percent), and Connecticut (4.07 percent). States that score well with low effective tax rates are Alabama (1.40 percent), Arkansas (1.67 percent), Tennessee (1.74 percent), Oklahoma (1.77 percent), and Louisiana (1.86 percent).
Capital Stock Tax Rate. Capital stock taxes (sometimes called franchise taxes) are levied on the wealth of a corporation, usually defined as net worth. They are often levied in addition to corporate income taxes, adding a duplicate layer of taxation and compliance for many corporations. Corporations that find themselves in financial trouble must use their limited cash flow to pay their capital stock tax. In assessing capital stock taxes, the subindex accounts for three variables: the capital stock tax rate; the maximum payment; and whether any capital stock tax is imposed in addition to a corporate income tax, or whether the business is liable for the higher of the two.
This variable measures the rate of taxation as levied by the 15 states with a capital stock tax. Legislators have come to realize the damaging effects of capital stock taxes, and a handful of states are reducing or repealing them. Kansas completed the phaseout of its tax in 2011. West Virginia and Rhode Island fully phased out their capital stock taxes as of January 1, 2015, and Pennsylvania phased out its capital stock tax in 2016. Oklahoma eliminated its capital stock tax in 2023.
New York finished a phaseout of the state’s capital stock tax as of January 1, 2021, but the legislature decided to temporarily reinstate the tax due to coronavirus-related budget concerns. Similarly, Illinois had plans to begin a phaseout in 2020, completing the process in 2024. After two years, Illinois reversed its phaseout plan and opted instead to freeze the franchise tax exemptionA tax exemption excludes certain income, revenue, or even taxpayers from tax altogether. For example, nonprofits that fulfill certain requirements are granted tax-exempt status by the Internal Revenue Service (IRS), preventing them from having to pay income tax. at $1,000. Connecticut plans to phase out its tax by January 1, 2028. States with the highest capital stock tax rates include Arkansas (0.30 percent), Louisiana (0.275 percent), Massachusetts and Connecticut (0.26 percent), Tennessee (0.25 percent), and New York (0.1875 percent).
Maximum Capital Stock Tax Payment. Seven states mitigate the negative economic impact of the capital stock tax by placing a cap on the maximum capital stock tax payment. These states are Alabama, Connecticut, Delaware, Georgia, Illinois, Nebraska, and New York, and among states with a capital stock tax, they receive the highest score on this variable.
Capital Stock Tax Versus Corporate Income Tax. Some states mitigate the negative economic impact of the capital stock tax by allowing corporations to pay the higher of their capital stock tax or their corporate tax. These states (Connecticut, Massachusetts, and New York) are given credit for this provision. States that do not have a capital stock tax get the best scores in this subindex while the states that force companies to pay both score the worst.
Property Tax Base
This subindex is composed of dummy variables listing the different types of property taxes each state levies. Seven taxes are included and each is equally weighted. Delaware, Ohio, Wisconsin, North Dakota, Idaho, and Pennsylvania score the best because they each only levy one of the seven taxes. Connecticut, Maryland, Kentucky, and Oklahoma receive the worst scores because they impose many of these taxes.
Business Tangible Property Tax. This variable rewards states that remove, or substantially remove, business tangible personal property from their tax bases. Taxes on tangible personal property (TPP), meaning property that can be touched or moved (as opposed to real estate), are a source of tax complexity and nonneutrality, incentivizing firms to change their investment decisions and relocate to avoid the tax. Nine states (Delaware, Hawaii, Illinois, Iowa, New Jersey, New York, Ohio, Pennsylvania, and Wisconsin) exempt all tangible personal property from taxation, while another five states (Minnesota, New Hampshire, North Dakota, Rhode Island, and South Dakota) exempt most such property from taxation except for select industries that are centrally assessed.
Tangible Personal Property De Minimis Exemption. Another 10 states that tax business tangible personal property offer de minimis exemptions to avoid unduly burdening businesses with only a small amount of potentially taxable property.[46] Arizona, Colorado, Idaho, Indiana, Michigan, Montana, and Rhode Island have TPP de minimis exemptions of $50,000 or more, while Florida, Georgia, Kentucky, and Utah have lower exemptions. States that offer TPP de minimis exemptions receive extra credit on this subindex compared to the states that fully tax business tangible personal property.
Inventory Tax. Levied on the value of a company’s inventory, the inventory tax is especially harmful to large retail stores and other businesses that store large amounts of merchandise. Inventory taxes are highly distortionary, because they force companies to make decisions about production that are not entirely based on economic principles but rather on how to pay the least amount of tax on goods produced. Inventory taxes also create strong incentives for companies to locate inventory in states where they can avoid these harmful taxes. Fourteen states levy some form of inventory tax.
Intangible Property Tax. This dummy variable gives low scores to those states that impose taxes on intangible personal property. Intangible personal property includes stocks, bonds, and other intangibles such as trademarks. This tax can be highly detrimental to businesses that hold large amounts of their own or other companies’ stock and that have valuable trademarks. Eight states levy this tax in various degrees: Alabama, Iowa, Kentucky, Louisiana, Mississippi, South Dakota, Tennessee, and Texas.[47]
Split Roll Taxation. In some states, different classes of property—like residential, commercial, industrial, and agricultural property—face distinct tax burdens, either because they are taxed at different rates or are exposed to different assessment ratios. When such distinctions exist, the state is said to have a split (rather than unified) property tax roll. The Index assesses whether states utilize split roll taxation, which tends to discriminate against business property, and what ratio exists between commercial and residential property taxation.
Property Tax Limitation Regimes. Most states limit the degree to which localities can raise property taxes, but these property tax limitation regimes vary dramatically. Broadly speaking, there are three types of property tax limitations. Assessment limits restrict the rate at which a given property’s assessed value can increase each year. (It often, but not always, resets upon sale or change of use, and sometimes resets when substantial improvements are made.) Rate limits, as the name implies, either cap the allowable rate or restrict the amount by which the rate can be raised in a given year. Finally, levy limits impose a restriction on the growth of total collections (excluding those from new construction), implementing or necessitating rate reductions if revenues exceed the allowable growth rate. Most limitation regimes permit voter overrides. The Index penalizes states for imposing assessment limitations, which distort property taxation, leading to similar properties facing highly disparate effective rates of taxation and influencing decisions about property utilization. It also rewards states for adopting levy limits. The new edition of the Index neither rewards nor penalizes rate limitations, which often have very little effect.
Asset Transfer Taxes (Estate, Inheritance, and Gift Taxes). Four taxes levied on the transfer of assets are part of the property tax base. These taxes, levied in addition to the federal estate taxAn estate tax is imposed on the net value of an individual’s taxable estate, after any exclusions or credits, at the time of death. The tax is paid by the estate itself before assets are distributed to heirs. , all increase the cost and complexity of transferring wealth and hurt a state’s business tax climate. These harmful effects can be particularly acute in the case of small, family-owned businesses if they do not have the liquid assets necessary to pay the estate’s tax liability.[48] The four taxes are real estate transfer taxes, estate taxes, inheritance taxes, and gift taxes. Thirty-five states and the District of Columbia levy taxes on the transfer of real estate, adding to the cost of purchasing real property and increasing the complexity of real estate transactions. This tax is harmful to businesses that transfer real property often.
The federal Economic Growth and Tax Relief Reconciliation Act of 2001 (EGTRRA) lowered the federal estate tax rate through 2009 and eliminated it entirely in 2010. Prior to 2001, most states levied an estate tax that piggybacked on the federal system, because the federal tax code allowed individuals to take a dollar-for-dollar tax credit for state estate taxes paid. In other words, states essentially received free tax collections from the estate tax, and individuals did not object because their total tax liability was unchanged. EGTRRA eliminated this dollar-for-dollar credit system, replacing it with a tax deductionA tax deduction allows taxpayers to subtract certain deductible expenses and other items to reduce how much of their income is taxed, which reduces how much tax they owe. For individuals, some deductions are available to all taxpayers, while others are reserved only for taxpayers who itemize. For businesses, most business expenses are fully and immediately deductible in the year they occur, but others, particularly for capital investment and research and development (R&D), must be deducted over time. .
Consequently, over the past decade, some states enacted their own estate tax while others repealed their estate taxes. Some states have provisions reintroducing the estate tax if the federal dollar-for-dollar credit system is revived. This would have happened in 2011, as EGTRRA expired and the federal estate tax returned to pre-2001 levels. However, in late 2010, Congress reenacted the estate tax for 2011 and 2012, but with higher exemptions and a lower rate than pre-2001 law, and maintained the deduction for state estate taxes. The tax reform law of 2017 raised the federal exemption still further. Thirty-eight states receive a high score for either (1) remaining coupled to the federal credit and allowing their state estate tax to expire or (2) not enacting their own estate tax, including two that repealed their estate tax this year. Twelve states and the District of Columbia have maintained an estate tax either by linking their tax to the pre-EGTRRA credit or by creating their own stand-alone system. These states are ranked according to the maximum estate tax rate they impose. The highest estate tax rates are in Hawaii and Washington (each at 20 percent), while the lowest rates are in Connecticut and Maine (each at 12 percent).
Each year, some businesses, especially those that have not spent a sufficient sum on estate tax planning and on large insurance policies, find themselves unable to pay their estate taxes, either federal or state. Usually, they are small to medium-sized family-owned businesses where the death of the owner occasions a surprisingly large tax liability.
Inheritance taxes are similar to estate taxes, but they are levied on the heir of an estate instead of on the estate itself. Therefore, a person could inherit a family-owned company from his or her parents and be forced to downsize it, or sell part or all of it, in order to pay the heir’s inheritance tax. Six states have inheritance taxes and are punished in the Index, because the inheritance tax causes economic distortions. The highest maximum inheritance tax rates are in Kentucky and New Jersey (each at 16 percent), while the lowest rate is in Iowa (2 percent), where the tax is scheduled to be fully repealed next year. Maryland has both an estate tax and an inheritance tax, the only state to impose both after New Jersey completed the repeal of its estate tax.
Connecticut is the only state with a gift taxA gift tax is a tax on the transfer of property by a living individual, without payment or a valuable exchange in return. The donor, not the recipient of the gift, is typically liable for the tax. , and it scores poorly. Gift taxes are designed to stop individuals’ attempts to avoid the estate tax by giving their estates away before they die. Gift taxes have a negative impact on a state’s business tax climate because they also heavily impact individuals who have sole proprietorships, S corporations, and LLCs.
Unemployment Insurance Tax
Unemployment insurance (UI) is a social insurance program jointly operated by the federal and state governments. Taxes are paid by employers into the UI program to finance benefits for workers recently unemployed. Compared to the other major taxes assessed in the State Tax Competitiveness Index, UI taxes are much less well-known. Every state has one, and all 50 of them are complex, variable-rate systems that impose different rates on different industries and different bases depending upon such factors as the health of the state’s UI trust fund.[49]
One of the worst aspects of the UI tax system is that financially troubled businesses, for which layoffs may be a matter of survival, actually pay higher marginal rates as they are forced into higher tax rate schedules. This can be considered the shutdown effect of UI taxes: failing businesses face climbing UI taxes, with the result that they fail sooner.
The unemployment insurance tax component of the Index consists of two equally weighted subindices, one that measures each state’s rate structure and one that focuses on the tax base. Unemployment insurance taxes comprise 10.5 percent of a state’s final Index score.
Overall, the states with the least damaging UI taxes are Delaware, Arizona, Nebraska, Kansas, Missouri, Oklahoma, and North Carolina. Comparatively speaking, these states have rate structures with lower minimum and maximum rates and a wage base approximately at the federal level. In addition, they have simpler experience formulas and charging methods, and they have not complicated their systems with benefit add-ons and surtaxes. Also, their UI trust fund’s solvency is at or above the recommended level.
Conversely, the states with the worst UI taxes are New Jersey, Hawaii, Rhode Island, Massachusetts, Nevada, and Alaska. These states tend to have rate structures with high minimum and maximum rates and wage bases above the federal level. They also tend to feature more complicated experience formulas and charging methods, have added surtaxes to their systems, and charge employers in more situations. Their UI trust funds’ solvency is typically below the recommended level.
Table 7. Unemployment Insurance Tax Component of the State Tax Competitiveness Index (2020–2025)
| State | 2020 | 2021 | 2022 | 2023 | 2024 Rank | 2024 Score | 2025 Rank | 2025 Score | 2024-2025 Rank | 2024-2025 Score |
|---|---|---|---|---|---|---|---|---|---|---|
| Alabama | 25 | 18 | 26 | 25 | 16 | 5.37 | 18 | 5.38 | 2 | 0.01 |
| Alaska | 50 | 50 | 50 | 50 | 44 | 4.17 | 45 | 4 | 1 | -0.17 |
| Arizona | 3 | 3 | 3 | 2 | 3 | 5.96 | 2 | 6.04 | -1 | 0.08 |
| Arkansas | 16 | 14 | 8 | 10 | 20 | 5.28 | 11 | 5.61 | -9 | 0.33 |
| California | 28 | 29 | 24 | 21 | 23 | 5.11 | 25 | 5.08 | 2 | -0.02 |
| Colorado | 24 | 23 | 28 | 32 | 32 | 4.72 | 39 | 4.51 | 7 | -0.21 |
| Connecticut | 38 | 39 | 33 | 35 | 30 | 4.82 | 40 | 4.49 | 10 | -0.33 |
| Delaware | 7 | 11 | 11 | 4 | 1 | 6.11 | 1 | 6.12 | 0 | 0.01 |
| Florida | 5 | 5 | 10 | 8 | 9 | 5.62 | 10 | 5.63 | 1 | 0.01 |
| Georgia | 20 | 20 | 22 | 27 | 27 | 4.99 | 24 | 5.16 | -3 | 0.17 |
| Hawaii | 30 | 32 | 41 | 40 | 50 | 3.41 | 49 | 3.89 | -1 | 0.47 |
| Idaho | 36 | 38 | 27 | 34 | 37 | 4.64 | 35 | 4.61 | -2 | -0.03 |
| Illinois | 42 | 43 | 39 | 42 | 43 | 4.29 | 43 | 4.2 | 0 | -0.09 |
| Indiana | 18 | 19 | 23 | 18 | 15 | 5.42 | 13 | 5.58 | -2 | 0.16 |
| Iowa | 39 | 41 | 35 | 37 | 36 | 4.67 | 33 | 4.67 | -3 | 0 |
| Kansas | 11 | 10 | 15 | 11 | 5 | 5.79 | 4 | 5.82 | -1 | 0.02 |
| Kentucky | 40 | 37 | 38 | 38 | 38 | 4.63 | 34 | 4.63 | -4 | 0 |
| Louisiana | 4 | 4 | 12 | 14 | 11 | 5.57 | 9 | 5.64 | -2 | 0.06 |
| Maine | 27 | 28 | 16 | 22 | 13 | 5.45 | 19 | 5.29 | 6 | -0.16 |
| Maryland | 26 | 24 | 36 | 28 | 24 | 5.07 | 20 | 5.27 | -4 | 0.2 |
| Massachusetts | 49 | 49 | 49 | 47 | 49 | 3.71 | 47 | 3.97 | -2 | 0.26 |
| Michigan | 22 | 27 | 25 | 26 | 28 | 4.95 | 26 | 5.08 | -2 | 0.12 |
| Minnesota | 43 | 42 | 45 | 45 | 42 | 4.34 | 42 | 4.31 | 0 | -0.03 |
| Mississippi | 6 | 6 | 5 | 7 | 12 | 5.54 | 15 | 5.54 | 3 | 0.01 |
| Missouri | 10 | 7 | 2 | 3 | 4 | 5.91 | 5 | 5.81 | 1 | -0.1 |
| Montana | 23 | 26 | 18 | 20 | 19 | 5.29 | 21 | 5.26 | 2 | -0.03 |
| Nebraska | 2 | 2 | 1 | 1 | 2 | 6 | 3 | 6.01 | 1 | 0.01 |
| Nevada | 48 | 47 | 48 | 48 | 47 | 4.11 | 46 | 4 | -1 | -0.11 |
| New Hampshire | 21 | 25 | 32 | 31 | 29 | 4.94 | 27 | 5.08 | -2 | 0.14 |
| New Jersey | 44 | 45 | 42 | 44 | 48 | 4.05 | 50 | 3.66 | 2 | -0.39 |
| New Mexico | 12 | 12 | 17 | 12 | 14 | 5.43 | 16 | 5.4 | 2 | -0.03 |
| New York | 34 | 36 | 37 | 41 | 39 | 4.62 | 37 | 4.55 | -2 | -0.07 |
| North Carolina | 9 | 9 | 7 | 9 | 8 | 5.64 | 7 | 5.69 | -1 | 0.05 |
| North Dakota | 15 | 15 | 4 | 6 | 18 | 5.34 | 12 | 5.58 | -6 | 0.24 |
| Ohio | 8 | 8 | 13 | 13 | 10 | 5.58 | 14 | 5.57 | 4 | -0.02 |
| Oklahoma | 1 | 1 | 9 | 5 | 6 | 5.72 | 6 | 5.7 | 0 | -0.02 |
| Oregon | 45 | 40 | 43 | 43 | 34 | 4.7 | 41 | 4.48 | 7 | -0.23 |
| Pennsylvania | 46 | 46 | 34 | 36 | 40 | 4.61 | 36 | 4.59 | -4 | -0.02 |
| Rhode Island | 47 | 48 | 47 | 46 | 45 | 4.16 | 48 | 3.91 | 3 | -0.25 |
| South Carolina | 29 | 22 | 21 | 24 | 26 | 5.01 | 28 | 5.03 | 2 | 0.01 |
| South Dakota | 19 | 21 | 19 | 19 | 21 | 5.22 | 22 | 5.26 | 1 | 0.03 |
| Tennessee | 17 | 16 | 14 | 17 | 22 | 5.22 | 17 | 5.39 | -5 | 0.17 |
| Texas | 32 | 33 | 31 | 30 | 31 | 4.76 | 30 | 4.76 | -1 | 0 |
| Utah | 14 | 17 | 20 | 23 | 25 | 5.02 | 29 | 4.97 | 4 | -0.04 |
| Vermont | 13 | 13 | 6 | 15 | 7 | 5.67 | 8 | 5.66 | 1 | -0.01 |
| Virginia | 35 | 35 | 40 | 39 | 41 | 4.5 | 38 | 4.51 | -3 | 0.01 |
| Washington | 41 | 44 | 46 | 49 | 46 | 4.12 | 44 | 4 | -2 | -0.12 |
| West Virginia | 31 | 30 | 29 | 16 | 17 | 5.37 | 23 | 5.17 | 6 | -0.2 |
| Wisconsin | 33 | 31 | 30 | 29 | 33 | 4.71 | 32 | 4.73 | -1 | 0.02 |
| Wyoming | 37 | 34 | 44 | 33 | 35 | 4.67 | 31 | 4.74 | -4 | 0.07 |
| District of Columbia | 22 | 22 | 27 | 28 | 23 | 5.18 | 25 | 5.11 | 2 | -0.06 |
Source: Tax Foundation.
Unemployment Insurance Tax Rate
UI tax rates in each state are based on a schedule of rates ranging from a minimum rate to a maximum rate. The rate for any particular business is dependent upon the business’s experience rating: businesses with the best experience ratings will pay the lowest possible rate on the schedule while those with the worst ratings pay the highest. The rate is applied to a taxable wage base (a predetermined fraction of an employee’s wage) to determine UI tax liability.
Multiple rates and rate schedules can affect neutrality as states attempt to balance the dual UI objectives of spreading the cost of unemployment to all employers and ensuring high-turnover employers pay more.
Overall, the states with the best score on this rate subindex are Nebraska, Maine, Mississippi, Alabama, Florida, and Virginia. Generally, these states have low minimum and maximum tax rates on each schedule and a wage base at or near the federal level. The states with the worst scores are Hawaii, New Jersey, Rhode Island, Massachusetts, Washington, and Minnesota.
The subindex includes three factors: the actual rate schedules in effect in the most recent year, the statutory rate schedules that can potentially be implemented at any time depending on the state of the economy and the UI fund, and the UI trust fund solvency level.
Actual Rate. Both minimum and maximum actual UI tax rates, in their interaction with the taxable wage base, are included here. The minimum rates in effect in the most recent year range from zero percent (Iowa, Missouri, Nebraska, South Dakota, Wisconsin, and Wyoming) to 2.10 percent (New York). The maximum rates in effect in the most recent year range from 5.4 percent (Alabama, Alaska, Delaware, Florida, Idaho, Nebraska, Nevada, Oregon, and Vermont) to 14.03 percent (Arizona). The taxable wage base ranges from $7,000 (in Florida, California, Tennessee, and Arkansas), in line with the federal taxable wage base, to $68,500 (Washington). In addition to these statutory variables, we use two variables published by the US Department of Labor that calculate effective UI tax rates: employer contribution rates as (1) a percentage of taxable wages and (2) as a percentage of total wages. The first variable ranges from 0.49 percent (Alabama) to 3.5 percent (Pennsylvania), while the second variable ranges from 0.1 percent (Alabama, Virginia, and Florida) to 1.86 percent (Hawaii).
Potential Rate. Due to the effect of business and seasonal cycles on UI funds, states will sometimes change UI tax rate schedules. When UI trust funds are flush, states will trend toward their lower rate schedules (“most favorable schedules”); however, when UI trust funds are low, states will trend toward their higher rate schedules (“least favorable schedules”). Only maximum rates of these schedules are compared in the Index, as the variation in minimum rates is very low. The lowest maximum rate of 5.4 percent is imposed by 22 states and the District of Columbia. The state with the highest maximum tax rate and, thus, the worst maximum tax score, is Wisconsin (10.7 percent). Twelve states receive the best score in this variable with a comparatively low maximum tax rate of 5.4 percent. The state with the highest maximum tax rate and, thus, the worst maximum tax score, is Massachusetts (18.55 percent).
UI Trust Fund Solvency. Every year, the US Department of Labor publishes the “State UI Trust Fund Solvency Report,” ranking all the states based on their UI trust fund solvency level measured using the Average High Cost Multiple.[50] The recommended solvency level is 1 or above. California and New York have the lowest solvency level at 0, which means that their UI trust funds are essentially insolvent. The states with the highest solvency level (all above 2) are Wyoming, Alaska, and Oregon.
Unemployment Insurance Tax Base
The UI base subindex scores states on how they determine which businesses should pay the UI tax and how much, as well as other UI-related taxes for which businesses may also be liable.
The states that receive the best scores on this subindex are Oklahoma, Delaware, North Dakota, Arizona, Ohio, and Vermont. In general, these states have relatively simple experience formulas, exclude more factors from the charging method, and enforce fewer surtaxes.
States that receive the worst scores are Virginia, Alaska, Nevada, Illinois, South Carolina, and Wyoming. In general, they have more complicated experience formulas, exclude fewer factors from the charging method, and have complicated their systems with add-ons and surtaxes. The three equally-weighted factors considered in this subindex are experience rating formulas, charging methods, and a host of smaller factors aggregated into one variable.
Experience Rating Formula. A business’s experience rating formula determines the rate the firm must pay—whether it will lean toward the minimum rate or maximum rate of the particular rate schedule in effect in the state at that time.
There are four basic experience formulas: contribution, benefit, payroll, and state experience. The first three experience formulas—contribution, benefit, and payroll—are based solely on the business’s experience and are therefore nonneutral by design.[51] However, the final variable—state experience—is a positive mitigating factor because it is based on statewide experience. In other words, the state experience is not tied to the experience of any one business; therefore, it is a more neutral factor. This subindex penalizes states that depend on the contribution (5 points), benefit (2.5 points), and payroll experience (0 points) variables while rewarding states with the state experience variable (10 points).
Charging Methods and Benefits Excluded from Charging. A business’s experience rating will vary depending on which charging method the state government uses. When a former employee applies for unemployment benefits, the benefits paid to the employee must be charged to a previous employer. There are three basic charging methods:
- Charging Most Recent or Principal Employer: Ten states charge all the benefits to one employer, usually the most recent.
- Charging Base-Period Employers in Inverse Chronological Order: Six states charge all base-period employers in inverse chronological order. This means that all employers within a base period of time (usually the last year, sometimes longer) will have the benefits charged against them, with the most recent employer being charged the most.
- Charging in Proportion to Base-Period Wages: Thirty-four states and the District of Columbia charge in proportion to base-period wages. This means that all employers within a base period of time (usually the last year, sometimes longer) will have the benefits charged against them in proportion to the wages they paid.
None of these charging methods could be called neutral, but at the margin, charging the most recent or principal employer is the least neutral because the business faced with the necessity of laying off employees knows it will bear the full benefit charge. The most neutral of the three is the “charging in proportion to base-period wages” since there is a higher probability of sharing the benefit charges with previous employers.
As a result, the states that charge in proportion to base-period wages receive the best score. The states that charge the most recent or principal employer receive the worst score. The states that charge base-period employers in inverse chronological order receive a median score.
Many states also recognize that certain benefit costs should not be charged to employers, especially if the separation is beyond the employer’s control. Therefore, this subindex also accounts for six types of exclusions from benefit charges:
- Benefit award reversed
- Reimbursements on combined wage claims
- Voluntary leaving
- Discharge for misconduct
- Refusal of suitable work
- Continues to work for employer on part-time basis
States are rewarded for each of these exclusions because they nudge a UI system toward neutrality. For instance, if benefit charges were levied for employees who voluntarily quit, then industries with high turnover rates, such as retail, would be hit disproportionately harder. States that receive the best scores in this category are Connecticut, Delaware, Louisiana, Ohio, and Vermont. On the other hand, the states that receive the worst scores are Virginia, Nevada, Massachusetts, Maine, and Georgia. Most states charge the most recent or principal employer and forbid most benefit exclusions.
Solvency Tax. These taxes are levied on employers when a state’s unemployment fund falls below some defined level. Twenty-nine states have a solvency tax on the books, though they fall under different names, such as solvency adjustment tax (Alaska), supplemental assessment tax (Delaware), subsidiary tax (New York), and fund balance factor (Virginia).
Taxes for Socialized Costs or Negative Balance Employer. These are levied on employers when the state desires to recover benefit costs above and beyond the UI tax collections based on the normal experience rating process. Nine states have these taxes on the books, though they fall under a variety of names.
Loan and Interest Repayment Surtaxes. Levied on employers when a loan is taken from the federal government or when bonds are sold to pay for benefit costs, these taxes are of two general types. The first is a tax to pay off the federal loan or bond issue. The second is a tax to pay the interest on the federal loan or bond issue. States are not allowed to pay interest costs directly from the state’s unemployment trust fund. Twenty-eight states and the District of Columbia have these taxes on the books, though they fall under several names, such as advance interest tax and bond assessment tax (Colorado) and temporary emergency assessment tax (Delaware).
Reserve Taxes. Reserve taxes are levied on employers, to be deposited in a reserve fund separate from the unemployment trust fund. Since the fund is separate, the interest earned on it is often used to create other funds for purposes such as job training and paying the costs of the reserve tax’s collection. Four states have these taxes on the books: Idaho and Iowa (reserve tax), Nebraska (state UI tax), and North Carolina (reserve fund tax).
Surtaxes for UI Administration or Non-UI Purposes. Twenty-eight states and the District of Columbia levy surtaxes on employers, usually to fund administration but sometimes for job training or special improvements in technology. They are often deposited in a fund outside of the state’s unemployment fund. Some of the names they go by are the state training and employment program (Arkansas), reemployment service fund tax (New York), wage security tax (Oregon), and investment in South Dakota future fee (South Dakota).
Temporary Disability Insurance (TDI). A handful of states—California, Hawaii, New Jersey, and New York—have established a temporary disability insurance (TDI) program that augments the UI program by extending benefits to those unable to work because of sickness or injury. No separate tax funds these programs; the money comes right out of the states’ unemployment funds. Because the balance of the funds triggers various taxes, the TDIs are included as a negative factor in the calculation of this subindex.
Voluntary Contributions. Twenty-seven states allow businesses to make voluntary contributions to the unemployment trust fund. In most cases, these contributions are rewarded with a lower rate schedule, often saving the business more money in taxes than was paid through the contribution. The Index rewards states that allow voluntary contributions because firms are able to pay when they can best afford to instead of when they are struggling. This provision helps to mitigate the nonneutralities of the UI tax.
Time Period to Qualify for Experience Rating. Newly formed businesses, naturally, do not qualify for an experience rating because they have no significant employment history on which to base the rating. Federal rules stipulate that states can levy a “new employer” rate for one to three years, but no less than one year. From a neutrality perspective, however, this new employer rate is nonneutral in almost all cases since the rate is higher than the lowest rate schedule. The longer this rate is in effect, the worse the nonneutrality. As such, the Index rewards states with the minimum one year required to earn an experience rating and penalizes states that require the full three years.
References
[1] See U.S. Department of Labor, “Extended Mass Layoffs, First Quarter 2013,” Table 10, May 13, 2013.
[2] Daniel Bunn, “Corporate Income Tax Rates Around the World, 2018,” Tax Foundation, Nov. 27, 2018, https://taxfoundation.org/publications/corporate-tax-rates-around-the-world/.
[3] Editorial, “Scale it back, Governor,” Chicago Tribune, March 23, 2007.
[4] Ryan Randazzo, Edythe Jenson, and Mary Jo Pitzl, “Cathy Carter Blog: Chandler getting new $5 billion Intel facility,” AZCentral.com, Mar. 6, 2013.
[5] Dana Hedgpeth and Rosalind Helderman, “Northrop Grumman decides to move headquarters to Northern Virginia,” The Washington Post, April 27, 2010.
[6] Susan Haigh, “Connecticut House Speaker: Tax ‘mistakes’ made in budget,” Associated Press, Nov. 5, 2015.
[7] Austin Mondine, “Dell cuts North-Carolina plant despite $280m sweetener,” TheRegister.co.uk, Oct. 8, 2009.
[8] Dennis Cauchon, “Business Incentives Lose Luster for States,” USA TODAY, Aug. 22, 2007.
[9] State Policy Reports, Vol. 12, No. 11, Issue 1, p. 9, June 1994.
[10] Both rate increases had a temporary component and were allowed to partially expire before legislators overrode a gubernatorial veto to increase rates above where they would have been should they have been allowed to sunset.
[11] Benjamin Yount, “Tax increase, impact, dominate Illinois Capitol in 2011,” Illinois Statehouse News, Dec. 27, 2011.
[12] A trend in tax literature throughout the 1990s was the increasing use of indices to measure a state’s general business climate. These include the Center for Policy and Legal Studies’ Economic Freedom in America’s 50 States: A 1999 Analysis and the Beacon Hill Institute’s State Competitiveness Report 2001. Such indexes even exist on the international level, including the Heritage Foundation and The Wall Street Journal’s 2004 Index of Economic Freedom. Plaut and Pluta (1983) examined the use of business climate indices as explanatory variables for business location movements. They found that such general indices do have a significant explanatory power, helping to explain, for example, why businesses have moved from the Northeast and Midwest toward the South and Southwest. In turn, they also found that high taxes have a negative effect on employment growth.
[13] Robert J. Newman, “Industry Migration and Growth in the South,” The Review of Economics and Statistics 65:1 (February 1983): 76-86.
[14] Claudio Agostini and Soraphol Tulayasathien, “Tax Effects on Investment Location: Evidence for Foreign Direct Investment in the United States,” Office of Tax Policy Research, University of Michigan Business School, 2001.
[15] Robert J. Newman, “Industry Migration and Growth in the South,” The Review of Economics and Statistics 65:1 (February 1983): 76-86.
[16] Jeffrey L. Kwall, “The Repeal of Graduated Corporate Tax Rates,” Tax Notes, Jun. 27, 2011.
[17] Terrence R. Chorvat and Michael S. Knoll, “The Economic and Policy Implications of Repealing the Corporate Alternative Tax,” Tax Foundation, Feb. 1, 2002.
[18] For example, see Alan Peters and Peter Fisher, “The Failures of Economic Development Incentives,” Journal of the American Planning Association 70:1 (2004): 27; William F. Fox and Matthew N. Murray, “Do Economic Effects Justify the Use of Fiscal Incentives?,” Southern Economic Journal 71:1 (July 2004): 78; and Bruce D. McDonald III, J.W. Decker, and Brad A.M. Johnson, “You Don’t Always Get What You Want: The Effect of Financial Incentives on State Fiscal Health,” Public Administration Review 81:3 (February 2020): 365-374.
[19] William M. Gentry and R. Glenn Hubbard, “’Success Taxes,’ Entrepreneurial Entry, and Innovation,” Innovation Policy and the Economy 5 (2005): 87-108.
[20] Robert Carroll, Douglas Holtz-Eakin, Mark Rider, and Harvey S. Rosen, “Income Taxes and Entrepreneurs’ Use of Labor,” Journal of Labor Economics 18 (April 2000): 324-351.
[21] Michael Wasylenko and Therese McGuire, “Jobs and Taxes: The Effect of Business Climate on States’ Employment Growth Rates,” National Tax Journal 38:4 (1985): 497-511.
[22] See Edward C. Prescott, “Why Do Americans Work So Much More than Europeans?,” Federal Reserve Bank of Minneapolis Quarterly Review, July 2004. See also J. Scott Moody and Scott A. Hodge, “Wealthy Americans and Business Activity,” Tax Foundation, Aug. 1, 2004.
[23] New Hampshire taxes only interest and dividends. To account for this, the Index converts the statutory tax rate into an effective rate as measured against the typical state income tax base that includes wages. Under a typical income tax base with a flat rate and no tax preferences, this is the statutory rate that would be required to raise the same amount of revenue as the current system.
[24] See Andrey Yushkov, “Local Income vs. Sales Taxes: Which Is the Better Source of Local Revenue?,” Tax Foundation, Jun. 13, 2024.
[25] See a review of recent academic literature on the topic in Andrey Yushkov, “Taxes and Migration: New Evidence from Academic Research,” Tax Foundation, Mar. 12, 2024.
[26] Scott A. Hodge, “Married Couples File Less Than Half of All Tax Returns, But Pay 74 Percent of all Income Taxes,” Tax Foundation, Mar. 25, 2003; Scott A. Hodge, “Own a Business? You May be Rich: Two-Thirds of Taxpayers Hit by Highest Tax Rate Have Business Income,” Tax Foundation, May 5, 2003.
[27] Equity-related capital gains are not created directly by a corporation. Rather, they are the result of stock appreciations due to corporate activity such as increasing retained earnings, increasing capital investments, or issuing dividends. Stock appreciation becomes taxable realized capital gains when the stock is sold by the holder.
[28] States have sought to limit this sales tax competition by levying a “use tax” on goods purchased out of state and brought into the state, typically at the same rate as the sales tax. Few consumers comply with use tax obligations.
[29] Timothy J. Bartik, “Small Business Start-Ups in the United States: Estimates of the Effects of Characteristics of States,” Southern Economic Journal (April 1989): 1004-1018.
[30] For example, in early 1993, Intel Corporation was considering California, New Mexico, and four other states as the site of a new billion-dollar factory. California was the only one of the six states that levied its sales tax on machinery and equipment, a tax that would have cost Intel roughly $80 million. As Intel’s Bob Perlman explained in testimony before a committee of the California state legislature, “There are two ways California’s not going to get the $80 million: with the factory or without it.” California would not repeal the tax on machinery and equipment; New Mexico got the plant.
[31] Sales taxes, which are ideally levied only on sales to final users, are a form of consumption taxA consumption tax is typically levied on the purchase of goods or services and is paid directly or indirectly by the consumer in the form of retail sales taxes, excise taxes, tariffs, value-added taxes (VAT), or income taxes where all savings are tax-deductible. . Consumption taxes that are levied instead at each stage of production are known as value-added taxes (VAT) and are popular internationally. Theoretically, a VAT can avoid the economically damaging tax pyramiding effect. The VAT has never gained wide acceptance in the US, and only two states (Michigan and New Hampshire) have even attempted a VAT-like tax.
[32] Alaska does authorize local governments to levy their own sales taxes, however, which is reflected in the state’s sales tax component score.
[33] The average local option sales tax rate is calculated as an average of local statutory rates, weighted by population. See Jared Walczak, “State and Local Sales Tax Rates, Midyear 2024,” Tax Foundation, Jul. 9, 2024.
[34] J. Moody and Scott and Wendy P. Warcholik. “How Tax Competition Affects Cross-Border Sales of Beer in the United States,” Tax Foundation, March 2004.
[35] See Adam Hoffer, “Cigarette Taxes and Cigarette Smuggling by State, 2021,” Tax Foundation, Dec. 5, 2023.
[36] See Ulrik Boesen, “Tax Foundation Comments on Maryland’s Digital Advertising Tax Regulations,” Tax Foundation, Nov. 10, 2021.
[37] See Timothy J. Besley and Harvey S. Rosen, “Sales Taxes and Prices: An Empirical Analysis,” NBER Working Paper No. 6667, July 1998.
[38] Ibid.
[39] Jared Walczak, “State Sales Tax Breadth and Reliance, Fiscal Year 2022,” Tax Foundation, Jul. 23, 2024, https://taxfoundation.org/data/all/state/sales-tax-revenue-reliance-breadth/.
[40] See Matt Moon, “How Do Americans Feel about Taxes Today?,” Tax Foundation, Apr. 8, 2009.
[41] Andrew Phillips and Caroline Sallee, “Total State and Local Business Taxes: State-by-State Estimates for Fiscal Year 2022,” Council On State Taxation (COST) with Ernst and Young LLP and the State Tax Research Institute (December 2023).
[42] Stephen T. Mark, Therese J. McGuire, and Leslie E. Papke, “The influence of taxes on employment and population growth: Evidence from the Washington, DC metropolitan area,” National Tax Journal 53:1 (2000): 105-123.
[43] Timothy J. Bartik, “Business Location Decisions in the United States: Estimates of the Effects of Unionization, Taxes, and Other Characteristics of States,” Journal of Business and Economics Statistics 3:1 (January 1985): 14-22.
[44] Timothy J. Bartik, “Small Business Start-Ups in the United States: Estimates of the Effects of Characteristics of States,” Southern Economic Journal (April 1989): 1004-1018.
[45] Tangible personal property taxes can also affect business decisions and are now part of the new Index. For a comprehensive review of these taxes and reform recommendations, see Jared Walczak, “Tangible Personal Property De Minimis Exemptions by State, 2024,” Tax Foundation, Mar. 5, 2025, and Joyce Errecart, Ed Gerrish, and Scott Drenkard, “States Moving Away from Taxes on Tangible Personal Property,” Tax Foundation, Oct. 4, 2012.
[46] See Jared Walczak, “Tangible Personal Property De Minimis Exemptions by State, 2024,” Tax Foundation, Mar. 5, 2024, https://taxfoundation.org/data/all/state/state-tangible-personal-property-taxes-2024/.
[47] Some states, like Kentucky, are often considered not to impose an intangible property tax but continue to levy a low millage on financial deposits.
[48] For a summary of the effects of the estate tax on business, see Congressional Budget Office, “Effects of the Federal Estate Tax on Farms and Small Businesses,” July 2005. For a summary of the estate tax in general, see David Block and Scott Drenkard, “The Estate Tax: Even Worse Than Republicans Say,” Tax Foundation, Sep. 4, 2012.
[49] See Joseph Bishop-Henchman, “Unemployment Insurance Taxes: Options for Program Design and Insolvent Trust Funds,” Tax Foundation, Oct. 17, 2011.
[50] According to the US Department of Labor, “Average High Cost Multiple (AHCM) uses actual trust fund balances as of the end of the calendar year and estimated wages for the same year. This measure compares the state trust fund balance to the average of the three highest years of benefit payments.” The full report is available at https://oui.doleta.gov/unemploy/docs/trustFundSolvReport2024.pdf.
[51] Alaska is the only state to use the payroll experience method. This method does not use benefit payments in the formula but instead the variation in an employer’s payroll from quarter to quarter. This is a violation of tax neutrality since any decision by the employer or employee that would affect payroll may trigger higher UI tax rates.
Share this article