The House Ways and Means CommitteeThe Committee on Ways and Means, more commonly referred to as the House Ways and Means Committee, is the chief tax-writing committee in the US. The House Ways and Means Committee has jurisdiction over all bills relating to taxes and other revenue generation, as well as spending programs like Social Security, Medicare, and unemployment insurance, among others. passed a bill to extend expiring taxA tax is a mandatory payment or charge collected by local, state, and national governments from individuals or businesses to cover the costs of general government services, goods, and activities. cuts from the 2017 Tax Cuts and Jobs Act (TCJA) and make other changes to the tax code. While Congress works on the “One, Big, Beautiful Bill” to cut taxes, however, President Trump has imposed significantly higher taxes by placing tariffs on more than 70 percent of US imports. Even without further escalation, the tariffs already in effect threaten to offset much of the benefits of the promised tax cuts, while falling well short of paying for them.
As of May 2025, President Trump has imposed tariffs on nearly all US trade partners and additional product-specific tariffs, with few exceptions. The tariffs currently in effect include 20 percent on all imports from China and an additional 10 percent on certain imports from China, 25 percent on non-USMCA goods from Mexico and Canada (10 percent on non-USMCA Canadian energy and potash), 10 percent on most imports from nearly all other trading partners, and 25 percent on steel, aluminum, autos, and auto parts.
If the tariffs in effect today are left in place permanently, they would reduce long-run GDP by 0.6 percent before retaliation, while raising about $2.1 trillion in revenue from 2025 through 2034 on a conventional basis. The “One, Big, Beautiful Bill” as passed by the Ways and Means Committee would increase long-run GDP by 0.6 percent, while costing about $4.1 trillion of revenue from 2025 through 2034 on a conventional basis.

While the current version of the House bill would boost economic growth by more than just making the TCJA individual provisions permanent, it falls short of offsetting the long-run economic damage of the tariffs currently in effect. The combination of Trump’s tariffs and the One, Big, Beautiful Bill is a major reduction in federal tax revenues that does next to nothing for economic output, and that’s before considering foreign retaliation to US-imposed tariffs.
Table 1. Summary of Tax Proposals and Tariffs
| TCJA Individual Permanence | "One, Big, Beautiful Bill" | Tariffs in Effect May 2025, Before Retaliation | |
|---|---|---|---|
| Gross Domestic Product (GDP) | 0.4% | 0.6% | -0.6% |
| Gross National Product (GNP) | Less than -0.05% | Less than +0.05% | -0.3% |
| Capital Stock | -0.7% | -0.2% | -0.5% |
| Hours Worked Converted to Full-Time Equivalent (FTE) jobs | 688,020 | 794,000 | -533,830 |
| Conventional Revenue, 2025-2034, Billions | -$3,515.6 | -$4,077.0 | $2,096.0 |
| Dynamic Revenue, 2025-2034, Billions | -$3,025.8 | $3,304.8 | $1,525.4 |
Because the combination of the tax bill and tariffs results in a major reduction in federal tax revenue, it also results in net tax cuts on average. But the effects are not the same across the income spectrum. The tariffs offset a larger portion of the tax cuts for lower- and middle-income taxpayers than for higher-income taxpayers, and by the end of the budget window, many low-income taxpayers would be worse off under the combination.
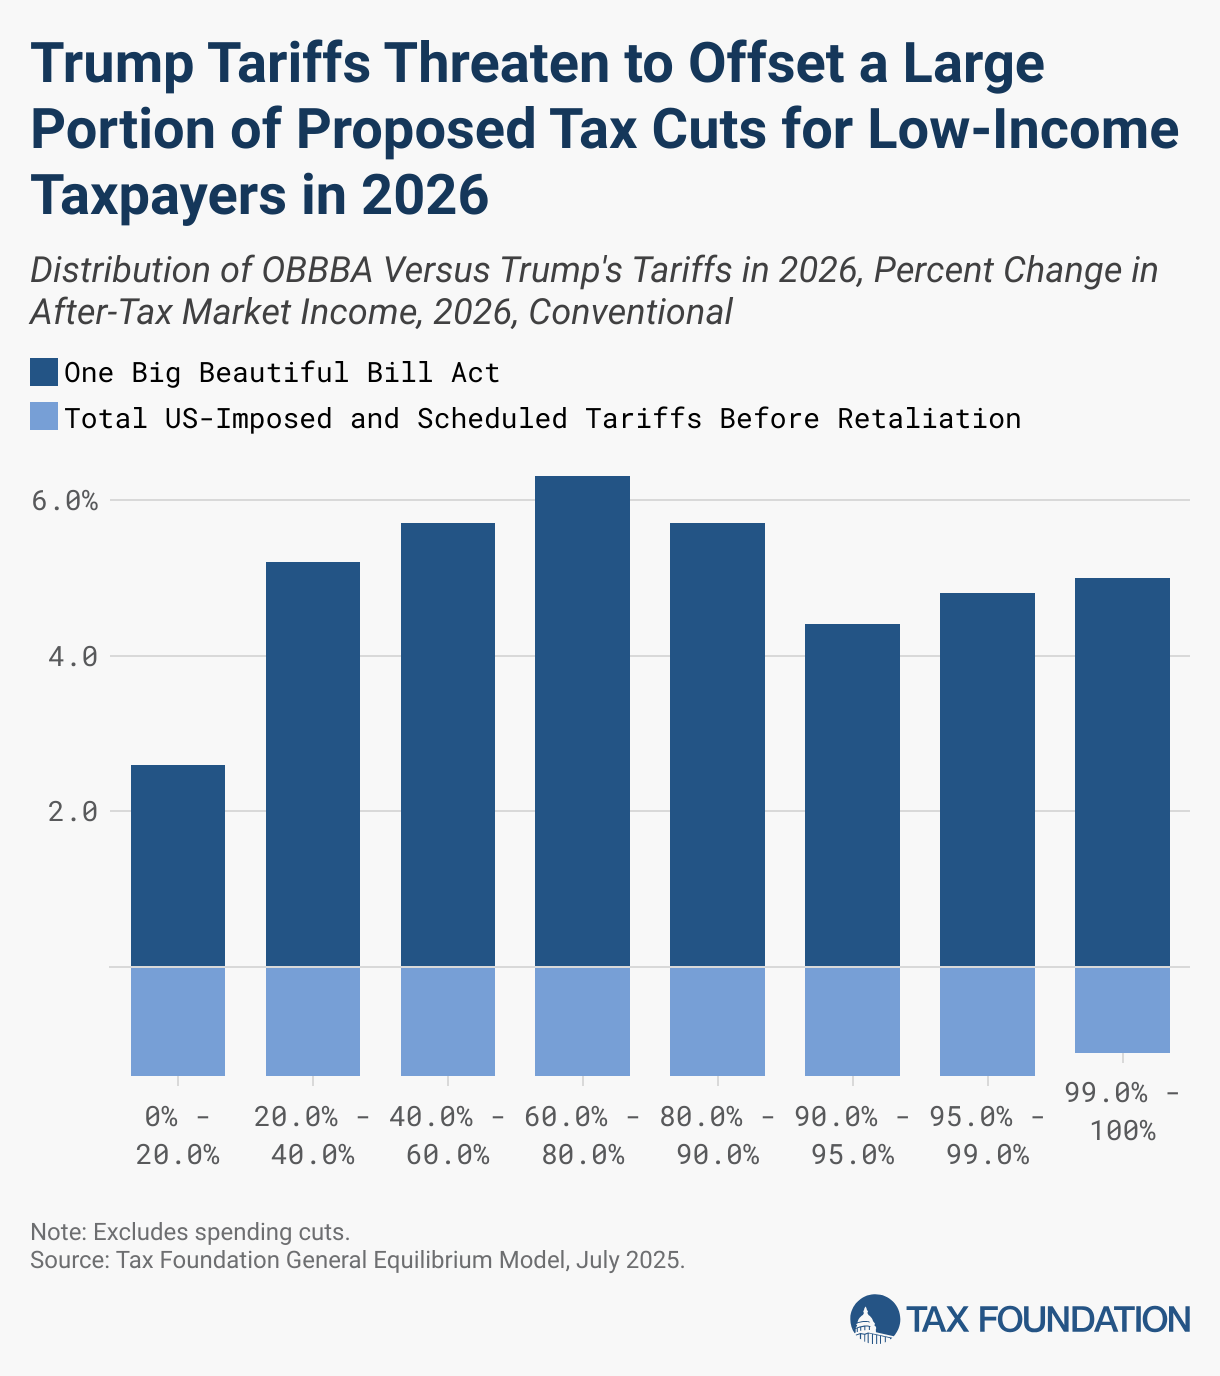
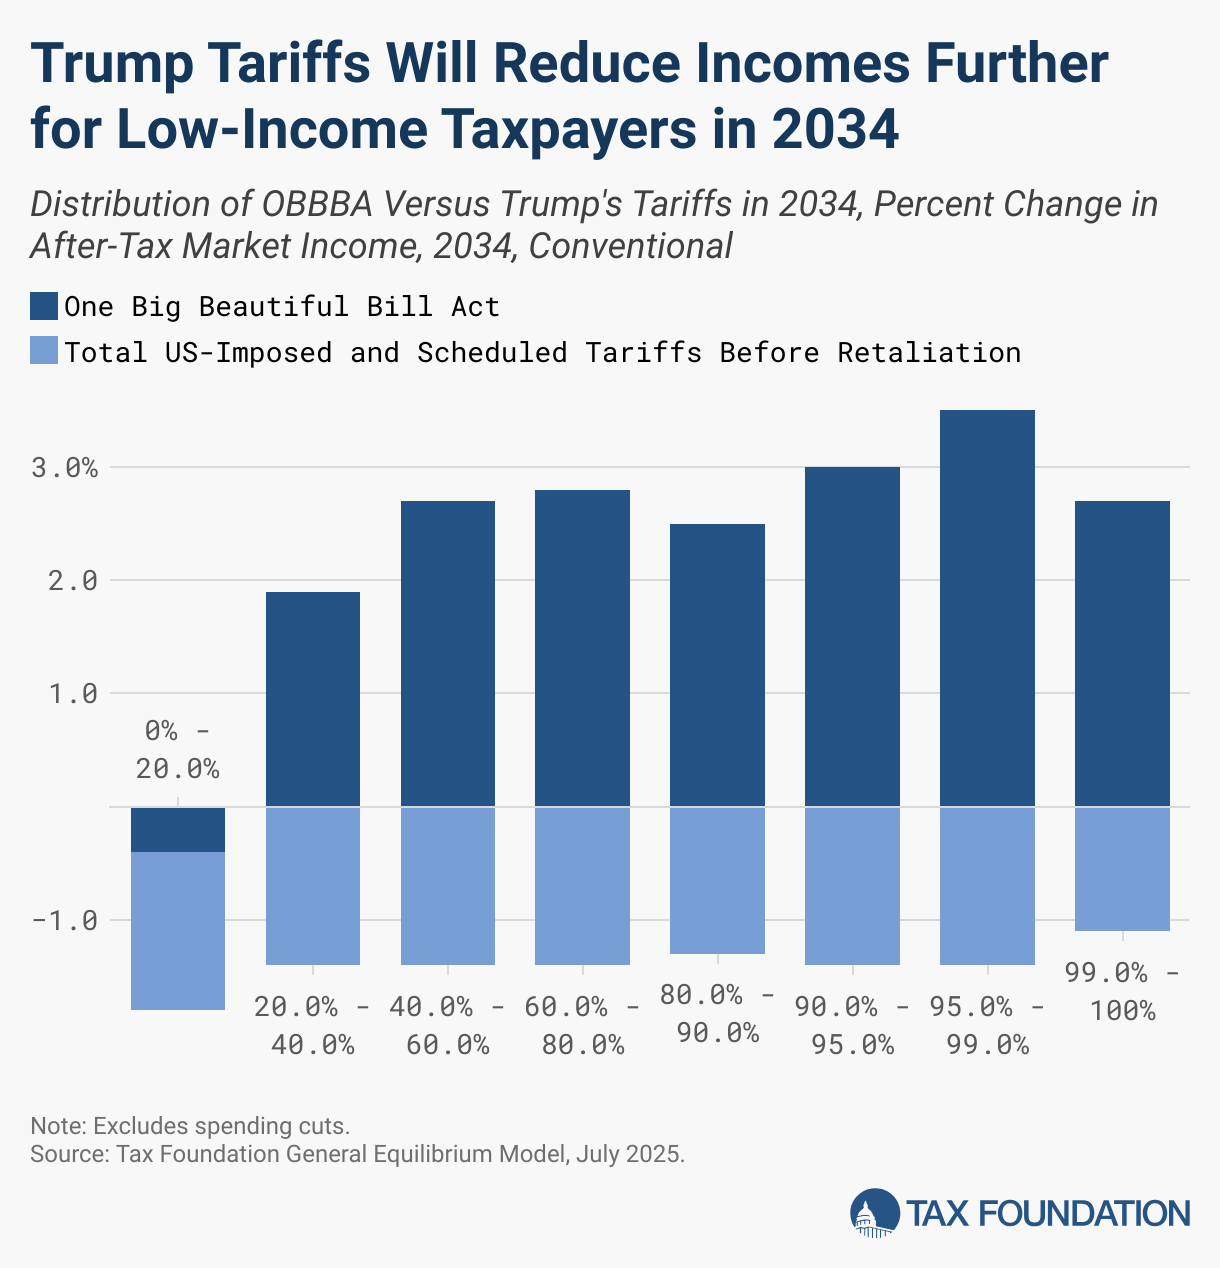
Table 2. Percentage Change in After-Tax Market Income, 2026, Conventional
| Market Income Percentile | TCJA Individual Permanence | "One, Big, Beautiful Bill" | Tariffs in Effect May 2025, Before Retaliation |
|---|---|---|---|
| 0% - 20.0% | 1.6% | 2.1% | -1.2% |
| 20.0% - 40.0% | 2.0% | 4.6% | -1.2% |
| 40.0% - 60.0% | 1.8% | 4.5% | -1.2% |
| 60.0% - 80.0% | 2.1% | 4.4% | -1.2% |
| 80.0% - 100% | 2.3% | 4.3% | -1.2% |
| 80.0% - 90.0% | 1.9% | 4.2% | -1.2% |
| 90.0% - 95.0% | 2.4% | 4.1% | -1.3% |
| 95.0% - 99.0% | 3.2% | 4.5% | -1.2% |
| 99.0% - 100% | 1.8% | 4.4% | -1.0% |
| Total | 2.2% | 4.4% | -1.2% |
Source: Tax Foundation General Equilibrium Model, May 2025
Table 3. Percentage Change in After-Tax Market Income, 2034, Conventional
| Market Income Percentile | TCJA Individual Permanence | "One, Big, Beautiful Bill" | Tariffs in Effect May 2025, Before Retaliation |
|---|---|---|---|
| 0% - 20.0% | 1.8% | 0.1% | -1.1% |
| 20.0% - 40.0% | 1.9% | 1.4% | -1.1% |
| 40.0% - 60.0% | 2.0% | 2.2% | -1.2% |
| 60.0% - 80.0% | 2.1% | 2.4% | -1.1% |
| 80.0% - 100% | 2.4% | 2.7% | -1.1% |
| 80.0% - 90.0% | 2.0% | 2.4% | -1.2% |
| 90.0% - 95.0% | 2.5% | 2.9% | -1.2% |
| 95.0% - 99.0% | 3.2% | 3.2% | -1.1% |
| 99.0% - 100% | 1.9% | 2.3% | -1.0% |
Source: Tax Foundation General Equilibrium Model, May 2025 Share this article