Note: Each year we review and improve the methodology of the Index. For that reason, prior editions are not comparable to the results in this 2024 edition. All data and methodological notes are accessible in our GitHub repository. Below is an abbreviated version of the 2024 Index. To access the full report, click the download button above.
Introduction
The structure of a country’s taxA tax is a mandatory payment or charge collected by local, state, and national governments from individuals or businesses to cover the costs of general government services, goods, and activities. code is a determining factor of its economic performance. A well-structured tax code is easy for taxpayers to comply with and can promote economic development while raising sufficient revenue for a government’s priorities. In contrast, poorly structured tax systems can be costly, distort economic decision-making, and harm domestic economies.
Many countries have recognized this and have reformed their tax codes. Over the past few decades, marginal tax rates on corporate and individual income have declined significantly across the Organisation for Economic Co-operation and Development (OECD). Now, most OECD nations raise a significant amount of revenue from broad-based taxes such as payroll taxes and value-added taxes (VAT).[1]
Not all recent changes in tax policy among OECD countries have improved the structure of tax systems; some have made a negative impact. Though some countries like the United States, France, and Austria have reduced their corporate income taxA corporate income tax (CIT) is levied by federal and state governments on business profits. Many companies are not subject to the CIT because they are taxed as pass-through businesses, with income reportable under the individual income tax. rates by several percentage points, others, like Colombia, have increased them. Corporate tax baseThe tax base is the total amount of income, property, assets, consumption, transactions, or other economic activity subject to taxation by a tax authority. A narrow tax base is non-neutral and inefficient. A broad tax base reduces tax administration costs and allows more revenue to be raised at lower rates. improvements have occurred in the United Kingdom and Portugal, while the corporate tax base has been made less competitive in Belgium and New Zealand. The United States, Canada, and Finland are phasing out temporary improvements to their corporate tax bases.[2]
The COVID-19 pandemic has led many countries to adopt temporary changes to their tax systems. Faced with revenue shortfalls from the downturn, countries will need to consider how to best structure their tax systems to foster both an economic recovery and raise revenue.
The variety of approaches to taxation among OECD countries creates a need to evaluate these systems relative to each other. For that purpose, we have developed the International Tax Competitiveness Index—a relative comparison of OECD countries’ tax systems with respect to competitiveness and neutrality.
The International Tax Competitiveness Index
The International Tax Competitiveness Index (ITCI) seeks to measure the extent to which a country’s tax system adheres to two important aspects of tax policy: competitiveness and neutrality.
A competitive tax code is one that keeps marginal tax rates low. In today’s globalized world, capital is highly mobile. Businesses can choose to invest in any number of countries throughout the world to find the highest rate of return. This means that businesses will look for countries with lower tax rates on investment to maximize their after-tax rate of return. If a country’s tax rate is too high, it will drive investment elsewhere, leading to slower economic growth. In addition, high marginal tax rates can impede domestic investment and lead to tax avoidance.
According to research from the OECD, corporate taxes are most harmful for economic growth, with personal income taxes and consumption taxes being less harmful. Taxes on immovable property have the smallest impact on growth.[3]
Separately, a neutral tax code is simply one that seeks to raise the most revenue with the fewest economic distortions. This means that it doesn’t favor consumption over saving, as happens with investment taxes and wealth taxes. It also means few or no targeted tax breaks for specific activities carried out by businesses or individuals.
As tax laws become more complex, they also become less neutral. If, in theory, the same taxes apply to all businesses and individuals, but the rules are such that large businesses or wealthy individuals can change their behavior to gain a tax advantage, this undermines the neutrality of a tax system.
A tax code that is competitive and neutral promotes sustainable economic growth and investment while raising sufficient revenue for government priorities.
There are many factors unrelated to taxes which affect a country’s economic performance. Nevertheless, taxes play an important role in the health of a country’s economy.
To measure whether a country’s tax system is neutral and competitive, the ITCI looks at more than 40 tax policy variables. These variables measure not only the level of tax rates, but also how taxes are structured. The Index looks at a country’s corporate taxes, individual income taxes, consumption taxes, property taxes, and the treatment of profits earned overseas. The ITCI gives a comprehensive overview of how developed countries’ tax codes compare, explains why certain tax codes stand out as good or bad models for reform, and provides important insight into how to think about tax policy.
Due to some data limitations, recent tax changes in some countries may not be reflected in this year’s version of the International Tax Competitiveness Index.
2024 Rankings
For the 11th year in a row, Estonia has the best tax code in the OECD. Its top score is driven by four positive features of its tax system. First, it has a 20 percent tax rate on corporate income that is only applied to distributed profits. Second, it has a flat 20 percent tax on individual income that does not apply to personal dividend income. Third, its property taxA property tax is primarily levied on immovable property like land and buildings, as well as on tangible personal property that is movable, like vehicles and equipment. Property taxes are the single largest source of state and local revenue in the U.S. and help fund schools, roads, police, and other services. applies only to the value of land, rather than to the value of real property or capital. Finally, it has a territorial tax systemTerritorial taxation is a system that excludes foreign earnings from a country’s domestic tax base. This is common throughout the world and is the opposite of worldwide taxation, where foreign earnings are included in the domestic tax base. that exempts 100 percent of foreign profits earned by domestic corporations from domestic taxation, with few restrictions.
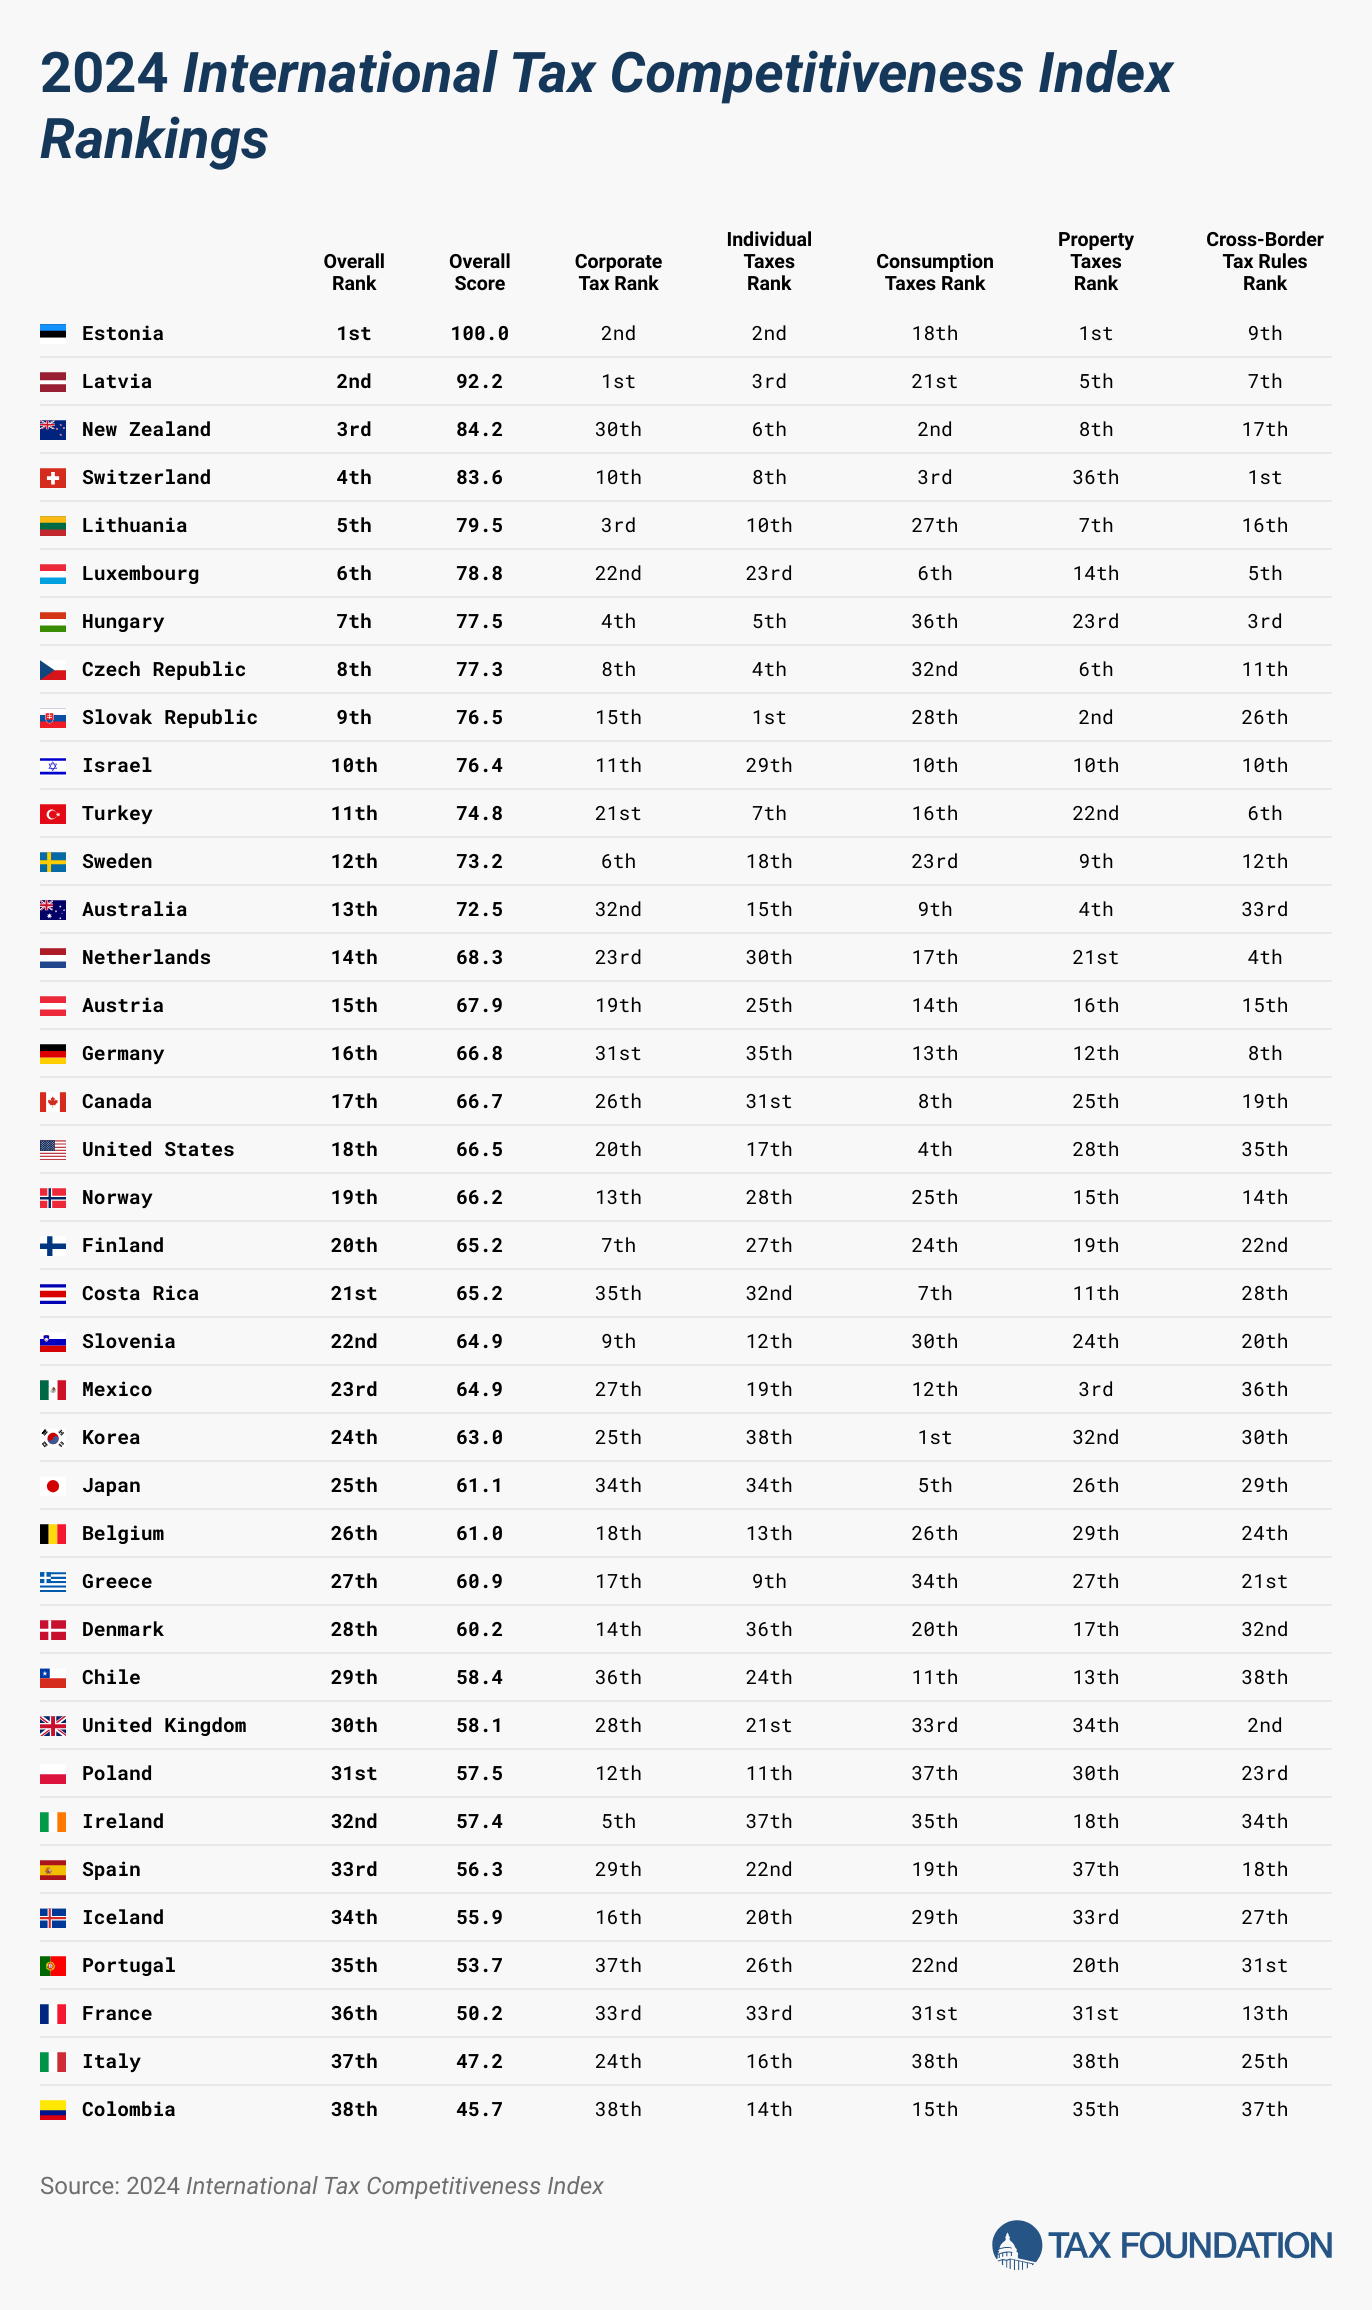
Table 1. 2024 International Tax Competitiveness Index Rankings
| Country | Overall Rank | Overall Score | Corporate Tax Rank | Individual Taxes Rank | Consumption Taxes Rank | Property Taxes Rank | Cross-Border Tax Rules Rank |
|---|---|---|---|---|---|---|---|
| Australia | 13 | 72.5 | 32 | 15 | 9 | 4 | 33 |
| Austria | 15 | 67.9 | 19 | 25 | 14 | 16 | 15 |
| Belgium | 26 | 61 | 18 | 13 | 26 | 29 | 24 |
| Canada | 17 | 66.7 | 26 | 31 | 8 | 25 | 19 |
| Chile | 29 | 58.4 | 36 | 24 | 11 | 13 | 38 |
| Colombia | 38 | 45.7 | 38 | 14 | 15 | 35 | 37 |
| Costa Rica | 21 | 65.2 | 35 | 32 | 7 | 11 | 28 |
| Czech Republic | 8 | 77.3 | 8 | 4 | 32 | 6 | 11 |
| Denmark | 28 | 60.2 | 14 | 36 | 20 | 17 | 32 |
| Estonia | 1 | 100 | 2 | 2 | 18 | 1 | 9 |
| Finland | 20 | 65.2 | 7 | 27 | 24 | 19 | 22 |
| France | 36 | 50.2 | 33 | 33 | 31 | 31 | 13 |
| Germany | 16 | 66.8 | 31 | 35 | 13 | 12 | 8 |
| Greece | 27 | 60.9 | 17 | 9 | 34 | 27 | 21 |
| Hungary | 7 | 77.5 | 4 | 5 | 36 | 23 | 3 |
| Iceland | 34 | 55.9 | 16 | 20 | 29 | 33 | 27 |
| Ireland | 32 | 57.4 | 5 | 37 | 35 | 18 | 34 |
| Israel | 10 | 76.4 | 11 | 29 | 10 | 10 | 10 |
| Italy | 37 | 47.2 | 24 | 16 | 38 | 38 | 25 |
| Japan | 25 | 61.1 | 34 | 34 | 5 | 26 | 29 |
| Korea | 24 | 63 | 25 | 38 | 1 | 32 | 30 |
| Latvia | 2 | 92.2 | 1 | 3 | 21 | 5 | 7 |
| Lithuania | 5 | 79.5 | 3 | 10 | 27 | 7 | 16 |
| Luxembourg | 6 | 78.8 | 22 | 23 | 6 | 14 | 5 |
| Mexico | 23 | 64.9 | 27 | 19 | 12 | 3 | 36 |
| Netherlands | 14 | 68.3 | 23 | 30 | 17 | 21 | 4 |
| New Zealand | 3 | 84.2 | 30 | 6 | 2 | 8 | 17 |
| Norway | 19 | 66.2 | 13 | 28 | 25 | 15 | 14 |
| Poland | 31 | 57.5 | 12 | 11 | 37 | 30 | 23 |
| Portugal | 35 | 53.7 | 37 | 26 | 22 | 20 | 31 |
| Slovak Republic | 9 | 76.5 | 15 | 1 | 28 | 2 | 26 |
| Slovenia | 22 | 64.9 | 9 | 12 | 30 | 24 | 20 |
| Spain | 33 | 56.3 | 29 | 22 | 19 | 37 | 18 |
| Sweden | 12 | 73.2 | 6 | 18 | 23 | 9 | 12 |
| Switzerland | 4 | 83.6 | 10 | 8 | 3 | 36 | 1 |
| Turkey | 11 | 74.8 | 21 | 7 | 16 | 22 | 6 |
| United Kingdom | 30 | 58.1 | 28 | 21 | 33 | 34 | 2 |
| United States | 18 | 66.5 | 20 | 17 | 4 | 28 | 35 |
While Estonia’s tax system is the most competitive in the OECD, the other top countries’ tax systems receive high scores due to excellence in one or more of the major tax categories. Latvia, which recently adopted the Estonian system for corporate taxation, also has a relatively efficient system for taxing labor income. New Zealand has a relatively flat, low-rate individual income taxAn individual income tax (or personal income tax) is levied on the wages, salaries, investments, or other forms of income an individual or household earns. The U.S. imposes a progressive income tax where rates increase with income. The Federal Income Tax was established in 1913 with the ratification of the 16th Amendment. Though barely 100 years old, individual income taxes are the largest source of tax revenue in the U.S. that also largely exempts capital gains (with a combined top rate of 39 percent), a broad-based VAT, and levies no taxes on inheritance, property transfers, assets, or financial transactions. Switzerland has a relatively low corporate tax rate (19.7 percent), a low, broad-based consumption taxA consumption tax is typically levied on the purchase of goods or services and is paid directly or indirectly by the consumer in the form of retail sales taxes, excise taxes, tariffs, value-added taxes (VAT), or income taxes where all savings are tax-deductible. , and an individual income tax that partially exempts capital gains from taxation. Lithuania has a low corporate tax rate of 15 percent, allows businesses to deduct a high share of their capital investment costs, and levies a relatively flat and low-rate individual income tax.
Colombia has the least competitive tax system in the OECD. It has a net wealth taxA wealth tax is imposed on an individual’s net wealth, or the market value of their total owned assets minus liabilities. A wealth tax can be narrowly or widely defined, and depending on the definition of wealth, the base for a wealth tax can vary. , a financial transaction tax, and the highest corporate income tax rate of 35 percent. Colombia’s VAT covers 41 percent of final consumption, revealing both policy and enforcement gaps.
Italy has the second-least competitive tax system in the OECD. It has multiple distortionary property taxes with separate levies on real estate transfers, estates, and financial transactions, as well as a wealth tax on selected assets. Italy’s relatively high VAT rate of 22 percent applies to the seventh-narrowest consumption tax base in the OECD.
Countries that rank poorly on the ITCI often levy relatively high marginal tax rates on corporate income or have multiple layers of tax rules that contribute to complexity. The five countries at the bottom of the rankings all have higher-than-average combined corporate tax rates. Ireland ranks poorly on the ITCI despite its low corporate tax rate. This is due to high personal income and dividend taxes and a relatively narrow VAT base. The five lowest-ranking countries have unusually high corporate income tax rates, between 25 and 35 percent. Four out of the five lowest-ranking countries have unusually high top income tax thresholds, at 10 to 59 times the average income.
Notable Changes from Last Year
Austria
Austria has been reducing its corporate income tax rate over several years, a process that concluded in 2024. As part of this scheduled reduction, Austria dropped its corporate rate from 25 percent in 2022 to 23 percent in 2024. It also made its accelerated depreciationDepreciation is a measurement of the “useful life” of a business asset, such as machinery or a factory, to determine the multiyear period over which the cost of that asset can be deducted from taxable income. Instead of allowing businesses to deduct the cost of investments immediately (i.e., full expensing), depreciation requires deductions to be taken over time, reducing their value and discouraging investment. schedule for buildings permanent. Austria’s rank improved from 17th to 15th.
Canada
In 2024, Canada started to phase out full expensingFull expensing allows businesses to immediately deduct the full cost of certain investments in new or improved technology, equipment, or buildings. It alleviates a bias in the tax code and incentivizes companies to invest more, which, in the long run, raises worker productivity, boosts wages, and creates more jobs. for machinery and the accelerated investment incentive for buildings and adopted a digital services tax. By increasing its capital gains inclusion rate from half to two-thirds, Canada also hiked its top capital gains rate from 26.7 to 35.8 percent. Canada’s rank fell from 15th to 17th.
Czech Republic
The Czech Republic phased out extraordinary depreciation for machinery and equipment in 2024, reducing the value of its capital allowances by 10 percentage points. It also increased its corporate tax rate from 19 to 21 percent. The Czech Republic’s rank fell from 5th to 8th.
Germany
Germany partially reinstated its accelerated depreciation schedule for machinery and equipment and relaxed its limits on loss carryforwards from 60 to 70 percent of current income for half of the corporate tax base in spring 2024. Germany’s rank improved from 18th to 16th.
Slovenia
Slovenia increased its corporate rate from 19 percent to 22 percent. Slovenia’s rank declined from 16th to 23rd.
United Kingdom
With the 2023 Autumn Statement, the UK made full expensing for plants and equipment and the 50 percent first-year allowance for certain long-life items permanent features of the tax code, averting their expiration by 2026. The UK’s ranking remained 30th.
United States
The US continues to phase out full expensing for plants and equipment. The US increased the relative attractiveness of its cross-border rules, as many other nations started to implement income inclusion rules and domestic top-up taxes within the global minimum tax process. The US rank improved from 23rd to 18th.
Table 2. Changes from Last Year
| Country | 2023 Rank | 2023 Score | 2024 Rank | 2024 Score | Change in Rank from 2023 to 2024 | Change in Score from 2023 to 2024 |
|---|---|---|---|---|---|---|
| Australia | 13 | 72.7 | 13 | 72.5 | 0 | -0.2 |
| Austria | 17 | 67 | 15 | 67.9 | 2 | 0.9 |
| Belgium | 24 | 62.3 | 26 | 61 | -2 | -1.3 |
| Canada | 15 | 69.5 | 17 | 66.7 | -2 | -2.8 |
| Chile | 29 | 58.8 | 29 | 58.4 | 0 | -0.4 |
| Colombia | 38 | 43.9 | 38 | 45.7 | 0 | 1.8 |
| Costa Rica | 21 | 64.4 | 21 | 65.2 | 0 | 0.8 |
| Czech Republic | 5 | 78.5 | 8 | 77.3 | -3 | -1.2 |
| Denmark | 28 | 60.5 | 28 | 60.2 | 0 | -0.2 |
| Estonia | 1 | 100 | 1 | 100 | 0 | 0 |
| Finland | 20 | 65.9 | 20 | 65.2 | 0 | -0.7 |
| France | 36 | 51 | 36 | 50.2 | 0 | -0.7 |
| Germany | 18 | 66.6 | 16 | 66.8 | 2 | 0.2 |
| Greece | 27 | 62.2 | 27 | 60.9 | 0 | -1.3 |
| Hungary | 8 | 76.6 | 7 | 77.5 | 1 | 0.8 |
| Iceland | 33 | 56.6 | 34 | 55.9 | -1 | -0.7 |
| Ireland | 32 | 58.1 | 32 | 57.4 | 0 | -0.8 |
| Israel | 10 | 74.9 | 10 | 76.4 | 0 | 1.5 |
| Italy | 37 | 48.6 | 37 | 47.2 | 0 | -1.4 |
| Japan | 26 | 62.2 | 25 | 61.1 | 1 | -1.1 |
| Korea | 25 | 62.2 | 24 | 63 | 1 | 0.8 |
| Latvia | 2 | 88.9 | 2 | 92.2 | 0 | 3.3 |
| Lithuania | 7 | 77.8 | 5 | 79.5 | 2 | 1.7 |
| Luxembourg | 6 | 78.3 | 6 | 78.8 | 0 | 0.5 |
| Mexico | 22 | 64.3 | 23 | 64.9 | -1 | 0.6 |
| Netherlands | 14 | 70.4 | 14 | 68.3 | 0 | -2.1 |
| New Zealand | 3 | 84.4 | 3 | 84.2 | 0 | -0.2 |
| Norway | 19 | 66.6 | 19 | 66.2 | 0 | -0.4 |
| Poland | 30 | 58.6 | 31 | 57.5 | -1 | -1.1 |
| Portugal | 35 | 53.9 | 35 | 53.7 | 0 | -0.1 |
| Slovak Republic | 9 | 75.4 | 9 | 76.5 | 0 | 1.1 |
| Slovenia | 16 | 67.4 | 22 | 64.9 | -6 | -2.5 |
| Spain | 34 | 56.3 | 33 | 56.3 | 1 | -0.1 |
| Sweden | 12 | 73.2 | 12 | 73.2 | 0 | 0 |
| Switzerland | 4 | 83 | 4 | 83.6 | 0 | 0.6 |
| Turkey | 11 | 73.4 | 11 | 74.8 | 0 | 1.3 |
| United Kingdom | 31 | 58.4 | 30 | 58.1 | 1 | -0.3 |
| United States | 23 | 63.2 | 18 | 66.5 | 5 | 3.3 |
Methodological Changes
Each year, we review the Index’s data and methodology to improve how it measures both competitiveness and neutrality. This year, we have changed the way the Index treats corporate taxes and individual taxes.
We have applied each change to prior years to allow consistent comparison across years. Data for all years using the current methodology is accessible in the GitHub repository for the Index,[5] and a description of how the Index is calculated is provided in the Appendix of this report. Prior editions of the Index, however, are not comparable to the results in this 2023 edition due to these methodological changes.
Corporate Tax
The net present value of capital allowances for machinery, industrial buildings, and intangibles is now included without a time lag.
Countries are penalized for the absolute value of the revenue share raised from non-standard corporate taxes, accounting for years when these provisions generate negative revenues.
Individual Taxes
During the production of this year’s report, the OECD data on top personal income tax rates was updated and uploaded to the new platform. Employee-side social security contributions are included when these aren’t phased out before the top threshold and the combined rate at the top income rate threshold is higher than the statutory top rate.
The ratio of the marginal and average tax wedgeBroadly speaking, a tax wedge is the difference between the pre-tax price or return and after-tax price or return. For labor income, it is the difference between the total labor costs to the employer and the corresponding net take-home pay of the employee. was previously averaged over the earnings at 67, 100, 133, and 167 percent of the average wage. Due to limited data availability, it is now an average of the ratio at earnings of 67, 100, and 167 percent of the average wage.
As on the corporate side, the absolute value of the revenue share raised from non-standard employer and employee payroll taxes serves as an indicator of complexity, accounting for years when these provisions raise negative revenues.
Cross-Border Rules
The new global minimum tax variable indicates whether a country levies a minimum tax on resident companies’ global income and taxes their worldwide income. It takes the value 0.5 for having an income inclusion rule (IIR), and the value of 1 for having both an income inclusion rule and an undertaxed profits rule (UTPR). For the United States, the variable reflects the global intangible low-taxed income (GILTI) and the base-erosion and anti-abuse tax (BEAT) provisions, which have somewhat similar objectives and complexities. Previously, the controlled foreign corporation (CFC) rules variable contained an indicator for the global minimum tax. The qualified domestic top-up tax (QDMTT) enters into the corporate alternative minimum tax variable.
Corporate Income Tax
The corporate income tax is a direct taxA direct tax is levied on individuals and organizations and is not expected to be passed on to another payer (unlike indirect taxes such as sales and excise taxes), though economic incidence can still fall upon others. Often with a direct tax, such as the individual income tax, tax rates increase as the taxpayer’s ability to pay, or financial resources, increases, resulting in what is called a progressive tax. Article 1, Section 9, of the US Constitution requires direct taxes to be apportioned by state population, though the 16th Amendment establishes that income taxes are not subject to this requirement. on the profits of a corporation. All OECD countries levy a tax on corporate profits, but the tax rates and bases vary significantly across countries. Corporate income taxes reduce the after-tax rate of return on corporate investment. This increases the cost of capital, which leads to lower levels of investment and economic output. Additionally, the corporate tax can lead to lower wages for workers, lower returns for investors, and higher prices for consumers.
Although the corporate income tax has a relatively significant impact on a country’s economy, it raises a relatively low amount of tax revenue for most governments—the OECD average was 11.8 percent of total revenues in 2022.[6]
The ITCI breaks the corporate income tax category into three subcategories. Table 3 displays each country’s Corporate Income Tax category rank and score along with the ranks and scores of the subcategories, namely, the corporate rate, cost recoveryCost recovery refers to how the tax system permits businesses to recover the cost of investments through depreciation or amortization. Depreciation and amortization deductions affect taxable income, effective tax rates, and investment decisions. , and incentives and complexity.
Combined Top Marginal Corporate Income Tax Rate
The top marginal corporate income tax rate measures the rate at which each additional dollar of taxable profit is taxed. High marginal corporate tax rates tend to discourage capital formation and thus slow economic growth.[7] Countries with higher top marginal corporate income tax rates than the OECD average receive lower scores than those with lower, more competitive rates.
Colombia levies the highest top combined corporate income tax rate, at 35 percent, followed by Portugal (31.5 percent) and Australia, Costa Rica, and Mexico (all at 30 percent). The lowest top marginal corporate income tax rate in the OECD is found in Hungary, at 9 percent, followed by Ireland (12.5 percent) and Lithuania (15 percent). The OECD average combined corporate income tax rate is 23.9 percent for 2024.[8]
Table 3. Corporate Taxes
| Country | Overall Rank | Overall Score | Rate Rank | Rate Score | Cost Recovery Rank | Cost Recovery Score | Incentives/Complexity Rank | Incentives/Complexity Score |
|---|---|---|---|---|---|---|---|---|
| Australia | 32 | 46 | 34 | 32.7 | 21 | 45.9 | 18 | 69.5 |
| Austria | 19 | 61.3 | 17 | 55.1 | 10 | 51 | 28 | 66.1 |
| Belgium | 18 | 62 | 20 | 48.7 | 5 | 56.3 | 15 | 73.4 |
| Canada | 26 | 53.4 | 27 | 45.1 | 19 | 47.4 | 27 | 66.3 |
| Chile | 36 | 39.3 | 29 | 42.3 | 38 | 23.8 | 33 | 60 |
| Colombia | 38 | 31.6 | 38 | 16.7 | 34 | 36.5 | 21 | 69 |
| Costa Rica | 35 | 40.8 | 34 | 32.7 | 35 | 36.2 | 23 | 66.8 |
| Czech Republic | 8 | 69.8 | 10 | 61.5 | 24 | 45.6 | 6 | 87.2 |
| Denmark | 14 | 63.4 | 13 | 58.3 | 30 | 40.1 | 12 | 81.3 |
| Estonia | 2 | 98.7 | 6 | 64.8 | 1 | 100 | 2 | 95.9 |
| Finland | 7 | 71 | 6 | 64.8 | 28 | 41 | 4 | 91.1 |
| France | 33 | 44.6 | 26 | 46.1 | 14 | 50.3 | 38 | 32.8 |
| Germany | 31 | 48.3 | 33 | 32.9 | 12 | 50.9 | 20 | 69.4 |
| Greece | 17 | 62.1 | 13 | 58.3 | 33 | 36.6 | 11 | 82 |
| Hungary | 4 | 82.9 | 1 | 100 | 36 | 35.9 | 29 | 66 |
| Iceland | 16 | 63.2 | 10 | 61.5 | 23 | 45.7 | 24 | 66.6 |
| Ireland | 5 | 79.1 | 2 | 88.8 | 29 | 40.5 | 17 | 69.9 |
| Israel | 11 | 66.4 | 17 | 55.1 | 16 | 49.6 | 10 | 83.7 |
| Italy | 24 | 55.1 | 30 | 39.7 | 4 | 59.5 | 30 | 65.1 |
| Japan | 34 | 43.4 | 32 | 33.5 | 32 | 38.9 | 19 | 69.4 |
| Korea | 25 | 54.5 | 28 | 44.2 | 11 | 50.9 | 26 | 66.5 |
| Latvia | 1 | 100 | 6 | 64.8 | 1 | 100 | 1 | 100 |
| Lithuania | 3 | 84 | 3 | 80.8 | 3 | 64.7 | 22 | 67.5 |
| Luxembourg | 22 | 56.4 | 19 | 48.9 | 13 | 50.5 | 31 | 63.7 |
| Mexico | 27 | 52.3 | 34 | 32.7 | 26 | 43.1 | 3 | 92.8 |
| Netherlands | 23 | 55.9 | 25 | 46.2 | 17 | 48.5 | 16 | 70.1 |
| New Zealand | 30 | 48.8 | 31 | 39.1 | 37 | 32.2 | 9 | 84.3 |
| Norway | 13 | 64.6 | 13 | 58.3 | 31 | 39.9 | 8 | 85.3 |
| Poland | 12 | 65.6 | 4 | 68 | 9 | 51.1 | 36 | 54.2 |
| Portugal | 37 | 36.1 | 37 | 27.9 | 6 | 55.5 | 37 | 34.9 |
| Slovak Republic | 15 | 63.2 | 10 | 61.5 | 22 | 45.7 | 25 | 66.6 |
| Slovenia | 9 | 67.5 | 13 | 58.3 | 25 | 45.5 | 7 | 86.7 |
| Spain | 29 | 50 | 20 | 48.7 | 27 | 42.3 | 34 | 55.4 |
| Sweden | 6 | 72.6 | 9 | 62.8 | 18 | 47.4 | 5 | 90.8 |
| Switzerland | 10 | 67.3 | 5 | 66 | 8 | 51.2 | 32 | 63.2 |
| Turkey | 21 | 59.7 | 20 | 48.7 | 15 | 49.9 | 14 | 75.2 |
| United Kingdom | 28 | 51.8 | 20 | 48.7 | 20 | 46.7 | 35 | 54.9 |
| United States | 20 | 61 | 24 | 46.7 | 7 | 52.3 | 13 | 79.7 |
Cost Recovery
Business profits are generally determined as revenue (what a business makes in sales) minus costs (the cost of doing business). The corporate income tax is intended to be a tax on these profits. Thus, it is important that a tax code properly defines what constitutes taxable incomeTaxable income is the amount of income subject to tax, after deductions and exemptions. Taxable income differs from—and is less than—gross income. . If a tax code does not allow businesses to account for all the costs of doing business, it will inflate a business’s taxable income and thus its tax bill. This increases the cost of capital, leading to slower investment and economic growth.
Loss Offset Rules: Carryforwards and Carrybacks
Loss carryover provisions allow businesses to either deduct current year losses against future profits (carryforwards) or deduct current year losses against past profits (carrybacks). Many companies have investment projects with different risk profiles and operate in industries that fluctuate greatly with the business cycle. Carryover provisions help businesses “smooth” their risk and income, making the tax code more neutral across investments and over time.[9]
Ideally, a tax code allows businesses to carry forward their losses for an unlimited number of years, ensuring that a business is taxed on its average profitability over time. While some countries do allow for indefinite loss carryovers, others have time—and deductibility—limits.
In 22 of the 38 OECD countries, corporations can carry forward losses indefinitely in 2023, though 13 of these limit the amount of taxable income that can be offset by losses from previous years.[10] Of the 16 countries with time limits, the average loss carryforward period is eight years. Hungary, Poland, and Slovakia have the most restrictive loss carryover provisions in the OECD: carrybacks are not allowed, and carryforwards are not only limited to five years but also capped at 50 percent of taxable income (coded as 2.5 years).[11] The ITCI ranks countries that allow losses to be carried forward indefinitely without limits better than countries that impose time or deductibility restrictions on carryforwards.
Countries tend to be significantly more restrictive with loss carryback provisions than with carryforward provisions. In 2023, only the Estonian and Latvian systems allow, by design, unlimited carrybacks of losses.[12] Of the nine countries that allow time-limited carrybacks, the average period is 1.3 years.[13] The ITCI penalizes the 27 countries that do not allow any loss carrybacks.
Capital Cost Recovery: Machines, Buildings, and Intangibles
Businesses determine their profits by subtracting costs—such as wages and raw materials—from revenue. However, in most jurisdictions, capital investments—such as in buildings, machinery, and intangibles—are not treated like other regular costs that can be subtracted from revenue in the year the money is spent. Instead, businesses are required to write off these costs over several years or even decades, depending on the type of asset.
Depreciation schedules specify the amounts businesses are legally allowed to write off, as well as the time period over which assets need to be written off. For instance, a government may require a business to deduct an equal percentage of the cost of a machine over a seven-year period. By the end of the depreciation period, the business would have deducted the total initial dollar cost of the asset. However, due to the time value of money (a normal real return plus inflationInflation is when the general price of goods and services increases across the economy, reducing the purchasing power of a currency and the value of certain assets. The same paycheck covers less goods, services, and bills. It is sometimes referred to as a “hidden tax,” as it leaves taxpayers less well-off due to higher costs and “bracket creep,” while increasing the government’s spending power. ), write-offs in later years are not as valuable in real terms as write-offs in earlier years. As a result, businesses effectively lose the ability to deduct the full present value of their investment cost. This tax treatment of capital expenses understates true business costs and overstates taxable income in present value terms.[14]
The ITCI measures a country’s capital allowances for three asset types, namely, machinery, industrial buildings, and intangibles.[15] Capital allowances are expressed as a percent of the present value cost that corporations can write off over the life of an asset. A 100 percent capital allowanceA capital allowance is the amount of capital investment costs, or money directed towards a company’s long-term growth, a business can deduct each year from its revenue via depreciation. These are also sometimes referred to as depreciation allowances. represents a business’ ability to deduct the full cost of an investment over its life in real terms. Countries that provide faster write-offs for capital investments receive better scores in the ITCI.
On average, across the OECD, in real terms, businesses can write off 85.2 percent of investment costs in machinery, 47.2 percent of the cost of industrial buildings, and 76.4 percent of the cost of intangibles.
In 2023, the United Kingdom made full expensing for machinery and equipment a permanent feature of its tax code. Finland and Germany prolonged or reinstated accelerated depreciation for machinery in 2024.
In contrast, Canada and the United States are phasing out their policies of full expensing. In 2024, the United States only grants a 60 percent expensing allowance. Additionally, the Czech Republic ended its policy of extraordinary depreciation for machinery and New Zealand abolished its capital allowances for long-life commercial buildings entirely.
Estonia and Latvia are coded as allowing 100 percent of the present value of a capital investment to be written off, as their corporate tax only applies to distributed profits and is thus determined by cash flow.[16]
Inventories
Similar to capital investments, the costs of inventories are not written off in the year of purchase. Instead, the costs of inventories are deducted at sale. As a result, governments need to define the total cost of inventories sold. There are generally three methods used to calculate inventories: Last In, First Out (LIFO); Average Cost; and First In, First Out (FIFO).
The method by which a country allows businesses to account for inventories can significantly impact a business’s taxable income. When prices are rising, as is usually the case, LIFO is the preferred method because it allows inventory costs to be closer to true costs at the time of sale. This results in the lowest taxable income for businesses. In contrast, FIFO is the least preferred method because it results in the highest taxable income. The Average Cost method is between FIFO and LIFO.[17]
Countries that allow businesses to choose the LIFO method receive the best scores, those that allow the Average Cost method receive an average score, and countries that only allow the FIFO method receive the worst scores. Fourteen OECD countries allow companies to use the LIFO method of accounting, 19 countries use the Average Cost method of accounting, and five countries limit companies to the FIFO method of accounting.[18]
Allowance for Corporate Equity
Businesses can finance their operations through debt or equity. However, the return on these two types of finance is taxed differently. Standard corporate income tax systems allow tax deductions of interest payments but not of equity costs, effectively providing a tax advantage to debt over equity finance—the so-called “debt bias.” This debt bias can be considered a real risk to economic stability.[19]
There are two broad ways to address this debt bias, namely, limiting the tax deductibility of interest and providing a deduction for equity costs. Limiting the tax deductibility of interest expenses creates new distortions, as interest income usually continues to be fully taxed. An allowance for corporate equity—sometimes referred to as a notional interest deduction—retains the deduction for interest expenses but adds a similar deduction for the normal return on equity, neutralizing the debt bias while eliminating tax distortions to investment.
Three OECD countries—Poland, Portugal, and Turkey—have an allowance for corporate equity.[20] All countries except Poland apply the allowance only to new equity instead of all equity, limiting the tax revenue costs while preserving the efficiency gains. Belgium and Italy phased out their allowances for corporate equity in 2024. The allowance rate is frequently based on the corporate or government bond rate and in some cases is adjusted by a risk premium.[21]
Countries that have implemented an allowance for corporate equity receive a better score in the Index.
Tax Incentives and Complexity
Good tax policy treats economic decisions neutrally, neither encouraging nor discouraging one activity over another. A tax incentive is a tax creditA tax credit is a provision that reduces a taxpayer’s final tax bill, dollar-for-dollar. A tax credit differs from deductions and exemptions, which reduce taxable income rather than the taxpayer’s tax bill directly. , deduction, or preferential tax rate that exclusively applies for a specific type of economic activity and can thus distort economic decisions.
For instance, when an industry receives a tax credit for producing a specific product, it may choose to overinvest in that activity, although it might otherwise not be profitable. Additionally, the cost of special provisions is often offset by shifting the burden onto other taxpayers in the form of higher taxes.
In addition, the possibility of receiving incentives invites efforts to secure these tax preferences,[22] such as lobbying, which creates additional deadweight economic loss as firms focus resources on influencing the tax code in lieu of producing products. For instance, the deadweight losses in the United States attributed to tax compliance and lobbying were estimated to be between $215 billion and $987 billion in 2012. These expenditures for lobbying, along with compliance, have been shown to reduce economic growth by crowding out potential economic activity.[23]
The ITCI considers whether countries provide incentives such as patent boxA patent box—also referred to as intellectual property (IP) regime—taxes business income earned from IP at a rate below the statutory corporate income tax rate, aiming to encourage local research and development. Many patent boxes around the world have undergone substantial reforms due to profit shifting concerns. provisions and research and development (R&D) tax subsidies. Countries that provide such incentives are scored worse than those that do not.
Patent Boxes
Due to an increasingly globalized and mobile economy, countries have searched for ways to prevent corporations from reincorporating or shifting operations or profits elsewhere. One response to the increase in capital mobility has been the creation of patent boxes.
Patent boxes—also referred to as intellectual property, or IP, regimes—provide tax rates on income derived from IP that are below statutory corporate tax rates. Eligible types of IP are most commonly patents and software copyrights. Patent boxes are an income-based rather than an expenditure-based tax incentive, limiting its benefits to successful R&D projects that have produced IP rights rather than decreasing the ex ante risks of R&D through cost reductions.
Intellectual property is extremely mobile. Hence, a country can use the lower tax rate of a patent box to entice corporations to hold their intellectual property within its borders. Research suggests that patent boxes are likely to attract new income derived from patents, implying that businesses reduce their corporate tax liability by shifting IP-related income. Tax revenues, however, are likely to decline, as the negative revenue effects of the lower statutory rate on patent income can be only partially offset by revenues from newly attracted patent income.[24]
In recent years, patent box rules have become more stringent in some countries as the OECD requirements for countering harmful tax practices have been adopted. Countries that follow the OECD standards now require companies to have substantial R&D activity within their borders to benefit from tax preferences associated with their intellectual property.[25]
Instead of providing patent boxes for intellectual property, countries should recognize that all capital is mobile to some degree and lower their corporate tax rates across the board. This would encourage investment of all kinds, rather than merely incentivizing corporations to locate their patents in a specific country.
Seventeen OECD countries—Australia, Belgium, France, Hungary, Ireland, Israel, Korea, Lithuania, Luxembourg, the Netherlands, Poland, Portugal, Slovakia, Spain, Switzerland, Turkey, and the United Kingdom—have patent box legislation, with rates and exemptions varying among countries.[26] The United States has a reduced tax rate for profits from exports related to intellectual property held in the US which is treated as a patent box in the Index. Countries with patent box regimes receive a lower score.
Research and Development
In the absence of full expensing, expenditure-based R&D tax incentives (partially) offset the tax costs of business investment. Unfortunately, R&D tax incentives are rarely neutral—they usually define very specific activities that qualify—and are often complex in their implementation.
As with other incentives, R&D incentives distort investment decisions and can lead to an inefficient allocation of resources.[27] Additionally, the desire to secure R&D incentives encourages the relabeling of expenses as R&D and lobbying activities that consume resources and detract from investment and production. In Italy, for instance, firms can engage in a negotiation process for incentives, such as easy term loans and tax credits.[28]
Countries could better use the revenue spent on special tax incentives to provide a lower business tax rate across the board, improve the tax treatment of capital investment, or extend loss-carryover provisions.[29]
The implied tax subsidy rate on R&D expenditures, developed by the OECD, measures the extent of expenditure-based R&D tax relief across countries. Implied tax subsidy rates are measured as the difference between one unit of investment in R&D and the pretax income required to break even on that investment unit, assuming a representative firm. In other words, it measures the extent of the preferential treatment of R&D in a given tax system. The more generous the tax provisions for R&D, the higher the implied tax subsidy rates for R&D. An implied subsidy rate of zero means R&D does not receive preferential tax treatment.
OECD countries grant implied tax subsidies of R&D expenditures at an average rate of 15.4 percent. Iceland has the highest implied tax subsidy rate, at 36 percent. Portugal and France provide the second and third most generous relief, with implied tax subsidy rates of 35 and 34 percent, respectively.
Of the countries that grant notable relief, Denmark (1 percent), the United States (3 percent), Mexico (6 percent), and Turkey (6 percent) are the least generous. The implied tax subsidy rates of Costa Rica, Estonia, Israel, Latvia, Luxembourg, and Switzerland do not show any significant expenditure-based R&D tax relief.[30]
Countries that provide more generous expenditure-based R&D tax incentives receive a lower score on the ITCI.
Digital Services Taxes
Over the last few years, several OECD countries have implemented so-called digital services taxes (DSTs). DSTs are taxes on selected gross revenue streams of large digital businesses. Their tax base typically includes revenues either derived from a specific set of digital goods or services (for example, targeted online advertising) or based on the number of digital users within a country. Relatively high domestic and global revenue thresholds limit the tax to large multinationals.
DSTs effectively ring-fence the digital economy by limiting the tax to certain revenue streams of large digital businesses, creating distortions based on firm size and business model. In addition, because DSTs are levied on revenues rather than profits, they do not take into account profitability, and thus disproportionally affect firms with lower profit margins.
As of 2024, 12 OECD countries have implemented a DST: Austria, Canada, Denmark, France, Hungary, Italy, Poland, Portugal, Spain, Switzerland, Turkey, and the United Kingdom.[31]
Countries that have implemented a DST receive a lower score on the ITCI.
Complexity
The ITCI quantifies corporate tax code complexity by measuring the number of separate taxes (and rates) that apply to business income, the existence of surtaxA surtax is an additional tax levied on top of an already existing business or individual tax and can have a flat or progressive rate structure. Surtaxes are typically enacted to fund a specific program or initiative, whereas revenue from broader-based taxes, like the individual income tax, typically cover a multitude of programs and services. rates on business income, and the amount of revenue countries collect from business profits taxes other than the corporate income tax. These burdens are measured by tallying up the separate rates that apply to business income, identifying applicable surtaxes, and relying on OECD revenue data to measure the share of revenue from taxes on business income other than the corporate income tax. In 2024, many OECD countries have adopted QDMTTs within the global minimum tax process.[32]
Countries that have multiple rates that apply to corporate income, surtaxes, and collect revenue on income and profits outside of normal income taxes receive worse scores on the ITCI.
The nation with the highest number of separate tax rates is Portugal with six brackets. Costa Rica and Korea follow with five and four, respectively. There are six OECD countries that do not have multiple tax rates or bases for their corporate income tax.[33]
Corporate surtaxes are relatively uncommon in OECD countries, with just four applying a surtax to business income. France, Germany, Japan, and Luxembourg all apply a surtax to all or part of their corporate income tax base.[34]
The OECD data on tax revenues has a category for revenues that are unallocable to normal personal or business income taxes.[35] The data show that Chile (9.48 percent), Costa Rica (4.78 percent), Iceland (4.23 percent), Switzerland (3.93 percent), and Italy (3.92 percent) collect non-negligible shares of revenue from income (including personal income) from taxes other than corporate or personal income taxes. Seventeen OECD countries collect no revenue in that category.
Individual Taxes
Individual taxes are one of the most prevalent means of raising revenue to fund government. Individual income taxes are levied on an individual’s or household’s income (wages and, often, capital gains and dividends) to fund general government operations. These taxes are typically progressive, meaning that the rate at which an individual’s income is taxed increases as the individual earns more income.
In addition, countries have payroll taxes—also referred to as social security contributions or social insurance taxes. These typically flat-rate taxes are levied on wage income in addition to a country’s general individual income tax. However, revenue from these taxes is typically allocated specifically toward social insurance programs such as unemployment insurance, government pension programs, and health insurance.
Individual taxes can have the benefit of being some of the more transparent taxes. Taxpayers are made aware of their total amount of taxes paid at some point in the process—unlike, for example, consumption taxes, which are collected and remitted by a business, and an individual may not be aware of their total consumption tax burden.
Most countries tax individuals on their income using two approaches. First, countries tax earnings from work with ordinary income taxes and payroll taxes. The structure of these taxes can influence individuals’ decisions to work, take an additional part-time job, or whether a second earner in the household will work. Second, individuals are taxed on their savings through taxes on capital gains and dividends. In most cases, these taxes are a second layer of tax on corporate profits and can impact decisions on how much to save and invest. High taxes on capital gains and dividends can reduce the aggregate savings and investment in a country.
A country’s score for its individual income tax is determined by three subcategories: the rate and progressivity of wage taxation, income tax complexity, and the extent to which the income tax double taxes corporate income. Table 4 shows the ranks and scores for the entire Individual Taxes category as well as the rank and score for each subcategory.
Taxes on Ordinary Income
Individual income taxes are levied on the income of individuals or households. Many countries, such as the United States, rely on individual income taxes as a significant source of tax revenue.[36] They are used to raise revenue for both general government operations and for specific programs, such as social insurance and government-provided health insurance.
A country’s taxes on ordinary income are measured according to three variables: the top rate at which ordinary income is taxed, the top income tax threshold, and the economic efficiency of labor taxation.
Table 4. Individual Taxes
| Country | Overall Rank | Overall Score | Income Tax Rank | Income Tax Score | Complexity Rank | Complexity Score | Capital Gains/Dividends Rank | Capital Gains/Dividends Score |
|---|---|---|---|---|---|---|---|---|
| Australia | 15 | 68.9 | 17 | 60.6 | 1 | 100 | 20 | 60.6 |
| Austria | 25 | 58 | 36 | 41.5 | 1 | 100 | 24 | 53.6 |
| Belgium | 13 | 73 | 31 | 48.7 | 1 | 100 | 14 | 75.8 |
| Canada | 31 | 52.9 | 20 | 58 | 1 | 100 | 35 | 33.8 |
| Chile | 24 | 59.4 | 23 | 56.9 | 1 | 100 | 32 | 46.2 |
| Colombia | 14 | 69.7 | 8 | 70.9 | 31 | 80.5 | 16 | 72.8 |
| Costa Rica | 32 | 51.2 | 5 | 85.6 | 38 | 26.9 | 12 | 78.1 |
| Czech Republic | 4 | 93.9 | 3 | 94.6 | 1 | 100 | 9 | 83.2 |
| Denmark | 36 | 47.6 | 24 | 56.5 | 1 | 100 | 37 | 25.3 |
| Estonia | 2 | 99.3 | 1 | 100 | 1 | 100 | 3 | 89.3 |
| Finland | 27 | 57.3 | 29 | 51 | 1 | 100 | 31 | 46.3 |
| France | 33 | 49.9 | 37 | 38.9 | 1 | 100 | 33 | 41 |
| Germany | 35 | 48.2 | 9 | 70.6 | 34 | 56.8 | 23 | 55.8 |
| Greece | 9 | 82.2 | 27 | 54.2 | 1 | 100 | 5 | 88.6 |
| Hungary | 5 | 91.7 | 2 | 97 | 30 | 99.6 | 12 | 78.1 |
| Iceland | 20 | 61.7 | 14 | 63 | 32 | 79.7 | 19 | 64.4 |
| Ireland | 37 | 42.4 | 33 | 44.5 | 1 | 100 | 38 | 24 |
| Israel | 29 | 54.3 | 38 | 36.8 | 1 | 100 | 28 | 50.1 |
| Italy | 16 | 64.4 | 25 | 54.8 | 1 | 100 | 22 | 56.6 |
| Japan | 34 | 49 | 26 | 54.5 | 34 | 56.8 | 18 | 67.7 |
| Korea | 38 | 40.3 | 35 | 41.7 | 34 | 56.8 | 21 | 60.6 |
| Latvia | 3 | 94.5 | 4 | 86.9 | 1 | 100 | 3 | 89.3 |
| Lithuania | 10 | 81.9 | 7 | 76.5 | 1 | 100 | 15 | 73.6 |
| Luxembourg | 23 | 59.9 | 21 | 57.6 | 34 | 56.8 | 7 | 85.3 |
| Mexico | 19 | 62 | 22 | 57.1 | 33 | 66.8 | 11 | 80.3 |
| Netherlands | 30 | 53.1 | 30 | 48.9 | 1 | 100 | 34 | 40.2 |
| New Zealand | 6 | 86.5 | 15 | 61.9 | 1 | 100 | 2 | 91.3 |
| Norway | 28 | 55 | 13 | 64.5 | 1 | 100 | 36 | 33.5 |
| Poland | 11 | 76.7 | 11 | 67.5 | 1 | 100 | 17 | 70.3 |
| Portugal | 26 | 57.6 | 34 | 42 | 1 | 100 | 25 | 52.7 |
| Slovak Republic | 1 | 100 | 6 | 85.5 | 1 | 100 | 1 | 100 |
| Slovenia | 12 | 75.7 | 32 | 48.1 | 1 | 100 | 10 | 81.1 |
| Spain | 22 | 61.6 | 28 | 52.8 | 1 | 100 | 25 | 52.7 |
| Sweden | 18 | 62.2 | 16 | 61 | 29 | 99.8 | 29 | 48.8 |
| Switzerland | 8 | 83.8 | 12 | 65.6 | 1 | 100 | 8 | 84.1 |
| Turkey | 7 | 85.9 | 10 | 67.8 | 1 | 100 | 6 | 86.3 |
| United Kingdom | 21 | 61.6 | 18 | 60.2 | 1 | 100 | 30 | 47.9 |
| United States | 17 | 63 | 19 | 59.1 | 1 | 100 | 27 | 51.1 |
Top Statutory Personal Income Tax Rate
Most countries’ income tax systems have a progressive taxA progressive tax is one where the average tax burden increases with income. High-income families pay a disproportionate share of the tax burden, while low- and middle-income taxpayers shoulder a relatively small tax burden. structure. This means that, as individuals earn more income, they move into tax bracketsA tax bracket is the range of incomes taxed at given rates, which typically differ depending on filing status. In a progressive individual or corporate income tax system, rates rise as income increases. There are seven federal individual income tax brackets; the federal corporate income tax system is flat. with higher tax rates. The top statutory personal income tax rate is the top tax rate on all income over a certain level. For example, the United States has seven tax brackets, with the seventh (top) bracket taxing each additional dollar of income over $609,350 ($731,200 for married filing jointly) at a rate of 37 percent in 2024.[37] In addition, US taxpayers also pay state and local income taxes as well as Medicare contributions, which sum to a combined top personal income tax rate of 45.8 percent.[38]
Individuals consider the marginal tax rateThe marginal tax rate is the amount of additional tax paid for every additional dollar earned as income. The average tax rate is the total tax paid divided by total income earned. A 10 percent marginal tax rate means that 10 cents of every next dollar earned would be taken as tax. when deciding whether to work an additional hour. In many cases the decision will be about taking a second, part-time job or whether households with two adults will have one or two earners. If an individual faces a marginal tax rate of 30 percent on their current earnings, taking additional work or another shift would mean that only 70 percent of those earnings could be brought home.
High top personal tax rates make additional work more expensive, which lowers the relative cost of not working. This makes it more likely that an individual will choose leisure over work, maintaining current hours rather than moving to full-time work or taking an additional shift. High tax rates increase the cost of labor, which can decrease hours worked, and, in turn, can reduce the amount of production in the economy.
Countries with high top statutory personal income tax rates receive a worse score on the ITCI than countries with lower top rates. Slovenia has the highest all-in top statutory personal income tax rate (including employee social contributions) at 67.5 percent. Estonia has the lowest, at 21.6 percent.[39]
Income Level at Which Top Statutory Personal Income Tax Rate Applies
The level at which the top statutory personal income tax rate first applies is also important. If a country has a top rate of 20 percent, but almost everyone pays that rate because it applies to any income over $10,000, that country essentially has a flat income tax. In contrast, a tax system that has a top rate that applies to all income over $1 million requires a much higher top tax rate to raise the same amount of revenue, because it targets a small number of people that earn a high level of income.
Countries with top statutory personal income tax rates that apply at lower levels score better on the ITCI. The ITCI bases its measure on the income level at which the top rate first applies as compared to the country’s average income. According to this measure, Colombia applies its top tax rate at the highest level of income (the top personal income tax rate applies at 58.9 times the average Colombian income), whereas Hungary applies its top rate on the first dollar, with a flat personal income tax of 15 percent.[40]
The Economic Cost of Labor Taxation
All taxes create some economic losses; however, tax systems should be designed to minimize those losses while supporting revenue needs.
One way to examine the efficiency of labor taxation in a country is to control for the level of labor taxation using the ratio of the marginal tax wedge to the average tax wedge.[41] The marginal tax wedge influences the choice to earn another dollar of income while the average tax wedge measures the tax burden at the current income level.[42] A higher ratio means that as one earns more income, the influence of the tax system on those decisions and the related economic losses grows. A lower ratio means that an individual can decide to work more without the tax system changing their decisions.
For example, one individual faces an average tax wedge on their earnings of 20 percent and their marginal tax wedge is also 20 percent. That individual could work more hours without the relative tax burden growing. The ratio of that worker’s marginal tax wedge to their average tax wedge is 1. Another individual who faces an average tax wedge of 20 percent on their earnings and a marginal tax wedge of 30 percent, however, would have their decision of whether to work more hours influenced by the tax system. The ratio of that worker’s marginal tax wedge to their average tax wedge is 1.5.
The ITCI gives countries with high ratios a worse score due to the larger impact that those systems have on workers’ decisions.
Hungary has the lowest ratio of 1, meaning the next dollar earned faces the same tax burden as current earnings.[43] This is because Hungary has a flat income tax, so the marginal and average tax wedge are the same. In contrast, Israel’s ratio is 1.7. The average across OECD countries is 1.27.[44]
Complexity
Complexity is measured by the rate of any surtax on personal income and the amount of revenue raised through social security contributions other than those collected through employer or employee payroll taxes. These measures indicate non-standard approaches to the taxation of labor income and, in the case of surtaxes, a less transparent personal income tax system. The Index penalizes countries with surtaxes and significant revenues from non-standard employer and employee payroll taxes.
Four OECD countries levy a surtax on personal income: Germany, Japan, Korea, and Luxembourg. Germany levies a 5.5 percent solidarity surcharge on all capital gains and dividend income tax as well as income tax paid in excess of EUR 18,130, equivalent to labor income above EUR 96,409 for single filers, increasing its top marginal income tax rate from 45 percent to 47.475 percent. Japan applies a 2.1 percent surtax on all national (but not local) income tax liability.
Four OECD countries raise some meaningful share of revenue through non-standard social security contributions. In Costa Rica, these revenues make up 31.1 percent of total tax revenues. Mexico (14.1 percent), Iceland (8.6 percent), and Colombia (8.3 percent) make up the others in this group.
Capital Gains and Dividends Taxes
In addition to wage income, many countries’ individual income tax systems tax investment income by levying taxes on capital gains and dividends.
A capital gain occurs when an individual purchases an asset (usually corporate stock) in one period and sells it in another for a profit. A dividend is a payment made to an individual from after-tax corporate profits.
Capital gains taxes and personal dividend taxes are a form of double taxationDouble taxation is when taxes are paid twice on the same dollar of income, regardless of whether that’s corporate or individual income. of corporate profits that contribute to the tax burden on capital. When a corporation makes a profit, it pays corporate income tax. It can then generally do one of two things. The corporation can retain the after-tax profits, which boost the value of the business and thus its stock price. Stockholders then sell the stock and realize a capital gain, which requires them to pay tax on that income. Alternatively, the corporation can distribute the after-tax profits to shareholders in the form of dividends. Stockholders who receive dividends then pay dividends tax on that income.
A company that makes a taxable profit of $1 million and pays 20 percent in corporate income taxes would have $800,000 left to either reinvest in the company, which would boost the value of the stock, or pay a dividend. A shareholder might face an additional 20 percent tax on the gains from selling the shares or on a dividend from the company. Effectively, the system taxes the business profits at 36 percent. An individual hoping that an investment provides a 10 percent real rate of return might see only a 6.4 percent after-tax rate of return.
Some tax systems account for this potential double taxation either through credits against capital gains taxes for corporate taxes paid or other deductions. Such a tax system provides integrated taxation of corporate profits, or “corporate integration.”[45]
Apart from double taxation, taxes on dividends and capital gains can change the incentives for businesses when they are looking to finance new projects. If a business can either fund a new project by selling new shares of stock or by reinvesting its profits, the taxes on investors can influence which approach results in higher after-tax returns. Norway uses a rate of return allowance on capital gains taxes to neutralize the decision between reinvesting profits or selling new shares.[46]
Generally, higher dividends and capital gains taxes create a bias against saving and investment, reduce capital formation, and slow economic growth.[47]
In the ITCI, a country receives a better score for lower capital gains and dividends taxes.
Capital Gains TaxA capital gains tax is levied on the profit made from selling an asset and is often in addition to corporate income taxes, frequently resulting in double taxation. These taxes create a bias against saving, leading to a lower level of national income by encouraging present consumption over investment. Rates
Countries generally tax capital gains at a lower rate than ordinary income, provided that specific requirements are met. For example, the United States taxes capital gains at a reduced rate if the taxpayer holds the asset for at least one year before selling it (so-called long-term capital gains).[48] The ITCI gives countries with higher capital gains tax rates a worse score than those with lower rates.
Some countries use additional provisions to help mitigate the double taxation of income due to the capital gains tax. For instance, the United Kingdom provides an annual exemption of GBP 6,000 (USD 7,450),[49] and Canada excludes one-third of all capital gains income from taxation.[50]
Denmark has the highest capital gains tax rate in the OECD, at 42 percent. Belgium, the Czech Republic, Korea, Luxembourg, New Zealand, Slovakia, Slovenia, Switzerland, and Turkey do not tax long-term capital gains.[51]
Dividend Tax Rates
Dividend taxes can adversely impact capital formation in a country. High dividend tax rates increase the cost of capital, which deters investment and slows economic growth.
Countries’ rates are expressed as the top marginal personal dividend tax rate after any imputation or credit system.
Countries with lower overall dividend tax rates score better on the ITCI due to the dividend tax rate’s effect on the cost of investment (i.e., the cost of capital) and the more neutral treatment between saving and consumption. Ireland has the highest dividend tax rate in the OECD, at 51 percent. Estonia and Latvia have dividend tax rates of 0 percent due to their cash-flow corporate tax system, and Greece’s top dividend tax rate is 5 percent. The OECD average is 24.7 percent.[52]
Consumption Taxes
Consumption taxes are levied on individuals’ purchases of goods and services. In the OECD and most of the world, the value-added tax (VAT) is the most common general consumption tax.[53] Most general consumption taxes either do not tax intermediate business inputs or allow a credit for taxes already paid on them, making them one of the most economically efficient means of raising tax revenue.
However, many countries define their tax base inefficiently. Most countries levy reduced tax rates and exempt certain goods and services from VAT, requiring them to levy higher standard tax rates to raise sufficient revenue. Some countries fail to properly exempt business inputs. For example, states in the United States often levy sales taxes on machinery and equipment.[54]
A country’s consumption tax score is broken down into two subcategories: the tax rate and the tax base. Table 5 displays the ranks and scores for the Consumption Taxes category.
Consumption Tax Rate
If levied at the same rate and properly structured, a VAT and a retail sales taxA sales tax is levied on retail sales of goods and services and, ideally, should apply to all final consumption with few exemptions. Many governments exempt goods like groceries; base broadening, such as including groceries, could keep rates lower. A sales tax should exempt business-to-business transactions which, when taxed, cause tax pyramiding. will each raise approximately the same amount of revenue. Ideally, either a VAT or a sales tax should be levied at the standard rate on all final consumption (although they are implemented in slightly different ways). With a sufficiently broad consumption tax base, the tax rate can be relatively low. A VAT or retail sales tax with a low rate and neutral structure limits economic distortions while raising substantial revenue.
However, many countries have consumption taxes that exempt certain goods and services from VAT or tax them at a reduced rate, requiring higher standard rates to raise sufficient revenue. If not neutrally structured, high tax rates create economic distortions by discouraging the purchase of highly taxed goods and services in favor of untaxed, lower-taxed, or self-provided goods and services.
Countries with lower consumption tax rates score better than those with higher tax rates, as lower rates do less to discourage economic activity and allow for more future consumption and investment.
The average general consumption tax rate in the OECD is 19.1 percent. Hungary has the highest tax rate at 27 percent, while the United States has the lowest tax rate at 7.5 percent.[55]
Table 5. Consumption Taxes
| Country | Overall Rank | Overall Score | Rate Rank | Rate Score | Base Rank | Base Score |
|---|---|---|---|---|---|---|
| Australia | 9 | 81.4 | 3 | 89.8 | 31 | 46.9 |
| Austria | 14 | 61.9 | 15 | 49.2 | 16 | 65.3 |
| Belgium | 26 | 52 | 20 | 45.1 | 26 | 54.1 |
| Canada | 8 | 82.6 | 6 | 80.1 | 19 | 60.9 |
| Chile | 11 | 78.1 | 12 | 53.2 | 3 | 86.6 |
| Colombia | 15 | 61.8 | 12 | 53.2 | 20 | 60.1 |
| Costa Rica | 7 | 84.9 | 7 | 77.6 | 11 | 67.6 |
| Czech Republic | 32 | 41.2 | 20 | 45.1 | 34 | 36.6 |
| Denmark | 20 | 55.4 | 35 | 28.8 | 4 | 79.7 |
| Estonia | 18 | 59.6 | 26 | 41 | 9 | 71.4 |
| Finland | 24 | 52.7 | 32 | 32.9 | 10 | 70.3 |
| France | 31 | 43.1 | 15 | 49.2 | 35 | 34.7 |
| Germany | 13 | 66.3 | 12 | 53.2 | 12 | 67.4 |
| Greece | 34 | 40.7 | 32 | 32.9 | 28 | 50.8 |
| Hungary | 36 | 36.9 | 38 | 20.7 | 21 | 59.6 |
| Iceland | 29 | 48.3 | 32 | 32.9 | 17 | 63.2 |
| Ireland | 35 | 38.4 | 29 | 37 | 33 | 42.1 |
| Israel | 10 | 78.3 | 10 | 61.4 | 6 | 76.9 |
| Italy | 38 | 31.3 | 26 | 41 | 38 | 25.5 |
| Japan | 5 | 87.9 | 3 | 89.8 | 24 | 57.4 |
| Korea | 1 | 100 | 3 | 89.8 | 5 | 77.2 |
| Latvia | 21 | 54.9 | 20 | 45.1 | 22 | 58.8 |
| Lithuania | 27 | 49.8 | 20 | 45.1 | 29 | 50.6 |
| Luxembourg | 6 | 87.7 | 10 | 61.4 | 2 | 92.2 |
| Mexico | 12 | 66.6 | 9 | 65.4 | 27 | 52.9 |
| Netherlands | 17 | 59.7 | 20 | 45.1 | 13 | 66.7 |
| New Zealand | 2 | 98.6 | 8 | 69.5 | 1 | 100 |
| Norway | 25 | 52.3 | 35 | 28.8 | 8 | 74.7 |
| Poland | 37 | 33.7 | 29 | 37 | 36 | 34.4 |
| Portugal | 22 | 53.2 | 29 | 37 | 14 | 66.1 |
| Slovak Republic | 28 | 48.6 | 15 | 49.2 | 32 | 43.6 |
| Slovenia | 30 | 45.9 | 26 | 41 | 30 | 49.2 |
| Spain | 19 | 58.9 | 20 | 45.1 | 15 | 65.4 |
| Sweden | 23 | 53.1 | 35 | 28.8 | 7 | 76 |
| Switzerland | 3 | 94.2 | 2 | 97.6 | 23 | 58.2 |
| Turkey | 16 | 59.9 | 15 | 49.2 | 18 | 62 |
| United Kingdom | 33 | 40.9 | 15 | 49.2 | 37 | 31.1 |
| United States | 4 | 93.7 | 1 | 100 | 25 | 54.4 |
Consumption Tax Base
Ideally, either a VAT or a sales tax should be levied at a standard rate on all final consumption. In other words, consumption tax collections should be equal to the amount of final consumption in the economy times the rate of the sales tax or VAT. However, many countries’ consumption tax bases are far from this ideal. Many countries exempt certain goods and services from the VAT or tax them at a reduced rate, requiring a higher standard rate than would otherwise be necessary, or apply the tax to business inputs, increasing the cost of capital.
VAT/Sales Tax ExemptionA tax exemption excludes certain income, revenue, or even taxpayers from tax altogether. For example, nonprofits that fulfill certain requirements are granted tax-exempt status by the Internal Revenue Service (IRS), preventing them from having to pay income tax. Threshold
Most OECD countries set exemption thresholds for their VATs/sales taxes. If a business is below a certain annual revenue threshold, it is not required to participate in the VAT system. This means that small businesses—unlike businesses above that threshold—do not collect VAT on their outputs sold to customers but also cannot receive a refund for VAT paid on business inputs.[56] Although exempting very small businesses saves administrative and compliance costs, unnecessarily large thresholds create a distortion by favoring smaller businesses over larger ones.
Countries receive better scores for lower thresholds. The Czech Republic receives the worst threshold score with a VAT threshold of $155,039.[57] Seven countries receive the best scores for having no general VAT/sales tax exemption threshold (Chile, Colombia, Costa Rica, Mexico, Spain, Turkey, and the United States). The average across the OECD countries that have a VAT threshold is approximately $62,000.[58]
Consumption Tax Base as a Percent of Total Consumption
One way to measure a country’s VAT base is the VAT revenue ratio. This ratio looks at the difference between the VAT revenue actually collected and collectible VAT revenue under a VAT that was applied at the standard rate on all final consumption. The difference in actual and potential VAT revenues is due to 1) policy choices to exempt certain goods and services from VAT or tax them at a reduced rate, and 2) lacking VAT compliance.[59]
For example, if final consumption in a country is $100 and a country levies a 10 percent VAT on all goods and services, a pure base would raise $10. Revenue collection below $10 reflects either a high number of exemptions or reduced rates built into the tax code or low levels of compliance (or both). The base is measured as a ratio of the pure base collections to the actual collections. Countries with tax base ratios near 1—signifying a pure tax base—score better.
Under this measure, New Zealand has the broadest tax base covering approximately 100 percent of total consumption. Luxembourg and Korea follow with ratios of 0.91 and 0.79, respectively. Mexico (0.33), the United States (0.35), and Greece (0.37) have the worst ratios. The OECD average tax base ratio is 0.58.[60]
Property Taxes
Property taxes are government levies on the assets of an individual or business. The methods and intervals of collection vary widely among the types of property taxes. Estate and inheritance taxes, for example, are due upon the death of an individual and the passing of his or her estate to an heir, respectively. Taxes on real property, on the other hand, are paid at set intervals–often annually–on the value of taxable property such as land and real estate.
Many types of property taxes are highly distortive and add significant complexity for taxpayers. Estate and inheritance taxes create disincentives against additional work and saving, which damages productivity and output. Financial transaction taxes increase the cost of capital, which limits the flow of investment capital to its most efficient allocations.[61] Taxes on wealth limit the capital available in the economy, which damages long-term economic growth and innovation.[62]
Sound tax policy minimizes economic distortions. Except for taxes on land, most property taxes increase economic distortions and have long-term negative effects on the economy and its productivity.
Table 6 shows the ranks and scores for the Property Taxes category and each of its subcategories, which are real property taxes, wealth and estate taxes, and capital and transaction taxes.
Real Property Taxes
Real property taxes are levied on a recurrent basis on taxable property. For example, in most states or municipalities in the United States, businesses and individuals pay a property tax based on the value of their real property.
Structure of Property Taxes
Although taxes on real property are generally an efficient way to raise revenue, some real property taxes can become direct taxes on capital. This occurs when a tax applies to more than just the value of the land itself, such as the buildings or structures on the land. This increases the cost of capital, discourages the formation of capital (such as the building of structures), and can negatively impact business location decisions.
When a business wants to improve its property through renovations or expanding a factory, a property tax that applies to both the land and those improvements directly increases the costs of those improvements. However, a tax that just applies to the value of the land would usually not create an incentive against property improvements.
Countries that tax the value of structures and buildings as well as land receive the worst scores on the ITCI. Some countries mitigate this treatment with a deduction for property taxes paid against corporate taxable income. These countries receive slightly better scores. Countries receive the best possible score if they have either no property tax or only tax land.
Table 6. Property Taxes
| Country | Overall Rank | Overall Score | Real Property Taxes Rank | Real Property Taxes Score | Wealth/Estate Taxes Rank | Wealth/Estate Taxes Score | Capital/Transaction Taxes Rank | Capital/Transaction Taxes Score |
|---|---|---|---|---|---|---|---|---|
| Australia | 4 | 79.4 | 2 | 82.6 | 1 | 100 | 14 | 63.9 |
| Austria | 16 | 62.8 | 30 | 47.2 | 1 | 100 | 14 | 63.9 |
| Belgium | 29 | 44.8 | 23 | 61.8 | 33 | 49.1 | 24 | 48.1 |
| Canada | 25 | 53.3 | 33 | 39.6 | 1 | 100 | 29 | 46.6 |
| Chile | 13 | 66.4 | 20 | 63.6 | 12 | 70.4 | 5 | 84.8 |
| Colombia | 35 | 36.9 | 21 | 63.6 | 36 | 27.8 | 32 | 46.1 |
| Costa Rica | 11 | 68 | 12 | 69.9 | 1 | 100 | 24 | 48.1 |
| Czech Republic | 6 | 76.4 | 5 | 73.7 | 12 | 70.4 | 1 | 100 |
| Denmark | 17 | 62.3 | 24 | 58.9 | 12 | 70.4 | 7 | 79.1 |
| Estonia | 1 | 100 | 1 | 100 | 1 | 100 | 1 | 100 |
| Finland | 19 | 60.8 | 16 | 67.2 | 12 | 70.4 | 22 | 63.4 |
| France | 31 | 41 | 27 | 53.6 | 33 | 49.1 | 24 | 48.1 |
| Germany | 12 | 68 | 9 | 71.1 | 12 | 70.4 | 7 | 79.1 |
| Greece | 27 | 47.1 | 28 | 50.4 | 12 | 70.4 | 29 | 46.6 |
| Hungary | 23 | 57 | 11 | 70.3 | 12 | 70.4 | 24 | 48.1 |
| Iceland | 33 | 40 | 38 | 22.6 | 12 | 70.4 | 14 | 63.9 |
| Ireland | 18 | 61.8 | 14 | 69.4 | 12 | 70.4 | 22 | 63.4 |
| Israel | 10 | 68.2 | 29 | 47.5 | 1 | 100 | 7 | 79.1 |
| Italy | 38 | 31.8 | 35 | 35.5 | 33 | 49.1 | 32 | 46.1 |
| Japan | 26 | 50 | 25 | 56.6 | 12 | 70.4 | 29 | 46.6 |
| Korea | 32 | 40.6 | 34 | 36.9 | 12 | 70.4 | 32 | 46.1 |
| Latvia | 5 | 77.2 | 17 | 66.6 | 1 | 100 | 7 | 79.1 |
| Lithuania | 7 | 74.8 | 10 | 70.3 | 12 | 70.4 | 1 | 100 |
| Luxembourg | 14 | 64.5 | 3 | 74.8 | 12 | 70.4 | 14 | 63.9 |
| Mexico | 3 | 80.4 | 6 | 73.5 | 1 | 100 | 7 | 79.1 |
| Netherlands | 21 | 59.6 | 19 | 64.4 | 12 | 70.4 | 14 | 63.9 |
| New Zealand | 8 | 74.4 | 31 | 45.4 | 1 | 100 | 1 | 100 |
| Norway | 15 | 63.1 | 8 | 71.2 | 32 | 57.4 | 7 | 79.1 |
| Poland | 30 | 43.6 | 26 | 54.5 | 12 | 70.4 | 37 | 30.8 |
| Portugal | 20 | 60.7 | 18 | 66.6 | 12 | 70.4 | 14 | 63.9 |
| Slovak Republic | 2 | 80.5 | 13 | 69.7 | 1 | 100 | 5 | 84.8 |
| Slovenia | 24 | 54.8 | 32 | 42.9 | 12 | 70.4 | 7 | 79.1 |
| Spain | 37 | 36.5 | 22 | 62.8 | 36 | 27.8 | 32 | 46.1 |
| Sweden | 9 | 72.6 | 15 | 68 | 1 | 100 | 14 | 63.9 |
| Switzerland | 36 | 36.6 | 4 | 74 | 36 | 27.8 | 37 | 30.8 |
| Turkey | 22 | 57.3 | 7 | 72.5 | 12 | 70.4 | 32 | 46.1 |
| United Kingdom | 34 | 39 | 37 | 32 | 12 | 70.4 | 24 | 48.1 |
| United States | 28 | 45.9 | 36 | 35 | 12 | 70.4 | 14 | 63.9 |
Every OECD country except Australia and Estonia applies its property tax to all capital (land and buildings/structures).[63] These two countries only tax the value of land, which excludes the value of any buildings or structures on the land. Of the 36 OECD countries with taxes on all capital, 30 allow for a deduction against corporate taxable income.[64]
Real Property Tax Collections
The variable “property tax collections” measures property tax revenues as a percent of a country’s private capital stock. Higher tax burdens, specifically when on capital, tend to slow investment, which damages productivity and economic growth.
Countries with a high level of collections as a percent of their capital stock place a larger tax burden on taxpayers and receive a worse score on the ITCI. Seven countries in the OECD have property tax collections that are greater than 1 percent of the private capital stock. Leading this group are the United States (1.9 percent), the United Kingdom (1.8 percent), and Canada (1.6 percent). Austria, the Czech Republic, Luxembourg, and Switzerland have a real property tax burden of below 0.1 percent of the private capital stock.[65]
Wealth and Estate Taxes
Many countries also levy property taxes on an individual’s wealth. These taxes can take the form of estate or inheritance taxes that are levied either upon an individual’s estate at death or upon the assets transferred from the decedent’s estate to the heirs. These taxes can also take the form of a recurring tax on an individual’s wealth. Estate and inheritance taxes limit resources available for investment or production and reduce the incentive to save and invest.[66] This reduction in investment adversely affects economic growth. Moreover, these taxes, the estate and inheritance taxAn inheritance tax is levied upon the value of inherited assets received by a beneficiary after a decedent’s death. Not to be confused with estate taxes, which are paid by the decedent’s estate based on the size of the total estate before assets are distributed, inheritance taxes are paid by the recipient or heir based on the value of the bequest received. especially, can be avoided with certain planning techniques, which makes the tax an inefficient and unnecessarily complex source of revenue.
Wealth Taxes
In addition to estate and inheritance taxes, some countries levy wealth taxes. Wealth taxes are often low-rate, progressive taxes on an individual’s or family’s assets or the assets of a corporation. Unlike estate taxes, wealth taxes are levied on an annual basis. While some countries levy a comprehensive tax on net wealth, others limit their wealth taxes to selected assets, such as security accounts, financial assets held abroad, or real estate.
Four countries levy net wealth taxes, namely Colombia, Norway, Spain, and Switzerland. Belgium, France, and Italy impose wealth taxes on selected assets. Countries with no type of wealth tax receive the best score, countries with wealth taxes on selected assets receive an average score, and countries with net wealth taxes receive the lowest score.[67]
Estate, Inheritance, and Gift Taxes
Estate taxes are levied on the value of an individual’s taxable estate at the time of death and are paid by the estate itself, while inheritance taxes are levied on the value of assets transferred to an individual’s heirs upon death and are paid by the heirs (not the estate of the deceased individual). Gift taxes are taxes on the transfer of property (cash, stocks, and other property) that are typically used to prevent individuals from circumventing estate and inheritance taxes by gifting away their assets before death.
Rates, exemption levels, and rules vary substantially among countries. For example, the United States levies a top rate of 40 percent on estates but has an exemption level of $12.92 million. Belgium’s Brussels capital region, on the other hand, has an inheritance tax with an exemption of EUR 15,000 (USD 16,250)[68] and a variety of tax rates depending on who receives assets from the estate and what the assets are.[69]
Estate, inheritance, and gift taxes create significant compliance costs for taxpayers while raising insignificant amounts of revenue. According to OECD data for 2022, estate, inheritance, and gift taxes across the OECD raised an average of 0.15 percent of GDP in tax revenue, with the highest amount raised being only 0.7 percent of GDP in France, despite France’s top inheritance tax rate of up to 60 percent in some cases.[70]
Countries without these taxes score better than countries that have them. Twelve countries in the OECD have no estate, inheritance, or gift taxes: Australia, Austria, Canada, Costa Rica, Estonia, Israel, Latvia, Mexico, New Zealand, Norway, Slovakia, and Sweden. All others levy an estate, inheritance, or gift taxA gift tax is a tax on the transfer of property by a living individual, without payment or a valuable exchange in return. The donor, not the recipient of the gift, is typically liable for the tax. .[71]
Capital, Wealth, and Property Taxes on Businesses
There are various taxes countries levy on the assets and fixed capital of businesses. These include taxes on the transfer of real property, taxes on the net assets of businesses, taxes on raising capital, and taxes on financial transactions. These taxes contribute directly to the cost of capital for businesses and reduce the after-tax rate of return on investment.
Property Transfer Taxes
Property transfer taxes are taxes on the transfer of real property (real estate, land improvements, machinery) from one person or firm to another. A common example in the United States is the real estate transfer tax, which is commonly levied at the state level on the value of homes that are purchased by individuals.[72] Property transfer taxes represent a direct tax on capital and increase the cost of purchasing property.
Countries receive a worse score if they have property transfer taxes. Six OECD countries do not have property transfer taxes: Chile, the Czech Republic, Estonia, Lithuania, New Zealand, and Slovakia.[73]
Corporate Asset Taxes
Similar to wealth taxes, asset taxes are levied on the wealth, or assets, of a business. For instance, Luxembourg levies a 0.5 percent tax on the worldwide net wealth of nontransparent Luxembourg-based companies every year.[74] Similarly, cantons in Switzerland levy taxes on the net assets of corporations, varying from 0.001 percent to 0.5 percent of corporate net assets.[75] Other countries levy these taxes exclusively on bank assets.
Twenty OECD countries have some type of corporate wealth or asset tax. Fourteen of these countries have bank taxes of some type.[76]
Capital Duties
Capital duties are taxes on the issuance of shares of stock. Typically, countries either levy these taxes at very low rates or require a small, flat fee. For example, Switzerland requires resident companies to pay a 1 percent tax on the issuance of shares of stock.[77] These types of taxes increase the cost of capital, limit funds available for investment, and make it more difficult to form businesses.[78]
Countries with capital duties score worse than countries without them. Ten countries in the OECD levy some type of capital duty.[79]
Financial Transaction Taxes
A financial transaction tax is a levy on the sale or transfer of a financial asset. Financial transaction taxes take different forms in different countries. Finland levies a tax of 1.6 percent on the transfer of Finnish securities. On the other hand, Poland levies a 1 percent stamp duty on exchanges of property rights based on the transaction value. For transactions on a stock exchange, the tax is the responsibility of the buyer.[80]
Financial transaction taxes impose an additional layer of taxation on the purchase or sale of stocks. Markets run on efficiency, and capital needs to flow quickly to its most economically productive use. A financial transaction tax impedes this process.[81]
The ITCI ranks countries with financial transaction taxes worse than countries without them. Fourteen countries in the OECD have financial transaction taxes, including France and the United Kingdom, while 24 countries do not impose financial transaction taxes.[82]
Cross-Border Tax Rules
In an increasingly globalized economy, businesses often expand beyond the borders of their home countries to reach customers and build supply chains around the world. Countries have defined rules that determine how, or if, corporate income earned in foreign countries is taxed domestically. Cross-border tax rules comprise the systems and regulations that countries apply to those business activities.
There has been a growing trend of moving from worldwide taxation toward a system of territorial taxation, in which a country’s corporate tax is limited to profits earned within its borders.[83] In a pure territorial tax system, corporations only pay taxes to the country in which they earn income. Since the 1990s, the number of OECD countries with worldwide tax systems has dropped from more than 20 to a handful.[84]
As part of the Tax Cuts and Jobs Act in December 2017, the United States adopted a hybrid international tax system. Foreign-sourced dividends are now exempt from domestic taxation, but base erosion rules are now stronger and more complex.[85]
The new US system has three pieces: global intangible low-tax income (GILTI), foreign-derived intangible income (FDII), and the base erosion and anti-abuse tax (BEAT). GILTI liability is effectively a 10.5 percent minimum tax on supra-normal returns derived from certain foreign investments earned by US companies. FDII is designed to be a reduced rate on exports of US companies connected to intellectual property located in the US. Effectively, FDII earnings are taxed at 13.125 percent. Paired together, GILTI and FDII create a worldwide tax on intangible income.
The BEAT is designed as a 10 percent minimum tax (initially 5 percent in 2018) on US-based multinationals with gross receipts of $500 million or more. The tax applies to payments by those large multinationals if payments to CFCs exceed 3 percent (2 percent for certain financial firms) of total deductions taken by a corporation.
The proposal for a global minimum tax is dramatically changing the landscape for cross-border tax rules.[86] Many OECD countries are proceeding to implement the global minimum tax rules. As of July 2024, 23 OECD countries have adopted an income-inclusion rule under Pillar Two. Fourteen countries have not adopted an IIR yet. No OECD countries have so far adopted an undertaxed-profits rule (UTPR), similar to BEAT in the US.[87] However, most EU countries and some others plan to implement the UTPR in 2025.
Table 7 displays the overall rank and score for the Cross-Border Tax Rules category as well as the ranks and scores for the subcategories—which include a category for dividends and capital gains exemptions (territoriality), withholdingWithholding is the income an employer takes out of an employee’s paycheck and remits to the federal, state, and/or local government. It is calculated based on the amount of income earned, the taxpayer’s filing status, the number of allowances claimed, and any additional amount the employee requests. taxes, tax treaties, and anti-tax avoidance rules.
Territoriality
Under a territorial tax system, multinational businesses pay taxes to the countries in which they earn their income. This means that territorial tax regimes do not generally tax corporate income companies earn in foreign countries. A worldwide tax systemA worldwide tax system for corporations, as opposed to a territorial tax system, includes foreign-earned income in the domestic tax base. As part of the 2017 Tax Cuts and Jobs Act (TCJA), the United States shifted from worldwide taxation towards territorial taxation. —such as the system previously employed by the United States—requires companies to pay taxes on worldwide income, regardless of where it is earned. Several countries—as is now the case in the US—operate some sort of hybrid system.
Countries enact territorial tax systems through so-called “participation exemptions,” which include full or partial exemptions for foreign-earned dividend or capital gains income (or both). Participation exemptions eliminate the additional domestic tax on foreign income by allowing companies to ignore—some or all—foreign income when calculating their taxable income. A pure territorial system fully exempts foreign-sourced dividend and capital gains income.
Companies based in countries with worldwide tax systems are at a competitive disadvantage because they face potentially higher levels of taxation than their competitors based in countries with territorial tax systems. Additionally, taxes on repatriated corporate income in a company’s home country increase complexity and discourage investment and production.[88]
The territoriality of a tax system is measured by the degree to which a country exempts foreign-sourced income through dividend and capital gains exemptions.
Table 7. Cross-Border Tax Rules
| Country | Overall Rank | Overall Score | Div/Cap Gains Exemption Rank | Div/Cap Gains Exemption Score | Withholding Taxes Rank | Withholding Taxes Score | Tax Treaties Rank | Tax Treaties Score | Anti-Tax Avoidance Rank | Anti-Tax Avoidance Score |
|---|---|---|---|---|---|---|---|---|---|---|
| Australia | 33 | 58.7 | 1 | 100 | 29 | 40.5 | 33 | 44.7 | 15 | 45 |
| Austria | 15 | 74.7 | 1 | 100 | 16 | 58.8 | 12 | 72.7 | 32 | 27.7 |
| Belgium | 24 | 64.7 | 1 | 100 | 37 | 25.6 | 8 | 76.6 | 32 | 27.7 |
| Canada | 19 | 70.3 | 32 | 65.9 | 32 | 38 | 7 | 77.2 | 6 | 63.9 |
| Chile | 38 | 37.3 | 38 | 28 | 36 | 30.7 | 36 | 38.8 | 5 | 72.5 |
| Colombia | 37 | 39.2 | 36 | 46.3 | 21 | 50.4 | 37 | 23.2 | 6 | 63.9 |
| Costa Rica | 28 | 60.6 | 1 | 100 | 18 | 54 | 38 | 17.3 | 4 | 79.6 |
| Czech Republic | 11 | 78.6 | 16 | 81.6 | 13 | 62.8 | 5 | 77.9 | 15 | 45 |
| Denmark | 32 | 59.1 | 16 | 81.6 | 26 | 45.4 | 20 | 64.2 | 32 | 27.7 |
| Estonia | 9 | 82.5 | 16 | 81.6 | 3 | 91.2 | 26 | 55.1 | 10 | 62.3 |
| Finland | 22 | 66.3 | 16 | 81.6 | 11 | 65.3 | 20 | 64.2 | 32 | 27.7 |
| France | 13 | 77.8 | 28 | 77.3 | 17 | 56.6 | 2 | 94.1 | 32 | 27.7 |
| Germany | 8 | 83.4 | 15 | 97.3 | 12 | 63.5 | 8 | 76.6 | 15 | 45 |
| Greece | 21 | 66.5 | 16 | 81.6 | 10 | 67 | 31 | 52.5 | 15 | 45 |
| Hungary | 3 | 93.7 | 1 | 100 | 1 | 100 | 17 | 69.4 | 15 | 45 |
| Iceland | 27 | 62.9 | 1 | 100 | 19 | 53 | 34 | 44 | 24 | 45 |
| Ireland | 34 | 54.4 | 35 | 51.4 | 25 | 46.1 | 22 | 62.9 | 15 | 45 |
| Israel | 10 | 80.8 | 1 | 100 | 34 | 36.9 | 28 | 53.8 | 1 | 100 |
| Italy | 25 | 64.5 | 26 | 78.9 | 31 | 38.6 | 4 | 80.5 | 32 | 27.7 |
| Japan | 29 | 60.6 | 30 | 75.1 | 23 | 49.3 | 22 | 62.9 | 26 | 36.3 |
| Korea | 30 | 60 | 34 | 56.7 | 26 | 45.4 | 11 | 75.9 | 26 | 36.3 |
| Latvia | 7 | 85.7 | 16 | 81.6 | 1 | 100 | 26 | 55.1 | 10 | 62.3 |
| Lithuania | 16 | 73.4 | 16 | 81.6 | 8 | 70.9 | 32 | 51.8 | 10 | 62.3 |
| Luxembourg | 5 | 90.4 | 1 | 100 | 4 | 87.1 | 13 | 72 | 15 | 45 |
| Mexico | 36 | 43.3 | 36 | 46.3 | 35 | 34.7 | 30 | 53.1 | 24 | 45 |
| Netherlands | 4 | 93.6 | 1 | 100 | 4 | 87.1 | 5 | 77.9 | 15 | 45 |
| New Zealand | 17 | 72.2 | 1 | 100 | 22 | 49.9 | 35 | 40.8 | 3 | 81.1 |
| Norway | 14 | 77.6 | 25 | 80.7 | 6 | 78.5 | 15 | 71.4 | 26 | 36.3 |
| Poland | 23 | 66 | 33 | 58.2 | 20 | 51.2 | 15 | 71.4 | 13 | 53.6 |
| Portugal | 31 | 60 | 16 | 81.6 | 32 | 38 | 19 | 65.5 | 26 | 36.3 |
| Slovak Republic | 26 | 63.8 | 16 | 81.6 | 30 | 39.1 | 24 | 60.9 | 13 | 53.6 |
| Slovenia | 20 | 67.4 | 31 | 67.8 | 13 | 62.8 | 28 | 53.8 | 6 | 63.9 |
| Spain | 18 | 71.8 | 26 | 78.9 | 24 | 48.5 | 8 | 76.6 | 15 | 45 |
| Sweden | 12 | 78.2 | 1 | 100 | 7 | 74.2 | 18 | 68.7 | 32 | 27.7 |
| Switzerland | 1 | 100 | 1 | 100 | 28 | 43.8 | 3 | 85.7 | 2 | 98.4 |
| Turkey | 6 | 87.7 | 1 | 100 | 15 | 62.1 | 13 | 72 | 6 | 63.9 |
| United Kingdom | 2 | 95.5 | 1 | 100 | 9 | 67.6 | 1 | 100 | 26 | 36.3 |
| United States | 35 | 46.7 | 29 | 76.6 | 37 | 25.6 | 25 | 57.7 | 31 | 27.7 |
Dividends Received Exemption
When a foreign subsidiary of a parent company earns income, it pays corporate income tax to the country in which it does business. After paying the tax, the subsidiary can either reinvest its profits into ongoing activities (by purchasing equipment or hiring more workers, for example) or it can distribute its profits back to the parent company in the form of dividends.
Under a worldwide tax system, the dividends received by a parent company are taxed again by the parent company’s home country, minus a tax credit for taxes already paid on that income. Under a pure territorial system, those dividends are exempt from taxation in the parent’s country.
Countries receive a score based on the level of dividend exemption they provide. Countries with no dividend exemption (worldwide tax systems) receive the worst score.
Twenty-six OECD countries exempt all foreign-sourced dividends received by parent companies from domestic taxation. Eight countries allow 95 percent or 97 percent of foreign-sourced dividends to be exempt from domestic taxation. Four OECD countries have a worldwide or hybrid tax system that generally does not exempt foreign-sourced dividends from domestic taxation.[89]
Branch or Subsidiary Capital Gains Exclusion
Another feature of an international tax system is its treatment of capital gains earned through foreign investments. When a parent company invests in a foreign subsidiary (i.e., purchases shares in a foreign subsidiary), it can realize a capital gain on that investment if it later divests the asset. A territorial tax system would exempt these gains from domestic taxation, as they are derived from overseas activity.
Taxing foreign-sourced capital gains income at domestic tax rates can discourage saving and investment.
Countries that exempt foreign-sourced capital gains from domestic taxation receive a better score on the ITCI. Foreign-sourced capital gains are fully excluded from domestic taxation in 25 OECD countries. Six countries partially exclude foreign-sourced capital gains. Seven countries do not exclude foreign-sourced capital gains income from domestic taxation.[90]
Restrictions on Eligible Countries
An ideal territorial system would only concern itself with the profits earned within the home country’s borders. However, many countries have restrictions on their territorial systems that determine when a business’ dividends or capital gains received from foreign subsidiaries are exempt from domestic tax.
Some countries treat foreign corporate income differently depending on the country in which the foreign income was earned. For example, several countries restrict their territorial systems based on a “blacklist” of countries that do not follow certain requirements. Among EU countries, it is common to restrict the participation exemption to member states of the European Economic Area.
The eligibility rules create additional complexity for companies and are often established in an arbitrary manner. Portugal, for instance, limits exemptions for foreign-sourced dividends and capital gains to those earned in countries that are not listed as a tax haven and that impose an income tax listed in the EU parent-subsidiary directive or have an income tax equal to at least 60 percent of the Portuguese corporate tax rate.[91] Italy, which normally allows a 95 percent tax exemption for foreign-sourced dividends paid to Italian shareholders, does not allow the exemption if the income was earned in a subsidiary located in a blacklisted country, unless evidence that an adequate level of taxation was borne by the foreign entity can be provided.[92]
In the OECD, 20 of 35 countries that provide participation exemptions place restrictions on whether they exempt foreign-sourced income from domestic taxation based on the source country of the income.[93] Countries that have these restrictions on their territorial tax systems receive a worse score on the ITCI.
Withholding Taxes
When firms pay dividends, interest, and royalties to foreign investors or businesses, governments often require those firms to withhold a certain portion to pay as tax. For example, the United States requires businesses to withhold a maximum 30 percent tax on dividends, interest, and royalty payments to foreign individuals unless a tax treaty provides otherwise.
These taxes make investment more costly both for investors, who will receive a lower return on dividends, and for firms, that must pay a higher amount in interest or royalty payments to compensate for the cost of the withholding taxes. These taxes also reduce funds available for investment and production and increase the cost of capital.
Countries with higher withholding tax rates on dividends, interest, and royalties score worse in the ITCI. Dividends, interest, and royalties from these countries do not always face the same tax rate as when distributed to domestic shareholders. Tax treaties between countries either reduce or eliminate withholding taxes.
Chile and Switzerland levy the highest dividend and interest withholding rates, requiring firms to withhold 35 percent of a dividend or interest payment paid to foreign entities or persons. Meanwhile, Estonia, Hungary, and Latvia do not levy withholding taxes on dividends or interest payments.
For royalties, Mexico requires firms to retain the highest amount, at 35 percent, followed by Australia, Belgium, and the United States, at 30 percent. Hungary, Latvia, Luxembourg, the Netherlands, Norway, Sweden, and Switzerland do not require companies to retain any amount of royalties for withholding tax purposes.[94]
Tax Treaty Network
Tax treaties align many tax laws between two countries and attempt to reduce double taxation, particularly by reducing or eliminating withholding taxes between the countries. Countries with a greater number of partners in their tax treaty network have more attractive tax regimes for foreign investment and receive a better score than countries with fewer treaties.
The United Kingdom has the broadest network of tax treaties (131 countries) and thus receives the best score. Costa Rica receives the worst score, with a treaty network of only four countries. Across the OECD, the average size of a tax treaty network is 75 countries.[95]
Anti-Avoidance Rules
Anti-avoidance rules seek to prevent corporations from minimizing their tax liability through aggressive tax planning. These rules can take several forms, such as rules for controlled foreign corporations (CFC rules), thin capitalization rules, and diverted profits taxes.
Anti-avoidance rules can have the effect of making countries with uncompetitive tax structures even less competitive, as these rules can add significant complexity.[96]
Controlled Foreign Corporation (CFC) Rules
CFC rules are intended to prevent corporations from shifting their pretax profits from a high-tax country to a low-tax country by using highly mobile forms of income. CFC rules are generally applied in multiple steps. First, they determine whether a foreign subsidiary is deemed a “controlled foreign corporation” for tax purposes. Second, if a foreign entity is deemed “controlled,” there is an applicability test to determine whether the CFC rules apply—generally through an income test, a predefined minimum tax rate, or a black/white list for countries. Third, if both tests are passed, the CFC rules subject the foreign corporation’s passive income (rent, royalties, interest) and sometimes active income to the tax rate of the home country of the subsidiary’s parent corporation.
CFC rules vary widely among countries. The definition of what constitutes “control” is a somewhat arbitrary decision that often increases tax code complexity. For instance, the Subpart F rules in the United States define a subsidiary with 50 percent US ownership to be controlled, while Australia considers a foreign company that is 50 percent owned by five or fewer Australian residents, or 40 percent owned by one Australian resident, to be controlled.[97]
In 2016, an EU directive established that all EU member states tax certain multinational, non-distributed income of CFCs if the parent company located in that member state owns more than 50 percent of the shares of the CFC, and if the tax paid by the CFC is lower than the difference between the tax paid by the CFC if it had been situated in the member state and the tax it actually paid.[98] All EU member states have adopted CFC rules.[99]
Each country’s score in this subcomponent is based on three aspects of CFC rules: 1) whether there are CFC rules, 2) whether CFC rules apply to passive income or all income, and 3) whether there are exemptions from the general CFC rules. Countries receive the best score if they do not have CFC rules. Countries with CFC rules that have exemptions or only apply to passive income or income associated with non-genuine arrangements receive a better score. Countries score the worst if they have CFC rules that apply to all income and have no exemptions.
CFC rules exist in 36 of the 38 OECD countries, with Costa Rica and Switzerland being the only exceptions. In four of the 36 countries with CFC rules the rules capture both active and passive income, while in 13 countries the rules have a threshold for treating all income as passive income. In the remaining 21 countries with CFC rules, they only apply to passive income or income associated with non-genuine arrangements.[100]
Interest Deduction Limitations
Many countries limit the amount of interest expenses a multinational corporation, or one of its subsidiaries, can deduct for tax purposes. Low-tax countries create an incentive for companies to finance their investments with equity, while high-tax countries create an incentive for companies to finance investments with debt and use interest deductions to reduce their tax liabilities. To prevent businesses from lending money internally from entities in low-tax jurisdictions to entities in high-tax jurisdictions for tax purposes, most countries limit the amount companies can deduct in interest.
Interest deduction limitations can vary widely among countries, and there is much discretion available to governments in enforcing these laws.[101] Some countries limit interest deductions by applying transfer pricing regulations to interest rates. Others apply what are called “thin capitalization rules,” which limit the amount of deductible interest. The two most common types used in practice are “safe harbor rules” and “earnings stripping rules.”
Safe harbor rules restrict the amount of debt for which interest is tax-deductible by defining a debt-to-equity ratio. Interest paid on debt exceeding this set ratio is not tax-deductible. Earnings stripping rules limit the tax-deductible share of debt interest to pretax earnings.
Interest deduction rules, particularly thin capitalization rules, have been shown to reduce the value of firms and distort firm decisions about how to invest in capital.[102] While interest deduction limitations can be seen as a way to address the debt bias inherent to most corporate tax systems, limiting the tax deductibility of interest expenses creates new distortions if interest income continues to be fully taxed.[103]
Countries that limit interest deductions with only transfer pricing regulations receive the best score. Countries with debt-to-equity ratios receive an average score, and countries with interest-to-pretax-earning limits receive the worst score.
Interest deduction limitations are found in 37 of the 38 countries measured in the ITCI. For instance, Canada limits interest deductions if a firm’s debt-to-equity ratio reaches 1.5 to 1, while Slovenia limits deductions at a 4 to 1 ratio. Germany and Spain limit interest deductions (regardless of whether they are for cross-border loans) to 30 percent of operating income. Israel has no established limitations on interest deductions and relies on transfer pricing rules.[104]
Global Minimum Tax
There has been a strong movement towards taxing large multinational enterprises based on their global accounting profits. The proposal for a global minimum tax will dramatically change the landscape for cross-border tax rules. Many OECD countries are proceeding to implement the global minimum tax rules.[105] These contain three main components: 1) a QDMTT, 2) an IIR, and 3) a UTPR. The minimum tax rules are risky, because they define the corporate tax base in a way that is less than ideal, favoring non-refundable tax credits and incentivizing subsidy races detrimental to global trade, while not properly accounting for features of a tax base, such as full expensing.
Over 140 jurisdictions signed on to the global minimum tax deal. In 2024, many countries have implemented legislation for IIR and UTPR, with the European Union directive mandating the adoption of both of these rules. Outside of Europe, adoption is more hesitant. Inside the European Union, Estonia and Latvia opted for a six-year deferral of the global minimum tax rules to adapt them to their distribution-based tax systems.
In the United States, GILTI and BEAT are similar to the Pillar Two IIR and UTPR. GILTI is effectively a 10.5 percent minimum tax on supra-normal returns derived from certain foreign investments earned by US companies. The BEAT is designed as a 10 percent minimum tax (initially 5 percent in 2018) on US-based multinationals with gross receipts of $500 million or more. The tax applies to payments by those large multinationals if payments to CFCs exceed 3 percent (2 percent for certain financial firms) of total deductions taken by a corporation.
The new global minimum tax variable indicates if a country levies a minimum tax on resident companies global income and taxes its worldwide income. It takes the value 0.5 for having an IIR, and the value of 1 for having both an IIR and a UTPR. For the United States, it absorbs the similar provisions of GILTI and BEAT. Previously, the CFC rules variable contained an indicator for the global minimum tax. Countries adopting global minimum tax rules are rated worse.
General Anti-Tax Avoidance Rules
Many countries apply general anti-tax avoidance rules to tax multinational companies with business structures designed specifically for tax advantages rather than economic reasons. These rules often follow the substance over form principle in determining how profits should be taxed.
As mentioned above, the BEAT in the new US tax law is a minimum tax designed to prevent multinationals from shifting profits outside the US to foreign-affiliated corporations.
Australia and the United Kingdom both apply a diverted profits tax. A diverted profits tax is a set of complex rules and penalty rates that apply if a company is found to have minimized its tax burden through a structure without economic substance. Australia applies a rate of 40 percent to diverted profits while the United Kingdom applies a 25 percent rate, though companies in certain industries can face higher rates in the UK.[106] These complex tax regimes result in high compliance costs for multinational companies as well as double taxation of some corporate profits.
Anti-abuse provisions of this nature are not currently accounted for in the Index. However, if they were appropriately accounted for, countries like Australia, the United Kingdom, and the United States would likely receive worse scores on their cross-border tax rules—potentially also impacting their overall ranking on the Index.
Country Profiles
Australia
| Overall Rank | Overall Score | Corporate Tax Rank | Individual Taxes Rank | Consumption Taxes Rank | Property Taxes Rank | Cross-Border Tax Rules Rank |
|---|---|---|---|---|---|---|
| 13 | 72.5 | 32 | 15 | 9 | 4 | 33 |
Australia ranks 13th overall on the 2024 International Tax Competitiveness Index, the same as in 2023.
Some strengths of the Australian tax system:
- Property taxes in Australia are assessed on the value of the land rather than real estate or other improvements to land.
- Australia’s corporate and individual taxes have an integrated treatment of dividends, alleviating the burden of double taxation on distributed earnings.
- Australia ranks well on consumption taxes due to its low goods and services tax (GST) rate even though it applies to a relatively narrow base.
Some weaknesses of the Australian tax system:
- Australia’s treaty network consists of just 45 countries, when the average among OECD countries is 75.
- The corporate tax rate in Australia is 30 percent, above the OECD average (23.9 percent).
- Corporations are limited in their ability to write off investments.
Austria
| Overall Rank | Overall Score | Corporate Tax Rank | Individual Taxes Rank | Consumption Taxes Rank | Property Taxes Rank | Cross-Border Tax Rules Rank |
|---|---|---|---|---|---|---|
| 15 | 67.9 | 19 | 25 | 14 | 16 | 15 |
Austria ranks 15th overall on the 2024 International Tax Competitiveness Index, two places better than in 2023.
Some strengths of the Austrian tax system:
- After several years of reductions, Austria’s corporate tax rate (23 percent) is below the OECD average of 23.9 percent.
- Austria offers relatively good cost recovery for machinery and industrial buildings.
- There are no estate, inheritance, or wealth taxes.
Some weaknesses of the Austrian tax system:
- Austria implemented a digital services tax (DST) in 2020.
- The labor tax wedge on the average single worker ranks 3rd highest among OECD countries.
- Austria has a relatively high top personal income tax rate of 55 percent, setting in at the third-highest threshold in the OECD at 19 times the average wage.
Belgium
| Overall Rank | Overall Score | Corporate Tax Rank | Individual Taxes Rank | Consumption Taxes Rank | Property Taxes Rank | Cross-Border Tax Rules Rank |
|---|---|---|---|---|---|---|
| 26 | 61 | 18 | 13 | 26 | 29 | 24 |
Belgium ranks 26th overall on the 2024 International Tax Competitiveness Index, two ranks worse than in 2023.
Some strengths of the Belgium tax system:
- Belgium has a broad tax treaty network, with 95 countries, and a territorial tax system as it fully exempts foreign-sourced dividends and capital gains without any country limitations.
- Capital gains resulting from normal management of private wealth are exempt from tax.
- Business investments in machinery, buildings, and intangibles all receive better-than-average treatment for corporate write-offs.
Some weaknesses of the Belgium tax system:
- Belgium levies some of the highest withholding tax rates among the OECD countries with 30 percent on dividends, royalties, and interest payments.
- Belgium levies an estate taxAn estate tax is imposed on the net value of an individual’s taxable estate, after any exclusions or credits, at the time of death. The tax is paid by the estate itself before assets are distributed to heirs. and a financial transaction tax and introduced a new annual tax on securities accounts.
- The Belgian tax wedge on labor is the highest among the OECD countries, with the average wage single worker facing a tax burden of 53 percent.
Canada
| Overall Rank | Overall Score | Corporate Tax Rank | Individual Taxes Rank | Consumption Taxes Rank | Property Taxes Rank | Cross-Border Tax Rules Rank |
|---|---|---|---|---|---|---|
| 17 | 66.7 | 26 | 31 | 8 | 25 | 19 |
Canada ranks 17th overall on the 2024 International Tax Competitiveness Index, two places worse than in 2023.
Some strengths of the Canadian tax system:
- Consumption taxes are low, though the consumption tax base is relatively narrow.
- Canada has some of the best capital cost recovery provisions for machinery and industrial buildings in the OECD.
- Canada does not levy wealth, estate, or inheritance taxes.
Some weaknesses of the Canadian tax system:
- Canada taxes capital gains at a rate of 35.7 percent and dividends at 39.3 percent, well above the respective OECD averages of 19.7 percent and 24 percent.
- The corporate rate of 26.2 percent is above average among OECD countries (23.9 percent).
- Canada implemented a digital services tax (DST) in 2024.
Chile
| Overall Rank | Overall Score | Corporate Tax Rank | Individual Taxes Rank | Consumption Taxes Rank | Property Taxes Rank | Cross-Border Tax Rules Rank |
|---|---|---|---|---|---|---|
| 29 | 58.4 | 36 | 24 | 11 | 13 | 38 |
Chile ranks 29th overall on the 2024 International Tax Competitiveness Index, the same as in 2023.
Some strengths of the Chilean tax system:
- Chile has a relatively broad consumption tax base, taxing 71 percent of final consumption, and no VAT thresholds.
- Chile has the second-lowest tax wedge on labor among OECD countries, at 7 percent, compared to the OECD average of 34.6 percent.
- Chile levies no wealth tax, capital duties, financial transaction taxes, or taxes on the transfer of real property.
Some weaknesses of the Chilean tax system:
- Chile operates an uncompetitive system of cross-border taxation, combining a worldwide tax system with a small tax treaty network of just 37 treaties, and the highest withholding tax rates of 35 percent on dividends and interest.
- The tax rate on capital gains is 40 percent, well above the OECD average of 19.7 percent.
- After phasing out full expensing, Chilean companies face the worst capital cost recovery provisions in the OECD.
Colombia
| Overall Rank | Overall Score | Corporate Tax Rank | Individual Taxes Rank | Consumption Taxes Rank | Property Taxes Rank | Cross-Border Tax Rules Rank |
|---|---|---|---|---|---|---|
| 38 | 45.7 | 38 | 14 | 15 | 35 | 37 |
Colombia ranks 38th overall on the 2024 International Tax Competitiveness Index, the same as in 2023.
Some strengths of the Colombian tax system:
- A worker earning the nation’s average wage faces the lowest tax burden in the OECD.
- Colombia taxes dividends and capital gains at relatively low rates of 15 and 20 percent, respectively.
- The VAT rate of 19 percent matches the OECD average and is applied without a minimum earnings threshold.
Some weaknesses of the Colombian tax system:
- At 35 percent, Colombia’s corporate income tax rate is significantly above the OECD average of 23.9 percent.
- Colombia is one of the few OECD countries that operates a worldwide corporate tax system (rather than a territorial system).
- Colombia levies a net wealth tax and a financial transactions tax.
Costa Rica
| Overall Rank | Overall Score | Corporate Tax Rank | Individual Taxes Rank | Consumption Taxes Rank | Property Taxes Rank | Cross-Border Tax Rules Rank |
|---|---|---|---|---|---|---|
| 21 | 65.2 | 35 | 32 | 7 | 11 | 28 |
Costa Rica ranks 21st overall on the 2024 International Tax Competitiveness Index, one place better than in 2023.
Some strengths of the Costa Rican tax system:
- Costa Rica has neither a net wealth nor an estate tax.
- The VAT rate is just 13 percent, below the OECD average of 19 percent.
- Capital gains and dividends are both taxed at rates below the OECD average.
Some weaknesses of the Costa Rican tax system:
- Costa Rica has just four tax treaties while the average in the OECD is 74.
- Costa Rica has five separate tax brackets for corporate income, with a top rate of 30 percent significantly above the OECD average (23.9 percent).
- Costa Rica’s carryover provisions are the most restrictive in the OECD, with carryforwards limited to three years and no carrybacks.
Czech Republic
| Overall Rank | Overall Score | Corporate Tax Rank | Individual Taxes Rank | Consumption Taxes Rank | Property Taxes Rank | Cross-Border Tax Rules Rank |
|---|---|---|---|---|---|---|
| 8 | 77.3 | 8 | 4 | 32 | 6 | 11 |
The Czech Republic ranks 8th overall on the 2024 International Tax Competitiveness Index, three places worse than in 2023.
Some strengths of the Czech tax system:
- The corporate rate of 21 percent is below the OECD average (23.9 percent), with few complex incentives.
- Taxes on labor are minimally distortive.
- Capital gains are tax-exempt if assets as shares were held for a minimum period (three years for company shares), encouraging long-term saving.
Some weaknesses of the Czech tax system:
- The VAT threshold is relatively high, contributing to a distortionary VAT design.
- Net operating losses can only be carried forward for five years (they can, however, also be carried back for two years).
- The cost of inventory can be accounted for using the First In, First Out method or the Average Cost method (Last In, First Out is not permitted).
Denmark
| Overall Rank | Overall Score | Corporate Tax Rank | Individual Taxes Rank | Consumption Taxes Rank | Property Taxes Rank | Cross-Border Tax Rules Rank |
|---|---|---|---|---|---|---|
| 28 | 60.2 | 14 | 36 | 20 | 17 | 32 |
Denmark ranks 28th overall on the 2024 International Tax Competitiveness Index, the same as in 2023.
Some strengths of the Danish tax system:
- The corporate tax rate of 22 percent lies below the OECD average (23.9 percent), and the corporate income tax system features few complex incentives.
- Denmark has a territorial tax system, exempting both foreign dividend and capital gains income for its treaty partners and other European countries.
- Denmark has a relatively broad VAT base that covers around two thirds of final consumption.
Some weaknesses of the Danish tax system:
- In addition to a combined top personal income tax rate of 55.9 percent, the personal income tax rates on dividends and capital gains are both at 42 percent, well above the OECD averages of 24.7 percent and 19 percent, respectively.
- Net operating losses can be carried forward indefinitely but are limited to 60 percent of taxable income if they exceed a certain amount.
- Denmark uses First In, First Out for assessing the cost of inventory for tax purposes.
Estonia
| Overall Rank | Overall Score | Corporate Tax Rank | Individual Taxes Rank | Consumption Taxes Rank | Property Taxes Rank | Cross-Border Tax Rules Rank |
|---|---|---|---|---|---|---|
| 1 | 100 | 2 | 2 | 18 | 1 | 9 |
Estonia ranks 1st overall on the 2024 International Tax Competitiveness Index, the same as in 2023, and for the 11th consecutive year.
Some strengths of the Estonian tax system:
- Estonia’s corporate income tax system only taxes distributed earnings, allowing companies to reinvest their profits tax-free.
- The VAT applies to a broad base and has a low compliance burden.
- Property taxes only apply to the value of land.
Some weaknesses of the Estonian tax system:
- Estonia has tax treaties with just 62 countries, below the OECD average (75 countries).
- Estonia’s territorial tax system is limited to European countries.
- Estonia’s thin capitalization rules are among the more stringent ones in the OECD.
Finland
| Overall Rank | Overall Score | Corporate Tax Rank | Individual Taxes Rank | Consumption Taxes Rank | Property Taxes Rank | Cross-Border Tax Rules Rank |
|---|---|---|---|---|---|---|
| 21 | 65.1 | 7 | 27 | 24 | 19 | 22 |
Finland ranks 21st overall on the 2024 International Tax Competitiveness Index, one spot worse than in 2023.
Some strengths of the Finnish tax system:
- Finland has a relatively low corporate tax rate of 20 percent and the sixth-most attractive capital cost recovery provisions for investments in machinery in the OECD.
- The design of corporate and personal income taxes makes them relatively less complex than in other countries.
- Finland has a territorial tax system and a broad tax treaty network with 76 countries.
Some weaknesses of the Finnish tax system:
- Finland levies both an estate and a financial transactions tax.
- Companies are limited in their ability to carry forward net operating losses and are restricted to using First In, First Out as the cost accounting method for inventory.
- Finland’s top statutory rate on personal income is relatively high at 51.4 percent, and social contributions are not capped.
France
| Overall Rank | Overall Score | Corporate Tax Rank | Individual Taxes Rank | Consumption Taxes Rank | Property Taxes Rank | Cross-Border Tax Rules Rank |
|---|---|---|---|---|---|---|
| 36 | 50.2 | 33 | 33 | 31 | 31 | 13 |
France ranks 36th overall on the 2024 International Tax Competitiveness Index, the same as in 2023.
Some strengths of the French tax system:
- France has above-average cost recovery provisions for investments in machinery, buildings, and intangibles (though compromised by the French production taxes).
- After several years of reductions, France’s corporate tax rate (25.8 percent) is much closer to the OECD average of 23.9 percent.
- France has a broad tax treaty network, with 122 countries.
Some weaknesses of the French tax system:
- France has multiple distortionary property taxes with separate levies on estates, bank assets, financial transactions, and a wealth tax on real estate.
- The tax burden on labor of 47 percent is among the highest for OECD countries.
- A reduced 10 percent tax rate applies to income derived from IP rights through a so-called patent box.
Germany
| Overall Rank | Overall Score | Corporate Tax Rank | Individual Taxes Rank | Consumption Taxes Rank | Property Taxes Rank | Cross-Border Tax Rules Rank |
|---|---|---|---|---|---|---|
| 16 | 66.8 | 31 | 35 | 13 | 12 | 8 |
Germany ranks 16th overall on the 2024 International Tax Competitiveness Index, two places better than in 2023.
Some strengths of the German tax system:
- Germany has a broad tax treaty network, with 95 countries.
- Inventory can receive Last In, First Out treatment, the most neutral treatment of inventory costs.
- Germany has above-average cost recovery provisions for intangible assets.
Some weaknesses of the German tax system:
- Germany has the sixth highest corporate income tax rate among OECD countries, at 29.9 percent, including a 5.5 percent surtax.
- The tax burden on labor is the second-highest in the OECD, with a total tax wedge of 47.8 percent on the average single worker.
- Companies are limited in the amount of net operating losses they can use to offset income on future or previous tax returns, with special limits on local business tax liability.
Greece
| Overall Rank | Overall Score | Corporate Tax Rank | Individual Taxes Rank | Consumption Taxes Rank | Property Taxes Rank | Cross-Border Tax Rules Rank |
|---|---|---|---|---|---|---|
| 27 | 60.9 | 17 | 9 | 34 | 27 | 21 |
Greece ranks 27th overall on the 2024 International Tax Competitiveness Index, the same place as in 2023.
Some strengths of the Greek tax system:
- The net personal tax rate of 5 percent on dividends is significantly below the OECD average of 24.7 percent.
- The corporate income tax rate of 22 percent is below the OECD average of 23.9 percent.
- Controlled Foreign Corporation rules in Greece are modest and only apply to passive income.
Some weaknesses of the Greek tax system:
- Companies are severely limited in the amount of net operating losses they can use to offset future profits, and companies cannot use losses to reduce past taxable income.
- Greece has a relatively narrow tax treaty network (58 treaties compared to an OECD average of 75 treaties).
- At 24 percent, Greece has one of the highest VAT rates applied to one of the narrowest bases in the OECD, covering only 37 percent of final consumption.
Hungary
| Overall Rank | Overall Score | Corporate Tax Rank | Individual Taxes Rank | Consumption Taxes Rank | Property Taxes Rank | Cross-Border Tax Rules Rank |
|---|---|---|---|---|---|---|
| 7 | 77.5 | 4 | 5 | 36 | 23 | 3 |
Hungary ranks 7th overall on the 2024 International Tax Competitiveness Index, one spot better than in 2023.
Some strengths of the Hungarian tax system:
- Hungary has the lowest corporate tax rate in the OECD, at 9 percent.
- Personal income is taxed at a flat rate of 15 percent.
- Hungary operates a territorial tax system that fully exempts dividends and capital gains, does not have withholding taxes, and has better-than-average CFC rules.
Some weaknesses of the Hungarian tax system:
- Companies are severely limited in the amount of net operating losses they can use to offset future profits, and companies cannot use losses to reduce past taxable income.
- Hungary levies the highest VAT rate among OECD countries, at 27 percent, albeit on a relatively broad base.
- Hungary levies taxes on estates, real estate transfers, financial transactions, and bank assets.
Iceland
| Overall Rank | Overall Score | Corporate Tax Rank | Individual Taxes Rank | Consumption Taxes Rank | Property Taxes Rank | Cross-Border Tax Rules Rank |
|---|---|---|---|---|---|---|
| 34 | 55.9 | 16 | 20 | 29 | 33 | 27 |
Iceland ranks 34th overall on the 2024 International Tax Competitiveness Index, one spot worse than in 2023.
Some strengths of the Icelandic tax system:
- Iceland’s corporate tax rate of 21 percent is below the OECD average of 23.9 percent, and cost recovery for industrial buildings is one of the best in the OECD.
- Personal income taxes are less complex and create a slightly lower tax burden on labor than the OECD average.
- Iceland has a territorial tax system that fully exempts foreign dividends and capital gains with no country limitations.
Some weaknesses of the Icelandic tax system:
- Companies are limited in the amount of net operating losses they can use to offset future profits, and companies cannot use losses to reduce past taxable income.
- The VAT of 24 percent applies to a relatively narrow tax base below half of final consumption.
- Iceland’s Controlled Foreign Corporation rules apply to both passive and active income.
Ireland
| Overall Rank | Overall Score | Corporate Tax Rank | Individual Taxes Rank | Consumption Taxes Rank | Property Taxes Rank | Cross-Border Tax Rules Rank |
|---|---|---|---|---|---|---|
| 31 | 57.4 | 5 | 37 | 35 | 18 | 34 |
Ireland ranks 31st overall on the 2024 International Tax Competitiveness Index, the same as in 2023.
Some strengths of the Irish tax system:
- Ireland has a low corporate tax rate of 12.5 percent.
- Net operating losses can be carried back one year and carried forward indefinitely, allowing companies to be taxed on their average profitability.
- The tax treaty network (74 treaties) is just below the OECD average of 75 countries.
Some weaknesses of the Irish tax system:
- Ireland’s personal tax rate on dividend income of 51 percent is the highest among OECD countries.
- The VAT rate of 23 percent is one of the highest in the OECD and applies to a relatively narrow tax base.
- Corporations are limited in their ability to write off investments.
Israel
| Overall Rank | Overall Score | Corporate Tax Rank | Individual Taxes Rank | Consumption Taxes Rank | Property Taxes Rank | Cross-Border Tax Rules Rank |
|---|---|---|---|---|---|---|
| 10 | 76.4 | 11 | 29 | 10 | 10 | 10 |
Israel ranks 10th overall on the 2024 International Tax Competitiveness Index, the same as in 2023.
Some strengths of the Israeli tax system:
- Net operating losses can be carried forward indefinitely.
- The VAT rate is relatively low at 17 percent and applies to a relatively broad base.
- Israel does not levy wealth or estate taxes.
Some weaknesses of the Israeli tax system:
- Israel has complex incentives that reduce the corporate tax rate to as low as 7.5 percent on certain technology companies.
- The steep progressivity of Israel’s taxes on labor leads to efficiency costs.
- Israel has a relatively narrow tax treaty network of 60 countries (the OECD average is 75), combined with high withholding tax rates on dividends, royalties, and interest.
Italy
| Overall Rank | Overall Score | Corporate Tax Rank | Individual Taxes Rank | Consumption Taxes Rank | Property Taxes Rank | Cross-Border Tax Rules Rank |
|---|---|---|---|---|---|---|
| 37 | 47.2 | 24 | 16 | 38 | 38 | 25 |
Italy ranks 37th overall on the 2024 International Tax Competitiveness Index, the same as in 2023.
Some strengths of the Italian tax system:
- Italy has above-average cost recovery provisions for investments in machinery, buildings, and intangibles, as well as an allowance for corporate equity (ACE).
- Last In, First Out treatment of the cost of inventory is allowed.
- Italy has a broad tax treaty network, with 101 countries.
Some weaknesses of the Italian tax system:
- Italy has multiple distortionary property taxes with separate levies on real estate transfers, estates, and financial transactions, as well as a wealth tax on selected assets.
- The VAT rate of 22 percent applies to the seventh-narrowest consumption tax base in the OECD.
- The corporate tax rate of 27.8 percent is significantly above the OECD average of 23.9 percent.
Japan
| Overall Rank | Overall Score | Corporate Tax Rank | Individual Taxes Rank | Consumption Taxes Rank | Property Taxes Rank | Cross-Border Tax Rules Rank |
|---|---|---|---|---|---|---|
| 25 | 61.1 | 34 | 34 | 5 | 26 | 29 |
Japan ranks 25th overall on the 2024 International Tax Competitiveness Index, one spot better than in 2023.
Some strengths of the Japanese tax system:
- Japan has a low VAT rate of 10 percent.
- The consumption tax base is relatively broad, covering 71 percent of consumption.
- Japan’s personal income tax rate on dividends is 20.3 percent, below the OECD average of 24 percent.
Some weaknesses of the Japanese tax system:
- Japan has a corporate tax system with a high rate of 29.7 percent and poor cost recovery provisions for business investments in machinery and buildings.
- Japan has a hybrid international tax system with a 95 percent exemption for foreign dividends and no exemption for foreign capital gains, while many OECD countries have moved to a fully territorial system.
- Companies are severely limited in the amount of net operating losses they can use to offset future profits.
Korea
| Overall Rank | Overall Score | Corporate Tax Rank | Individual Taxes Rank | Consumption Taxes Rank | Property Taxes Rank | Cross-Border Tax Rules Rank |
|---|---|---|---|---|---|---|
| 24 | 63 | 25 | 38 | 1 | 32 | 30 |
Korea ranks 24th overall on the 2024 International Tax Competitiveness Index, one spot better than in 2023.
Some strengths of the Korean tax system:
- Korea has a low VAT of 10 percent that is applied to a relatively broad base, covering 79 percent of final consumption.
- Korea has a broad tax treaty network, with 94 countries.
- Business investments in machinery receive better-than-average treatment for corporate write-offs.
Some weaknesses of the Korean tax system:
- Korea has multiple distortionary property taxes with separate levies on real estate transfers, estates, and financial transactions.
- The personal income tax rate on dividends is 44.5 percent (compared to an OECD average of 24.7 percent).
- Korea is one of the few OECD countries that operates a worldwide corporate tax system (rather than a territorial system).
Latvia
| Overall Rank | Overall Score | Corporate Tax Rank | Individual Taxes Rank | Consumption Taxes Rank | Property Taxes Rank | Cross-Border Tax Rules Rank |
|---|---|---|---|---|---|---|
| 2 | 92.2 | 1 | 3 | 21 | 5 | 7 |
Latvia ranks 2nd overall on the 2024 International Tax Competitiveness Index, the same as in 2023.
Some strengths of the Latvian tax system:
- Latvia’s corporate income tax system only taxes distributed earnings, allowing companies to reinvest their profits tax-free.
- Latvia operates a territorial tax system, exempting foreign dividends and capital gains, and does not levy withholding taxes on foreign-bound interest payments, dividends, or royalties.
- Taxes on labor are relatively flat, allowing the government to raise revenue from taxes on workers with very few distortions.
Some weaknesses of the Latvian tax system:
- Latvia’s network of tax treaties includes 62 countries, a relatively low number.
- Latvia’s thin-capitalization rules are among the stricter ones in the OECD.
- The threshold at which the VAT applies is significantly higher than the average VAT threshold for OECD countries.
Lithuania
| Overall Rank | Overall Score | Corporate Tax Rank | Individual Taxes Rank | Consumption Taxes Rank | Property Taxes Rank | Cross-Border Tax Rules Rank |
|---|---|---|---|---|---|---|
| 5 | 79.5 | 3 | 10 | 27 | 7 | 16 |
Lithuania ranks 5th overall on the 2024 International Tax Competitiveness Index, two spots better than in 2023.
Some strengths of the Lithuanian tax system:
- Business investments in machinery, buildings, and intangibles receive significantly better-than-average tax treatment.
- Lithuania’s corporate tax rate is 15 percent, well below the OECD average of 23.9 percent.
- Lithuania’s taxes on labor are flatter than average, allowing the government to raise revenue from taxes on workers with very few distortions.
Some weaknesses of the Lithuanian tax system:
- Lithuania has tax treaties with just 57 countries, below the OECD average (75 countries).
- Lithuania has both a patent box and a super deduction for Research and Development expenditures.
- The threshold at which VAT applies is nearly twice as high as the OECD average threshold.
Luxembourg
| Overall Rank | Overall Score | Corporate Tax Rank | Individual Taxes Rank | Consumption Taxes Rank | Property Taxes Rank | Cross-Border Tax Rules Rank |
|---|---|---|---|---|---|---|
| 6 | 78.8 | 22 | 23 | 6 | 14 | 5 |
Luxembourg ranks 6th overall on the 2024 International Tax Competitiveness Index, the same as in 2023.
Some strengths of the Luxembourg tax system:
- Business investments in machinery and intangibles receive better-than-average tax treatment.
- Luxembourg applies its relatively low VAT rate of 17 percent to the second-broadest base in the OECD, covering 91 percent of final consumption.
- Capital gains are tax-exempt if a movable asset such as shares was held for at least six months, encouraging long-term savings.
Some weaknesses of the Luxembourg tax system:
- Companies are limited in the time period in which they can use net operating losses to offset future profits and are unable to use losses to offset past taxable income.
- Luxembourg has several distortionary property taxes with separate levies on real estate transfers, estates, and corporate net assets.
- Luxembourg has a solidarity tax which acts as a 7 percent surtax on corporate income and a 7 to 9 percent surtax on personal income.
Mexico
| Overall Rank | Overall Score | Corporate Tax Rank | Individual Taxes Rank | Consumption Taxes Rank | Property Taxes Rank | Cross-Border Tax Rules Rank |
|---|---|---|---|---|---|---|
| 23 | 64.9 | 27 | 19 | 12 | 3 | 36 |
Mexico ranks 23nd overall on the 2024 International Tax Competitiveness Index, the same spot as in 2023.
Some strengths of the Mexican tax system:
- The personal income tax rate on dividends is 17.1 percent, below the OECD average of 24.7 percent.
- Corporations can deduct property taxes when calculating taxable income.
- Mexico allows for Last In, First Out treatment of the cost of inventory.
Some weaknesses of the Mexican tax system:
- Businesses are severely limited in the time period in which they can use net operating losses to offset future profits and are unable to use losses to reduce past taxable income.
- Mexico’s VAT covers only 34 percent of final consumption, revealing both policy and enforcement gaps.
- Mexico has a worldwide tax system with the highest withholding tax rate in the OECD of 35 percent on interest and royalties and a relatively small treaty network of 59 countries (OECD average of 75 countries).
Netherlands
| Overall Rank | Overall Score | Corporate Tax Rank | Individual Taxes Rank | Consumption Taxes Rank | Property Taxes Rank | Cross-Border Tax Rules Rank |
|---|---|---|---|---|---|---|
| 14 | 68.3 | 23 | 30 | 17 | 21 | 4 |
The Netherlands ranks 14th overall on the 2024 International Tax Competitiveness Index, the same as in 2023.
Some strengths of the Dutch tax system:
- The Netherlands allows net operating losses to be carried back one year, and the Last In, First Out treatment of the cost of inventory is allowed.
- The Netherlands has a territorial tax system exempting both foreign dividends and capital gains and a broad tax treaty network, with 97 countries.
- Corporations can deduct property taxes when calculating taxable income.
Some weaknesses of the Dutch tax system:
- The Netherlands has a progressive tax system with a top statutory rate on personal income of 49.5 percent.
- The capital gains rate of 33 percent is significantly above the OECD average of 19.7 percent.
- Companies are limited in the amount of net operating losses that they can use to offset future profits.
New Zealand
| Overall Rank | Overall Score | Corporate Tax Rank | Individual Taxes Rank | Consumption Taxes Rank | Property Taxes Rank | Cross-Border Tax Rules Rank |
|---|---|---|---|---|---|---|
| 3 | 84.2 | 30 | 6 | 2 | 8 | 17 |
New Zealand ranks 3rd overall on the 2024 International Tax Competitiveness Index, the same as in 2023.
Some strengths of the New Zealand tax system:
- New Zealand levies no taxes on inheritance, property transfers, assets, capital gains, or financial transactions.
- The VAT of 15 percent applies to nearly the entire potential consumption tax base.
- New Zealand allows corporate losses to be carried forward indefinitely, allowing businesses to be taxed on their average profitability.
Some weaknesses of the New Zealand tax system:
- New Zealand has an above-average corporate tax rate of 28 percent (the OECD average is 23.9 percent) and the second-worst cost recovery provisions for business investments in the OECD.
- New Zealand has a narrow tax treaty network, with 40 countries.
- The cost of inventory can be accounted for using First In, First Out method or the Average Cost method (Last In, First Out is not permitted).
Norway
| Overall Rank | Overall Score | Corporate Tax Rank | Individual Taxes Rank | Consumption Taxes Rank | Property Taxes Rank | Cross-Border Tax Rules Rank |
|---|---|---|---|---|---|---|
| 19 | 66.2 | 13 | 28 | 25 | 15 | 14 |
Norway ranks 19th overall on the 2024 International Tax Competitiveness Index, the same spot as in 2023.
Some strengths of the Norwegian tax system:
- Norway allows corporate losses to be carried forward indefinitely.
- Norway’s corporate income tax rate of 22 percent is close to the OECD average (23.9 percent).
- Norway has a territorial tax system, a network of 87 tax treaties, and no withholding taxes on interest and royalties.
Some weaknesses of the Norwegian tax system:
- Corporations are limited in their ability to write off investments.
- Norway is one of the few OECD countries that levies a net wealth tax.
- Controlled Foreign Corporation rules are applied to both passive and active income.
Poland
| Overall Rank | Overall Score | Corporate Tax Rank | Individual Taxes Rank | Consumption Taxes Rank | Property Taxes Rank | Cross-Border Tax Rules Rank |
|---|---|---|---|---|---|---|
| 31 | 57.5 | 12 | 11 | 37 | 30 | 23 |
Poland ranks 31st overall on the 2024 International Tax Competitiveness Index, the same spot as in 2023.
Some strengths of the Polish tax system:
- Poland has a below-average corporate tax rate of 19 percent (the OECD average is 23.9 percent).
- Poland has a broad tax treaty network including 87 countries.
- Poland has an allowance for corporate equity that limits the debt-bias of taxation.
Some weaknesses of the Polish tax system:
- Poland has multiple distortionary property taxes with separate levies on real estate transfers, estates, bank assets, and financial transactions.
- Companies are severely limited in the amount of net operating losses they can use to offset future profits and are unable to use losses to reduce past taxable income.
- Companies can write off just 33.8 percent of the cost of industrial buildings in real terms (the OECD average is 47.2 percent).
Portugal
| Overall Rank | Overall Score | Corporate Tax Rank | Individual Taxes Rank | Consumption Taxes Rank | Property Taxes Rank | Cross-Border Tax Rules Rank |
|---|---|---|---|---|---|---|
| 35 | 53.7 | 37 | 26 | 22 | 20 | 31 |
Portugal ranks 35th overall on the 2024 International Tax Competitiveness Index, the same as in 2023.
Some strengths of the Portuguese tax system:
- Corporations can deduct their property taxes from their taxable income, and there is an ACE that limits the debt-bias of taxation.
- Portugal has a territorial tax system, exempting foreign dividend and capital gains income for most countries.
- Portugal provides above-average capital cost write-offs for investments in machinery.
Some weaknesses of the Portuguese tax system:
- The corporate tax rate is the second-highest in the OECD at 31.5 percent, including multiple distortive top-up taxes.
- Portugal’s corporate tax system features highly complex incentives.
- Portugal has a high top statutory tax rate on personal income of 53 percent, including top-up taxes, and there is no ceiling on social contributions.
Slovak Republic
| Overall Rank | Overall Score | Corporate Tax Rank | Individual Taxes Rank | Consumption Taxes Rank | Property Taxes Rank | Cross-Border Tax Rules Rank |
|---|---|---|---|---|---|---|
| 9 | 76.5 | 15 | 1 | 28 | 2 | 26 |
The Slovak Republic ranks 9th overall on the 2024 International Tax Competitiveness Index, the same as in 2023.
Some strengths of the Slovakian tax system:
- The personal income rate on dividends is very low at 7 percent (compared to an OECD average of 24 percent), and capital-gains are tax-free after a minimum holding period, encouraging long-term saving.
- The Slovak Republic has a low statutory tax rate on personal income of 25 percent.
- The Slovak Republic has better-than-average tax treatment of business investment in machinery, buildings, and intangibles.
Some weaknesses of the Slovakian tax system:
- Companies are severely limited in the amount of net operating losses they can use to offset future profits and are unable to use losses to reduce past taxable income.
- The VAT of 20 percent applies to approximately half of the potential consumption tax base.
- The Slovak Republic has both a patent box and a super deduction for Research and Development expenditures, adding to the complexity of the system.
Slovenia
| Overall Rank | Overall Score | Corporate Tax Rank | Individual Taxes Rank | Consumption Taxes Rank | Property Taxes Rank | Cross-Border Tax Rules Rank |
|---|---|---|---|---|---|---|
| 22 | 64.9 | 9 | 12 | 30 | 24 | 20 |
Slovenia ranks 22nd overall on the 2024 International Tax Competitiveness Index, seven places worse than in 2023.
Some strengths of the Slovenian tax system:
- Slovenia taxes corporate income at a 22 percent rate, below the OECD average of 23.9 percent, and with relatively few complex incentives.
- Slovenia’s 22 percent VAT applies to a tax base of roughly the OECD average.
- Capital gains taxes are reduced the longer assets are held (a zero percent rate applies after holding an asset for at least 20 years), encouraging long-term savings.
Some weaknesses of the Slovenian tax system:
- Slovenia’s levies a relatively high statutory top rate on personal income at 50 percent and there is no general ceiling on social contributions.
- Slovenia has a relatively narrow tax treaty network, with 60 countries, and only a partial territorial tax system.
- Slovenia has multiple distortionary property taxes with separate levies on real estate transfers, estates, and bank assets.
Spain
| Overall Rank | Overall Score | Corporate Tax Rank | Individual Taxes Rank | Consumption Taxes Rank | Property Taxes Rank | Cross-Border Tax Rules Rank |
|---|---|---|---|---|---|---|
| 33 | 56.3 | 29 | 22 | 19 | 37 | 18 |
Spain ranks 33rd overall on the 2024 International Tax Competitiveness Index, one spot better than in 2023.
Some strengths of the Spanish tax system:
- Spain has a territorial tax system that exempts 95 percent of foreign dividends and capital gains income from taxation.
- The Spanish tax treaty network is made up of 95 countries.
- Property taxes can be deducted against corporate income taxes.
Some weaknesses of the Spanish tax system:
- The VAT of 21 percent applies to less than half of the potential consumption tax base.
- Spain has multiple distortionary property taxes with separate levies on real estate transfers, net wealth, estates, and financial transactions.
- Spain has both a patent box and a credit for Research and Development.
Sweden
| Overall Rank | Overall Score | Corporate Tax Rank | Individual Taxes Rank | Consumption Taxes Rank | Property Taxes Rank | Cross-Border Tax Rules Rank |
|---|---|---|---|---|---|---|
| 12 | 73.2 | 6 | 18 | 23 | 9 | 12 |
Sweden ranks 12th overall on the 2024 International Tax Competitiveness Index, the same as in 2023.
Some strengths of the Swedish tax system:
- Sweden has a lower-than-average corporate tax rate of 20.6 percent and provides for net operating losses to be carried forward indefinitely.
- Sweden has a territorial tax system that exempts both foreign dividends and capital gains income from taxation without any country limitations.
- Sweden has a broader-than-average VAT base covering 62 percent of final consumption (compared to an OECD average of 58 percent).
Some weaknesses of the Swedish tax system:
- Sweden’s personal dividend tax rate and capital gains tax rate are both 30 percent, above the OECD averages (24.7 percent for dividends and 19.7 percent for capital gains).
- Sweden has a top statutory personal income tax rate of 52.2 percent.
- Sweden has controlled foreign corporation rules that apply to both passive and active income.
Switzerland
| Overall Rank | Overall Score | Corporate Tax Rank | Individual Taxes Rank | Consumption Taxes Rank | Property Taxes Rank | Cross-Border Tax Rules Rank |
|---|---|---|---|---|---|---|
| 4 | 83.6 | 10 | 8 | 3 | 36 | 1 |
Switzerland ranks 4th overall on the 2024 International Tax Competitiveness Index, the same as in 2023.
Some strengths of the Swiss tax system:
- Switzerland has above-average cost recovery provisions for investments in machines, buildings, and intangibles.
- Switzerland has a broad tax treaty network with 109 countries and no CFC rules.
- The Swiss VAT of 8.1 percent applies to a broad base that covers 69 percent of final consumption.
Some weaknesses of the Swiss tax system:
- Switzerland has multiple distortionary property taxes with separate levies on real estate transfers, net wealth, estates, assets, and financial transactions.
- Companies are limited in the time period in which they can use net operating losses to offset future profits and are unable to use losses to reduce past taxable income.
- The VAT exemption threshold is almost twice as high as the OECD average.
Turkey
| Overall Rank | Overall Score | Corporate Tax Rank | Individual Taxes Rank | Consumption Taxes Rank | Property Taxes Rank | Cross-Border Tax Rules Rank |
|---|---|---|---|---|---|---|
| 11 | 74.8 | 21 | 7 | 16 | 22 | 6 |
Turkey ranks 11th overall on the 2024 International Tax Competitiveness Index, the same as in 2023.
Some strengths of the Turkish tax system:
- Turkey has a territorial tax system, exempting foreign dividends and capital gains income without any country limitations, and a tax treaty network of 88 countries.
- The personal income tax on dividends is 20 percent, below the OECD average (24.7 percent), and capital gains from domestically listed shares held for more than two years are tax-exempt.
- Turkey provides an allowance for equity (ACE), addressing the debt bias inherent to the standard corporate income tax.
Some weaknesses of the Turkish tax system:
- Companies are severely limited in the time period in which they can use net operating losses to offset future profits and are unable to use losses to reduce past taxable income.
- Turkey’s VAT rate of 20 percent applies to less than half of the potential tax base.
- Turkey has multiple distortionary property taxes with separate levies on real estate transfers, estates, and financial transactions.
United Kingdom
| Overall Rank | Overall Score | Corporate Tax Rank | Individual Taxes Rank | Consumption Taxes Rank | Property Taxes Rank | Cross-Border Tax Rules Rank |
|---|---|---|---|---|---|---|
| 30 | 58.1 | 28 | 21 | 33 | 34 | 2 |
The United Kingdom ranks 30th overall on the 2024 International Tax Competitiveness Index, the same spot as in 2023.
Some strengths of the UK tax system:
- The UK provides full expensing for business investments in machinery and above-average cost recovery for investments in intangible assets.
- The UK has a territorial tax system exempting both foreign dividend and capital gains income without any country limitations.
- The UK operates the broadest tax treaty network in the OECD with 131 countries.
Some weaknesses of the UK tax system:
- The top personal income tax rate on dividends is 39.35 percent, well above the OECD average (24.7 percent).
- The real property tax burden is the highest in the OECD.
- The VAT at a rate of 20 percent applies to less than half of the potential consumption tax base, and the VAT exemption threshold is 2.5 times as high as the OECD average.
United States
| Overall Rank | Overall Score | Corporate Tax Rank | Individual Taxes Rank | Consumption Taxes Rank | Property Taxes Rank | Cross-Border Tax Rules Rank |
|---|---|---|---|---|---|---|
| 18 | 66.5 | 20 | 17 | 4 | 28 | 35 |
The United States ranks 18th overall on the 2024 International Tax Competitiveness Index, five spots better than in 2023.
Some strengths of the US tax system:
- The US allows for Last In, First Out treatment of the cost of inventory.
- US companies enjoy the fifth-best cost recovery provisions for investments in machinery in the OECD.
- US states have relatively low sales taxes of 7.7 percent on average.
Some weaknesses of the US tax system:
- US states’ sales taxes apply on average to less than 40 percent of the potential tax base.
- The US has a partial territorial system and does not exempt foreign capital gains income.
- The real property tax burden is among the highest in the OECD.
Appendix
To access the full appendix, including methodology, data sources, and tables, click “Download the Full Report” button at the top of the page.
References:
[1] Daniel Bunn and Cecilia Perez Weigel, “Sources of Government Revenue in the OECD,” Tax Foundation, March 18, 2024 https://taxfoundation.org/data/all/global/oecd-tax-revenue-by-country-2024/.
[2] Alex Mengden, “Worldwide Investment at Risk as Capital Allowances Phase Out,” Tax Foundation, Jun. 11, 2024, https://taxfoundation.org/blog/business-tax-reform-expiring/.
[3] Organisation for Economic Co-operation and Development (OECD), “Tax and Economic Growth,” Economics Department Working Paper No. 620, July 11, 2008.
[4] Last year’s scores published in this report can differ from previously published rankings due to both methodological changes and corrections made to previous years’ data.
[5] Tax Foundation, “International Tax Competitiveness Index,” https://github.com/TaxFoundation/international-tax-competitiveness-index.
[6] Daniel Bunn and Cecilia Perez Weigel, “Sources of Government Revenue in the OECD.”
[7] OECD, “Tax Policy Reform and Economic Growth,” OECD Tax Policy Studies, No. 20, Nov. 3, 2010, https://oecd.org/ctp/tax-policy/tax-policy-reform-and-economic-growth-9789264091085-en.htm.
[8] OECD, “Corporate income tax statutory and targeted small business rates, Combined corporate income tax rate,” updated July 2024, https://data-explorer.oecd.org/.
[9] Tibor Hanappi, “Loss carryover provisions: Measuring effects on tax symmetry and automatic stabilisation,” OECD Taxation Working Papers No. 35, Feb. 22, 2018, https://oecd-ilibrary.org/taxation/loss-carryover-provisions_bfbcd0db-en; and Michael P. Devereux and Clemens Fuest, “Is the Corporation Tax an Effective Automatic Stabilizer?” National Tax Journal 62:3 (September 2009): 429-437, https://journals.uchicago.edu/doi/abs/10.17310/ntj.2009.3.05.
[10] Countries with unlimited carryforwards are coded as having periods of 100 years. Some countries restrict the amount of taxable income that can be offset by losses each year. For example, Slovenia allows for indefinite carryforwards but only 63 percent of taxable income can be offset by losses in any given year. These restrictions are coded as the percentage of taxable income that can be offset by losses times the number of allowable years. Thus, Slovenia is coded as 63.
[11] Bloomberg Tax, “Country Guides,” https://bloomberglaw.com/product/tax/toc/source/511920/147664382; PwC, “Worldwide Tax Summaries,” https://pwc.com/gx/en/services/tax/worldwide-tax-summaries.html; and individual government websites.
[12] Estonia and Latvia do not have explicit loss carryover provisions. However, their cash-flow corporate tax system implicitly allows for unlimited loss carryforwards and carrybacks.
[13] Bloomberg Tax, “Country Guides;” PwC, “Worldwide Tax Summaries”; and individual government websites.
[14] Alex Mengden, “Capital Cost Recovery across the OECD,” Tax Foundation, Jun. 6, 2024, https://taxfoundation.org/data/all/global/capital-allowances-cost-recovery-2024/.
[15] Intangible assets are typically amortized, but the write-off is similar to depreciation.
[16] Data and calculations are based on Mengden, “Capital Cost Recovery across the OECD.”
[17] Kyle Pomerleau, “The Tax Treatment of Inventories and the Economic and Budgetary Impact of LIFO Repeal,” Tax Foundation, Feb. 9, 2016, https://taxfoundation.org/tax-treatment-inventories-and-economic-and-budgetary-impact-lifo-repeal/.
[18] Christoph Spengel, Frank Schmidt, Jost Heckemeyer, and Katharina Nicolay, “Effective Tax Levels Using the Devereux/Griffith Methodology,” European Commission, October 2021, https://taxation-customs.ec.europa.eu/system/files/2022-03/final_report_2021_effective_tax_levels_revised_en.pdf; PwC, “Worldwide Tax Summaries: Corporate – Income Determination,” https://taxsummaries.pwc.com/australia/corporate/income-determination; and EY, “Worldwide Corporate Tax Guide 2023.”
[19] IMF, “Tax Policy, Leverage and Macroeconomic Stability,” Policy Papers, Oct. 12, 2016, https://imf.org/en/Publications/Policy-Papers/Issues/2016/12/31/Tax-Policy-Leverage-and-Macroeconomic-Stability-PP5073.
[20] The European Commission also included an allowance for corporate equity in its proposal for a common corporate tax base in the European Union. See European Commission, “Common Consolidated Corporate Tax Base (CCCTB),” https://ec.europa.eu/taxation_customs/business/company-tax/common-consolidated-corporate-tax-base-ccctb_en. Switzerland has an optional allowance for corporate equity at the cantonal level, which is currently only in effect in the canton of Zurich. See PwC, “Worldwide Tax Summaries: Corporate – Deductions,” https://taxsummaries.pwc.com/switzerland/corporate/deductions.
[21] Bloomberg Tax, “Country Guides;” PwC, “Worldwide Tax Summaries: Corporate – Deductions”; and Spengel, Schmidt, Heckemeyer, and Nicolay, “Effective Tax Levels Using the Devereux/Griffith Methodology.”
[22] Christopher J. Coyne and Lotta Moberg, “The Political Economy of State-Provided Targeted Benefits,” The Review of Austrian Economics 28:3 (June 2014), 337.
[23] Jason J. Fichtner and Jacob M. Feldman, “The Hidden Costs of Tax Compliance,” George Mason University, Mercatus Center, May 20, 2013, http://mercatus.org/sites/default/files/Fichtner_TaxCompliance_v3.pdf.
[24] Rachel Griffith, Helen Miller, and Martin O’Connell, “Ownership of Intellectual Property and Corporate Taxation,” Journal of Public Economics 112 (April 2014): 12–23, https://sciencedirect.com/science/article/pii/S0047272714000103.
[25] OECD, “Action 5: Agreement on Modified Nexus Approach for IP Regimes,” 2015, https://oecd.org/ctp/beps-action-5-agreement-on-modified-nexus-approach-for-ip-regimes.pdf; and OECD, “Harmful Tax Practices – Peer Review Results,” January 2022, http://oecd.org/tax/beps/harmful-tax-practices-peer-review-results-on-preferential-regimes.pdf.
[26] Bloomberg Tax, “Country Guides;” PwC, “Worldwide Tax Summaries: Corporate – Tax credits and incentives,” https://taxsummaries.pwc.com/australia/corporate/tax-credits-and-incentives; and OECD, “Intellectual Property Regimes – Corporate tax statistics,” https://data-explorer.oecd.org/.
[27] This does not imply that R&D credits do not meet their policy goal of fostering innovation through R&D activity, technology transfer, and entrepreneurship. See IMF, “Acting Now, Acting Together,” April 2016, https://imf.org/en/Publications/FM/Issues/2016/12/31/Acting-Now-Acting-Together. However, R&D credits benefit certain firms and industries more than others, creating distortions in the economy. See Gary Guenther, “Research Tax Credit: Current Law and Policy Issues for the 114th Congress,” Congressional Research Service, Mar. 13, 2015, https://fas.org/sgp/crs/misc/RL31181.pdf, and Fulvio Castellacci and Christine Mee Lie, “Do the effects of R&D tax credits vary across industries? A meta-regression analysis,” Research Policy 44:4 (May 2015), 819-832, https://sciencedirect.com/science/article/abs/pii/S0048733315000128.
[28] Deloitte, “International Tax– Italy Highlights 2022,” January 2022, https://www2.deloitte.com/content/dam/Deloitte/global/Documents/Tax/dttl-tax-italyhighlights-2023.pdf .
[29] Andreas Lichter et al., “Profit Taxation, R&D Spending, and Innovation,” American Economic Journal: Economic Policy, 2024, https://aeaweb.org/articles?id=10.1257/pol.20220580&from=f; Dominika Langenmayr and Rebecca Lester, “Taxation and Corporate Risk Taking,” The Accounting Review, May 2018, https://publications.aaahq.org/accounting-review/article-abstract/93/3/237/4039/Taxation-and-Corporate-Risk-Taking.
[30] OECD, “Implied tax subsidy rates on R&D expenditures,” https://data-explorer.oecd.org/. The measure used in the Index is the average implied tax subsidy rate of loss-making and profitable SMEs and large firms.
[31] KPMG, “Taxation of the digitalized economy: Developments summary,” updated Jun. 24, 2024, https://kpmg.com/kpmg-us/content/dam/kpmg/pdf/2023/digitalized-economy-taxation-developments-summary.pdf.
[32] PwC, “OECD Pillar Two country tracker,” updated Jul. 7, 2024, https://pwc.com/gx/en/services/tax/pillar-two-readiness/country-tracker.html.
[33] EY, “Worldwide Corporate Tax Guide 2023.”
[34] Ibid.
[35] OECD, “Revenue Statistics – OECD countries: Comparative tables,” https://stats.oecd.org/Index.aspx?DataSetCode=REV. The measure used in the Index is tax revenue as a percent of total taxation, code 1300: Unallocable between 1100 and 1200.
[36] Daniel Bunn and Cecilia Perez Weigel, “Sources of Government Revenue in the OECD.”
[37] Alex Durante, “2024 Tax Brackets,” Tax Foundation, Nov. 9, 2023, https://taxfoundation.org/data/all/federal/2024-tax-brackets/.
[38] OECD, “Top statutory personal income tax rate and marginal tax rate for employees at the earnings threshold where the top statutory personal income tax rate first applies,” updated July 2024, https://data-explorer.oecd.org/. Employee social security taxes are included when these are not phased out before the top threshold and the combined rate is higher than the top statutory rate.
[39] Ibid.
[40] Ibid.
[41] The marginal tax burden faced by an average worker in a country and the total tax cost of labor for an average worker in a country are called the marginal and average tax wedge, respectively. The tax wedge includes income taxes and social security contributions (both the employee-side and employer-side). The ratio of marginal to average tax wedges is calculated using the OECD data of marginal and average total tax wedges at four levels of income for single individuals without dependents. It is the average of marginal total tax wedges at 67 percent, 100 percent, and 167 percent of average earnings divided by the average of total tax wedges at 67 percent, 100 percent, and 167 percent of average earnings.
[42] Cristina Enache, “A Comparison of the Tax Burden on Labor in the OECD,” Tax Foundation, May 31, 2024, https://taxfoundation.org/data/all/global/tax-burden-on-labor-oecd-2024/.
[43] Colombia’s ratio is 0. However, this is because a single worker earning the nation’s average wage does not pay personal income tax.
[44] OECD, “Labour taxation – average and marginal tax wedge decompositions,” updated June 2024, https://data-explorer.oecd.org/.
[45] Taylor LaJoie and Elke Asen, “Double Taxation of Corporate Income in the United States and the OECD,” Tax Foundation, Jan. 13, 2021, https://taxfoundation.org/double-taxation-of-corporate-income/.
[46] Jan Södersten, “Why the Norwegian Shareholder Income Tax is Neutral,” International Tax and Public Finance, Apr. 26, 2019, https://link.springer.com/content/pdf/10.1007/s10797-019-09544-x.pdf.
[47] Daniel Bunn and Elke Asen, “Savings and Investment: The Tax Treatment of Stock and Retirement Accounts in the OECD,” Tax Foundation, May 26, 2021, https://taxfoundation.org/savings-and-investment-oecd/.
[48] Erica York, “An Overview of Capital Gains Taxes,” Tax Foundation, Apr. 16, 2019, https://www.taxfoundation.org/capital-gains-taxes/.
[49] The average 2023 GBP-USD exchange rate was used. See IRS, “Yearly Average Currency Exchange Rates,” https://irs.gov/individuals/international-taxpayers/yearly-average-currency-exchange-rates.
[50] Deloitte, “Tax Guides and Highlights.”
[51] Bloomberg Tax, “Country Guide”; PwC, “Quick Charts: Capital gains tax (CGT) rates,” https://taxsummaries.pwc.com/quick-charts/capital-gains-tax-cgt-rates; and PwC, “Worldwide Tax Summaries: Individual – Income determination,” https://taxsummaries.pwc.com/. When the capital gains tax rate varies by type of asset sold, the tax rate applying to the sale of listed shares after an extended period of time is used. Includes surtaxes if applicable.
[52] OECD, “Combined (corporate and shareholder) statutory tax rates on dividend income, Net personal tax,” updated July 2024, https://data-explorer.oecd.org/.
[53] There are other types of consumption taxes, such as excise taxes. However, these are generally narrowly based, as they are levied on specific goods, services, and activities, rather than all final consumption. The Index only considers general consumption taxes (VAT and retail sales tax).
[54] Janelle Fritts and Jared Walczak, 2024 State Business Tax Climate Index, Tax Foundation, Oct. 24, 2023, https://taxfoundation.org/research/all/state/2024-state-business-tax-climate-index/.
[55] OECD, “Taxes on Consumption: Value Added Tax/Goods and Services Tax (VAT/GST) (1976-2023): VAT/GST: standard and any reduced rates (2023),” https://www.oecd.org/tax/consumption/vat-gst-annual-turnover-concessions-ctt-trends.xlsx/. The US sales tax rate is the average of all US state sales tax rates (weighted by population). See Janelle Fritts, “State and Local Sales Tax Rates, 2024,” Tax Foundation, Feb. 6, 2024, https://taxfoundation.org/data/all/state/2024-sales-taxes/. The Canadian consumption tax rate is the average of all Canadian province tax rates (weighted by population). See Retail Council of Canada, “Sales Tax Rates by Province,” https://retailcouncil.org/resources/quick-facts/sales-tax-rates-by-province/.
[56] The VAT exemption thresholds listed in the Index generally apply to resident businesses. Nonresident businesses might face different thresholds.
[57] Measured in US dollars (purchasing power parity, PPP).
[58] OECD, “Taxes on Consumption: Value Added Tax/Goods and Services Tax (VAT/GST) (1976-2023): VAT/GST: Registration/Collection Thresholds (2023).”
[59] The same concept can be applied to retail sales taxes.
[60] The VAT Revenue Ratio was calculated using the following formula in line with the OECD’s VRR calculations: VRR = VAT Revenue/[(Consumption – VAT revenue) x standard VAT rate]. The calculations are based on OECD, “Consumption Tax Trends 2018,” Dec. 5, 2018, https://read.oecd-ilibrary.org/taxation/consumption-tax-trends-2018_ctt-2018-en#page92.
[61] Colin Miller and Anna Tyger, “The Impact of a Financial Transaction Tax,” Tax Foundation, Jan. 23, 2020, https://taxfoundation.org/financial-transaction-tax/.
[62] Huaqun Li and Karl Smith, “Analysis of Sen. Warren and Sen. Sanders’ Wealth Tax Plans,” Tax Foundation, Jan. 27, 2020, https://taxfoundation.org/wealth-tax/; Cristina Enache, “The Hight Cost of Wealth Taxes,” Tax Foundation, Jun. 26, 2024, https://taxfoundation.org/research/all/eu/wealth-tax-impact/.
[63] When the property tax base is set at the sub-national level, the Index evaluates the most representative model. For example, effective from 2025, the German state of Baden-Württemberg only taxes the value of the land. However, most states use the federal model, which also taxes to the value of buildings. See https://grundsteuerreform.de/.
[64] Deloitte, “Tax Guides and Highlights,” https://dits.deloitte.com/#TaxGuides; Bloomberg Tax, “Country Guides”; and PwC, “Worldwide Tax Summaries: Corporate – Income Determination.”
[65] Author’s calculations using OECD, “OECD Revenue Statistics – OECD Countries: Comparative tables,” updated March 2024, https://data-explorer.oecd.org/ and IMF, “IMF Investment and Capital Stock Dataset, 1960-2019,” May 2021, https://infrastructuregovern.imf.org/content/dam/PIMA/Knowledge-Hub/dataset/IMFInvestmentandCapitalStockDataset2021.xlsx.
[66] Jared Walczak, “State Inheritance and Estate Taxes: Rates, Economic Implications, and the Return of Interstate Competition,” Tax Foundation, Jul. 17, 2017, https://taxfoundation.org/state-inheritance-estate-taxes-economic-implications/#_ftn84.
[67] Bloomberg Tax, “Country Guides”; and EY, “Worldwide Estate and Inheritance Tax Guide 2023,” https://ey.com/en_gl/tax-guides/worldwide-estate-and-inheritance-tax-guide.
[68] The average 2023 EUR-USD exchange rate was used. See IRS, “Yearly Average Currency Exchange Rates.”
[69] EY, “Worldwide Estate and Inheritance Tax Guide 2023.”
[70] OECD, “OECD Revenue Statistics – OECD Countries: Comparative tables.”
[71] Bloomberg Tax, “Country Guides”; EY, “Worldwide Estate and Inheritance Tax Guide 2023”; PwC, “Worldwide Tax Summaries: Individual Taxes – Other taxes.”
[72] Janelle Fritts and Jared Walczak, 2024 State Business Tax Climate Index.
[73] Deloitte, “Tax Guides and Highlights”; Bloomberg Tax, “Country Guides.”
[74] Luxembourg levies this tax on non-Luxembourg companies as well, but only on wealth held within Luxembourg. See Government of the Grand Duchy of Luxembourg, “Net wealth tax,” Mar. 22, 2017, http://guichet.public.lu/entreprises/en/fiscalite/impots-benefices/impots-divers/impot-fortune/index.html.
[75] PwC, “Worldwide Tax Summaries: Corporate Taxes – Other taxes.”
[76] Bloomberg Tax, “Country Guides – Other Taxes,” and “Country Guides – Special Industries,” https://bloomberglaw.com/product/tax/toc_view_menu/3380.
[77] PwC, “Worldwide Tax Summaries: Corporate Taxes.”
[78] EUR-Lex, “Council Directive 2008/7/EC, concerning indirect taxes on the raising of capital,” February 2008, http://eur-lex.europa.eu/legal-content/EN/ALL/?uri=CELEX:32008L0007.
[79] Bloomberg Tax, “Country Guides;” and PwC, “Worldwide Tax Summaries: Corporate Taxes.”
[80] Ibid.
[81] Colin Miller and Anna Tyger, “The Impact of a Financial Transaction Tax.”
[82] Ibid.
[83] Narine Nersesyan, “Chapter 3: The Current International Tax Architecture: A Short Primer,” in Corporate Income Taxes under Pressure Why Reform Is Needed and How It Could Be Designed (Washington, D.C.: International Monetary Fund, 2021), https://imf.org/en/Publications/Books/Issues/2021/03/01/Corporate-Income-Taxes-under-Pressure-Why-Reform-Is-Needed-and-How-It-Could-Be-Designed-48604.
[84] Ibid.
[85] Kyle Pomerleau, “A Hybrid Approach: The Treatment of Foreign Profits under the Tax Cuts and Jobs Act,” Tax Foundation, May 3, 2018, https://taxfoundation.org/treatment-foreign-profits-tax-cuts-jobs-act/.
[86] Daniel Bunn and Sean Bray, “What’s in the New Global Tax Agreement?” Tax Foundation, Jun. 13, 2023, https://taxfoundation.org/global-tax-agreement/.
[87] PwC, “OECD Pillar Two country tracker,” as of Jul. 7, 2024, https://pwc.com/gx/en/services/tax/pillar-two-readiness/country-tracker.html.
[88] Kyle Pomerleau, Daniel Bunn, and Thomas Locher, “Anti-Base Erosion Provisions and Territorial Tax Systems in OECD Countries,” Tax Foundation, Jul. 7, 2021, https://taxfoundation.org/anti-base-erosion-territorial-tax-systems.
[89] Deloitte, “Tax Guides and Highlights 2022”; Bloomberg Tax, “Country Guide”; EY, “Worldwide Corporate Tax Guide 2021”; and PwC, “Worldwide Tax Summaries.”
[90] Ibid.
[91] Deloitte, “Tax Guides and Highlights – Portugal Highlights 2023,” https://deloitte.com/content/dam/Deloitte/global/Documents/Tax/dttl-tax-portugalhighlights-2023.pdf.
[92] Deloitte, “Tax Guides and Highlights – Italy Highlights 2023,” https://deloitte.com/content/dam/Deloitte/global/Documents/Tax/dttl-tax-italyhighlights-2023.pdf.
[93] Deloitte, “Tax Guides and Highlights 2023”; Bloomberg Tax, “Country Guide”; EY, “Worldwide Corporate Tax Guide 2022”; and PwC, “Worldwide Tax Summaries.”
[94] Deloitte, “Domestic rates: Withholding tax,” https://dits.deloitte.com/#DomesticRatesSubMenu.
[95] EY, “Worldwide Corporate Tax Guide: 2022.” The source may not include all active tax treaties, potentially underestimating the scope of tax treaty networks. Tax treaties with former countries, such as the USSR, Yugoslavia, and Czechoslovakia, are not counted as one. Every country the treaty applies to is counted individually.
[96] Thomas Hoppe, Deborah Schanz, Susann Sturm, and Caren Sureth-Sloane, “The Tax Complexity Index – A Survey-Based Country Measure of Tax Code and Framework Complexity,” TRR 266 Accounting for Transparency Working Paper Series No. 5, WU International Taxation Research Paper Series No. 2019-06, Sept. 16, 2020, https://papers.ssrn.com/sol3/papers.cfm?abstract_id=3469663.
[97] Kyle Pomerleau, Daniel Bunn, and Thomas Locher, “Anti-Base Erosion Provisions and Territorial Tax Systems in OECD Countries.”
[98] European Commission, “The Anti Tax Avoidance Directive,” Jan. 28, 2016, https://ec.europa.eu/taxation_customs/anti-tax-avoidance-directive_en.
[99] Sebastian Dueñas and Daniel Bunn, “Tax Avoidance Rules Increase the Compliance Burden in EU Member Countries,” Tax Foundation, Mar. 28, 2019, https://taxfoundation.org/eu-tax-avoidance-rules-increase-tax-compliance-burden/.
[100] Bloomberg Tax, “Country Guides: Anti-Avoidance Provisions – Controlled Foreign Company (CFC) Rules,” https://bloomberglaw.com/product/tax/bbna/chart/3/10077/347a743114754ceca09f7ec4b7015426; and PwC, “Worldwide Tax Summaries: Corporate – Group taxation,” https://taxsummaries.pwc.com/australia/corporate/group-taxation.
[101] Jennifer Blouin, Harry Huizinga, Luc Laeven, and Gaëtan Nicodème, “Thin Capitalization Rules and Multinational Firm Capital Structure,” International Monetary Fund Working Paper WP/14/12, January 2014, https://imf.org/external/pubs/ft/wp/2014/wp1412.pdf.
[102] Ibid.
[103] For more details, see “Allowance for Corporate Equity” in the ITCI section “Corporate Income Tax.”
[104] Bloomberg Tax, “Country Guides: Anti-Avoidance Provisions – Thin Capitalization/Other Interest Deductibility Rules,” https://bloomberglaw.com/product/tax/bbna/chart/3/10077/a8a08d05c9450b676b4d835dbb64348c; and PwC, “Worldwide Tax Summaries: Corporate – Group taxation.”
[105] Daniel Bunn and Sean Bray, “What’s in the New Global Tax Agreement?,” Tax Foundation, Jul. 11, 2024, https://taxfoundation.org/global-tax-agreement/.
[106] Kyle Pomerleau, Daniel Bunn, and Thomas Locher, “Anti-Base Erosion Provisions and Territorial Tax Systems in OECD Countries.”
[107] To calculate the standard deviation, we find the mean of a variable (corporate tax rates, for example) and the difference of each country’s tax rate from the mean tax rate among the 38 countries. We then take each country’s difference from the mean and find the average difference for the group.
[108] The true normal score is 0.5. The score is a negative value to reflect the fact that being higher than the OECD average is less ideal.
Share this article