Key Findings
- Wealth taxes on ultra-wealthy households have been proposed by Democratic presidential candidates to fight against inequality and raise extra revenue but there is substantial uncertainty about how much revenue can be raised.
- Comparing wealth taxes to income taxes shows how seemingly low rates on wealth equate to high income taxA tax is a mandatory payment or charge collected by local, state, and national governments from individuals or businesses to cover the costs of general government services, goods, and activities. rates.
- Wealth taxes in European countries have had disappointing results and many have been phased out.
- A wealth taxA wealth tax is imposed on an individual’s net wealth, or the market value of their total owned assets minus liabilities. A wealth tax can be narrowly or widely defined, and depending on the definition of wealth, the base for a wealth tax can vary. would face serious administrative and compliance challenges due to valuation difficulties and tax evasion and avoidance issues.
- Using the Tax Foundation’s wealth tax model, and after factoring in the macroeconomic feedback effects, we estimate that Sen. Elizabeth Warren’s proposal would raise about $2.2 trillion and Sen. Bernie Sanders’ plan would raise $2.6 trillion over the 10-year period from 2020-2029.
- Warren’s wealth tax would reduce long-run GDP by 0.37 percent, while Sanders’ plan would decrease it by 0.43 percent. Given that the model assumes an almost completely open economy with highly efficient international capital markets, the wealth tax also could have dramatic short-run effects—including a more than doubling of the trade deficit.
- A wealth tax would induce foreign inflows of hundreds of billions of dollars a year to replace reductions in U.S. savings, which would cause international investors to replace home-grown billionaires as owners of capital.
Stay informed on the tax policies impacting you.
Subscribe to get insights from our trusted experts delivered straight to your inbox.
SubscribeIntroduction
Since Democratic presidential hopeful Sen. Elizabeth Warren (D-MA) proposed “The Ultra-Millionaires Tax” in January 2019,[1] the idea of a wealth tax to combat income and wealth inequality has been near the forefront of the policy debate. Both Sen. Warren and fellow presidential candidate Sen. Bernie Sanders (I-VT) have released proposals to tax wealth as part of their 2020 platforms.
Sen. Warren’s original proposal would tax household net wealth above $50 million at a 2 percent rate per year and above $1 billion at a 3 percent rate. Sen. Warren boosted the size of the billionaire’s wealth surcharge to 6 percent from 3 percent when she released her plan to pay for Medicare for All.[2]
In September 2019, Sen. Sanders proposed his version of a wealth tax plan: a 1 percent tax on wealth above $32 million for married couples ($16 million for singles) that increases to 8 percent for wealthier households. Net worth for joint filers between $50 million to $250 million would be taxed at 2 percent, $250 to $500 million at 3 percent, $500 million to $1 billion at 4 percent, $1 billion to $2.5 billion at 5 percent, $2.5 billion to $5 billion at 6 percent, $5 billion to $10 billion at 7 percent, and 8 percent on net wealth over $10 billion.[3]
A wealth tax is just one of many 2020 presidential campaign tax plans with a focus on raising revenue primarily from the rich. Other tax plans include taxing inheritance more heavily,[4] taxing financial transactions, and taxing capital gains as they accrue (also called a “mark-to-market” regime).[5] A wealth tax is unique, however, in that it would impose an entirely new tax structure separate from the current federal income, payroll, estate, and consumption taxA consumption tax is typically levied on the purchase of goods or services and is paid directly or indirectly by the consumer in the form of retail sales taxes, excise taxes, tariffs, value-added taxes (VAT), or an income tax where all savings is tax-deductible. es.
Wealth taxes have been imposed in many European countries, but most have been subsequently repealed in recent decades due to difficulties in administration and low efficiency in raising revenue. The proponents of Sen. Warren’s wealth tax claim that European experience is not relevant,[6] and that their design differs from that implemented in European countries. The proposed wealth tax would have a broader asset base with guardrails against tax avoidance from international migration. Nonetheless, the administrative challenges of enforcing an unprecedented wealth tax almost certainly remain.
Although the idea of a wealth tax has gained popularity in recent public opinion polls, the tax policy field and academic community are still debating how much revenue a wealth tax could raise.
Most existing revenue estimates for wealth taxes are so-called conventional scores that do not account for economic feedback. There is concern among economists, as well as the general public, that wealth taxes could discourage domestic saving and investment, reducing capital accumulation and consequently weakening long-run economic growth. The Tax Foundation’s General Equilibrium Model dynamically simulates the macroeconomic effect of a wealth tax and quantifies these concerns.
Wealth Tax Basics
Wealth taxes are imposed on the market value of total assets minus the market value of total liabilities owned by households. In the current U.S. tax system, the estate taxAn estate tax is imposed on the net value of an individual’s taxable estate, after any exclusions or credits, at the time of death. The tax is paid by the estate itself before assets are distributed to heirs. is a special case of the wealth taxes, imposed at a single point in time. Property taxes are superficially similarly to a wealth tax; however, they do not subtract out liabilities. Economically, this makes them more akin to a user feeA user fee is a charge imposed by the government for the primary purpose of covering the cost of providing a service, directly raising funds from the people who benefit from the particular public good or service being provided. A user fee is not a tax, though some taxes may be labeled as user fees or closely resemble them. .[7]Comprehensive wealth taxes have never been implemented in the United States, and as such, American taxpayers are largely unfamiliar with this type of a tax. Thus, it may be easier to understand the basics of a wealth tax by comparing it to individual income taxes, which have been a main source of U.S. federal revenue since the late 1940s.[8]
Specification of the Wealth Tax BaseThe tax base is the total amount of income, property, assets, consumption, transactions, or other economic activity subject to taxation by a tax authority. A narrow tax base is non-neutral and inefficient. A broad tax base reduces tax administration costs and allows more revenue to be raised at lower rates.
The base of a wealth tax can be broadly or narrowly defined. Depending on the definition of wealth, the base for a wealth tax can vary. In contrast to the narrowly designed property taxA property tax is primarily levied on immovable property like land and buildings, as well as on tangible personal property that is movable, like vehicles and equipment. Property taxes are the single largest source of state and local revenue in the U.S. and help fund schools, roads, police, and other services. base described above, Sen. Warren has proposed a broad-based wealth tax plan, applying to both domestic and foreign assets of U.S. citizens.
Economists Emmanuel Saez and Gabriel Zucman, who have consulted with presidential candidates on their tax plans, define net wealth as financial and nonfinancial assets at their market prices, net of debts.[9] Financial assets include corporate equity, private business assets, and other fixed income assets, such as liquid assets and deposits, bonds, and mutual funds. The nonfinancial assets include real estate properties, land, and buildings. They exclude durable goods, nonprofits, and human capital from their wealth definition.
Wealth taxes generally have an exemption amount which is excluded from the tax base. Current OECD countries with a net wealth tax adopt different wealth tax bases.[10] For example, France, Spain, and Sweden are reported to exempt business assets from their wealth taxes due to the concern that including them in the base would discourage productive assets investment.[11]
The Wealth Tax Rate and Implications for After-tax Return
Compared to income taxes, wealth tax rates seem much lower, but this rate can be deceptive. The best way to interpret wealth tax rates is to translate them into an equivalent income tax rate. For example, consider an investor who owns a long-term bond with a fixed rate of return at 5 percent each year. A 3 percent annual wealth tax would imply that 60 percent of the capital income from owning the long-term bond would be remitted as tax—the 3 percent wealth tax translates to a 60 percent income tax rate in this example. A 5 percent annual wealth tax would equal a 100 percent income tax rate, because the wealth tax would take all this taxpayer’s capital income. A 10 percent wealth tax, calculated in the same manner, implies that all capital income earned in this year plus part of the stock would have to be turned over as taxes, which means a 200 percent income tax.
The after-tax rates of return for these scenarios are presented in Table 1. Under the assumption of a fixed pretax return of 5 percent, an annual wealth tax of 10 percent results in a negative rate of return at -5 percent.
|
Source: Author’s calculations. |
||||
| Pretax return | Annual wealth tax rate | Implied income tax rate | After-tax return | |
|---|---|---|---|---|
| Scenario A | 5% | 2% | 40% | 3% |
| Scenario B | 5% | 3% | 60% | 2% |
| Scenario C | 5% | 5% | 100% | 0% |
| Scenario D | 5% | 10% | 200% | -5% |
Seemingly low 2 percent and 3 percent wealth tax rates imply much higher income tax rates; in this example, 40 percent and 60 percent, respectively. For safe investments like bonds or bank deposits, a wealth tax of 2 or 3 percent may confiscate all interest earnings, leaving no increase in savings over time. A wealth tax of 6 or 8 percent will certainly reduce wealth accumulation for such low-risk and low-return investment. Asset owners with 6 or 8 percent return on higher-risk investments, such as private equity funds or corporate stocks, may still be able to accumulate wealth. However, they still face capital gains and dividend taxes, state and local income taxes, property taxes, and other taxes.
Wealth Tax Burden Falls Heavily on Normal Returns instead of Supernormal ReturnSupernormal returns are payoffs to investment greater than the typical market rate of return. They are often approximated as company profits that exceed 10 percent. This additional return on capital or labor is above breaking even on an investment relative to the amount of risk and time that investment required. s
Even though taxing wealth through a wealth tax and taxing capital income through a capital income tax can collect the same amount of revenue when the rates are appropriately adjusted, these two taxes have different economic impacts.
A wealth tax imposes a heavier tax on the normal returns to capital than the supernormal returns. Normal return refers to the portion of a return below the investor’s risk-free discount rate. Earning this level of return does not make the investor any better off, rather, it means the investor has simply earned enough return to cover the cost of the initial investment, in present value terms. Supernormal return refers to the portion of return which exceeds the investor’s discount rate—the amount by which the investor is better off or does receive an increase in welfare. Ideally, the normal return to investment would be excluded from tax, as it does not represent an increase in welfare, while supernormal returns would be taxed the same as other income. Wealth taxes violate this ideal.
For three investors with different pretax returns, as specified in Table 2, a 5 percent annual wealth tax results in different tax burdens, illustrating the differential impact on normal and supernormal returns. For a lower-return asset with a 2 percent expected pretax return, a 5 percent wealth tax means a 250 percent income tax rate, but the same wealth tax applied to the supernormal return of 10 percent results in a 50 percent tax on its return.
|
Source: Author’s calculations. |
||||
| Pretax return | Annual wealth tax rate | Equivalent income tax rate | Return after wealth tax | |
|---|---|---|---|---|
| Scenario A | 2% | 5% | 250% | -3% |
| Scenario B | 5% | 5% | 100% | 0% |
| Scenario C | 10% | 5% | 50% | 5% |
Thus, a wealth tax would be less neutral toward normal rates of returns, placing a higher burden on those at the margin of deciding whether to consume now or invest for the future. On the contrary, a wealth tax is more neutral toward supernormal rates of return; investors achieving supernormal returns will be less sensitive to the extra layer of wealth tax since their wealth tax burden would be relatively lower.[12] These investors with supernormal returns would continue to enjoy windfall returns due to monopoly power, patents, or economic rents. Over the long run this could change the composition of wealth, as those with supernormal returns would be less burdened by the tax and thus able to continue accumulating wealth.
Difference in Taxing Capital
The current income tax on capital gains is levied when a gain is realized, meaning capital gains taxes are only collected when assets are sold and there is a gain between the time they are purchased and sold. Unrealized capital gains are not taxed, as the tax is deferred until they are realized. Wealthy people tend to defer realizing capital gains; the top 1 percent holds about half of the unrealized capital gains.[13] This is one of the reasons some argue that the wealthy do not pay enough in tax.
A wealth tax would theoretically reduce deferral and lock-in incentives, since wealth would be taxed on an accrual basis rather than realization basis. The accrual basis means that accrued gains and principal assets are taxed on a yearly basis instead of when the gains and assets are sold or realized. If the market value of assets and liabilities are properly and regularly valued, the wealth tax will be levied on the market value of capital assets on a yearly basis. However, the experience of the small number of countries with a wealth tax shows it is not an efficient way to raise revenue due to administrative difficulties and disappointing levels of revenue collection.[14]
The International Experience with a Wealth Tax
Many Organisation for Economic Co-operation and Development (OECD) countries imposed an annual tax on net wealth during the 1990s, but since then, the number has dropped significantly. As of 2019, only six OECD member countries—Norway, Spain, Switzerland, Belgium, the Netherlands, and Italy—administer an annual net wealth tax.[15] Among them, three countries have a highly exempted base. Italy imposes a net wealth tax only on assets that Italians hold abroad. The wealth tax in the Netherlands is embedded in the income tax system by levying income tax on the value of net wealth assets (with some exclusions). And the wealth tax in Belgium is an annual charge on financial securities beyond a threshold value. That is why some studies consider only Norway, Spain, and Switzerland to have a true wealth tax.[16]
Table 3 presents the net wealth tax rates and bases in these six OECD countries for 2018. The wealth tax rates currently implemented in OECD countries generally range from 0.1 percent to 0.7 percent, much lower than the rates proposed by 2020 presidential candidates.[17] The wealth tax bases in these countries are subject to different exemptions. For example, France, Spain, and Sweden are reported to exempt business assets from wealth tax due to the concern of discouraging productive assets investment.[18] A common feature for these countries is that wealth tax revenue collections account for far less than 1 percent of GDP among all six countries in Table 1, except Switzerland, where it raises almost 1.0 percent of GDP.
|
Source: OECD, “The Role and Design of Net Wealth Taxes in the OECD.” |
||
| Country | Rate | Base |
|---|---|---|
| Belgium | 0.15 percent | Average value of securities holdings if the value is greater than €500,000 (US $571,000) per account holder. |
| Italy | 0.2 percent for financial assets, 0.76 percent for real estate properties | Financial assets and real estate properties held abroad by Italian taxpayers. |
| Netherlands | 0.61 percent to 1.61 percent (effective) | Net wealth excluding primary residence and substantial interests in companies. Part of the income tax. |
| Norway | 0.7 percent at the municipality level and 0.15 percent at the national level | Fair market value of assets minus debt. Tax applies to value of wealth above NOK1.48 million ($174,400). |
| Spain | 0.2 percent to 2.5 percent depending on the region | May differ depending on the region, but generally value of assets minus value of liabilities. |
| Switzerland | Varies depending on the Canton | Gross assets minus debts. |
Several OECD countries, including Austria, Denmark, Germany, Finland, Iceland, Luxemburg, Ireland, and Sweden, chose to repeal their wealth tax during the last 30 years. The tax policy literature has identified the reasons for these repeals as limited revenue collection, administration and compliance cost, tax avoidance, and evasion.[19] The experience of enacting and then repealing wealth taxes indicates that they were not effective tools to redistribute wealth and narrow wealth inequality in these countries.
Administrative Issues with a Wealth Tax
Besides the constitutional issues related to wealth taxes, which are not discussed here, many other administrative problems need to be thought through before enacting a wealth tax in the U.S.
First, a wealth tax has a serious implementation problem due to the difficulty of obtaining the market value of taxed net assets. An annual wealth tax necessitates determining the market value of all taxable assets net liabilities every year. Publicly traded bonds and stocks and bank accounts are easy to value once an effective valuation date is predetermined. However, even with public markets, ownership through trusts or holding companies will make valuation difficult.[20] Additionally, privately held business assets, artwork collections, and farm assets would create significant valuation challenges. The high share of private business assets among the wealthy would aggravate this problem. Based on the data from the Federal Reserve’s Survey of Consumer Finances (SCF), Batchelder and Kamin[21] estimated that publicly traded assets only account for one-fifth of the assets held by the top 1 percent after excluding tax-exempt accounts, while private business assets represent more than one-half.
Second, America’s experience with the estate tax implies that tax avoidance and evasion would be another serious problem for implementing a wealth tax. Estate and gift taxes are essentially a wealth tax that happens when wealth is transferred through bequest or gift. The difficulty of wealth valuation on estate tax returns is harming its efficiency in raising revenue. An Internal Revenue Service (IRS) study found that wealth valuation from estate tax returns are on average only 50 percent of the valuation from the Forbes 400 list. Sarin and Summers[22] estimated that the wealthy may have avoided 40 percent of estate tax through tax planning and avoidance strategies. Both Sens. Warren and Sanders have proposed strengthening wealth tax compliance through expanding IRS funding. However, the IRS only needs to process around 4,000 estate tax returns each year, while under Warren’s plan to tax the wealth of the top 0.1 percent, roughly 75,000 wealth tax returns would need to be processed. The administrative challenge will be enormous.
Revenue Effects of Wealth Taxation
The Controversy Related to Wealth Tax Revenue Estimation
The administrative data on the distribution of the market value of net wealth is limited. The Federal Reserve Board provides quarterly data on aggregate measures of household wealth in its Financial Accounts of the United States. The Federal Reserve also publishes a triennial “Survey of Consumer Finances” (SCF) that includes both aggregate wealth data and wealth distribution information in the U.S. The problem with using SCF data to estimate wealth is that it is based on voluntary survey responses; that it intentionally excludes “the Forbes 400 Richest Americans”; and that the nonresponse rate for the very richest households is high. All these problems subject wealth estimation to uncertainty.
Individual income taxAn individual income tax (or personal income tax) is levied on the wages, salaries, investments, or other forms of income an individual or household earns. The U.S. imposes a progressive income tax where rates increase with income. The Federal Income Tax was established in 1913 with the ratification of the 16th Amendment. Though barely 100 years old, individual income taxes are the largest source of tax revenue in the U.S. data and estate tax data from the IRS have been used to derive more detailed information on the wealth distribution, especially the net wealth at the top. The income capitalization approach and the estate tax multiplier approach have been applied to these two tax datasets to estimate the distribution of wealth.
The income capitalization approach maps the flow of observed income to the household wealth in the Financial Accounts of the United States to estimate the distribution. This approach depends highly on the selection of the capitalization factor, which can be derived using different assumptions. For example, Saez and Zucman[23] assumed a common yield on fixed income portfolios along the wealth distribution, consequently resulting in a common capitalization factor to derive fixed income wealth. Smith, Zidar, and Zwick[24] instead relaxed this assumption and used unequal capitalization factors within this asset class for different income groups. This adjustment decreases the wealth share of fixed income assets for the top 0.1 percent by half.
The estate multiplier approach assumes that estate tax returns represent a random sample of the living wealthy population.[25] This approach combines estate tax returns and appropriate mortality rates to estimate the wealth holdings of the wealthy population. The wealth estimate based on this approach highly depends on the assumption of mortality difference across the wealth distribution, as well as the estate tax avoidance and evasion rate. An updated estimation by Saez and Zucman[26] explains how the difference in the life expectancy between the very rich and the rest of the population changes the wealth concentration estimates for the top 0.1 percent.
A review of existing studies on wealth tax revenue estimation revealed that there remains considerable uncertainty and disagreement on the level and composition of the top wealth in the United States. The following review is focused on Sen. Warren’s wealth tax plan of 2 percent on net wealth over $50 million and 3 percent on net wealth over $1 billion, proposed in January 2019.[27]
Saez and Zucman[28] estimated that Warren’s wealth tax proposal would raise approximately $2.75 trillion in government revenue between 2019 and 2028. They use SCF and the Distributional National Accounts (DINA) created by themselves to estimate the wealth distribution and wealth tax base.
Summers and Sarin[29] pointed out that the revenue estimates for Warren’s wealth tax plan are flawed due to incorrect assumptions. Using extrapolated wealth data from estate tax receipts, Summers and Sarin estimated that Warren’s tax plan would collect only 12 to 40 percent of what Saez and Zucman[30] predicted.
Batchelder and Kamin[31] pointed out that using the wealth estimation of the top 0.1 percent published by the IRS, the calculated wealth tax revenue for Warren’s plan would be close to Summers and Sarin’s estimation.
Using only the data from the SCF, Batchelder and Kamin estimated that Warren’s wealth tax plan would raise $2.6 trillion from 2021 through 2030, assuming a 15 percent avoidance rate.[32] Their revenue estimation is close to Saez and Zucman’s initial estimate.
Smith, Zidar, and Zwick[33] used more refined information than Saez and Zucman in deriving wealth distribution from income data. For example, they indicated that the returns are not the same across different kinds of fixed income assets. Thus, it is necessary to decrease the weight of capital gains when inferring the gains from the sale of C corporation stock. After all these refinements, their revenue estimation for Warren’s plan was only half of Saez and Zucman’s original estimation.[34]
Saez and Zucman[35] reestimated Warren’s wealth tax revenue by incorporating some of the improvements suggested by Smith, Zidar, and Zwick[36] (2019). However, their new estimate reduced the tax base on wealth over the threshold of $50 million by only around 7 percent of national income.
Revenue estimation also highly depends on the assumption of tax evasion and avoidance rate. There is limited but growing literature on the behavioral response triggered by recurrent wealth taxation. As explained in Jakobsen et al.,[37] the challenge of estimating the elasticity of taxable wealth comes from different perspectives.[38] First, administrative data on wealth holdings are very limited because only the most wealthy individuals are included in the tax base. Second, variation in wealth taxation in the real world that would allow for estimating causal effects is difficult to find. Third, the slow-moving dynamic nature of wealth accumulation has deterred the estimation of long-run effects of wealth taxation.
A comprehensive literature review[39] on behavioral response of taxable wealth indicates that the semi-elasticities with respect to a 1 percentage point decrease in wealth tax rate range from 0.3 percent (as reported in Seim, 2017 for Sweden[40]) to 43 percent (as reported in Brülhart et al., 2019 for Switzerland[41]) across six countries: Sweden, Denmark, Colombia, the Netherlands, Denmark, Spain, and Switzerland. The estimation methodology, as well as the design and implementation features of the wealth taxes, differ across countries in the literature review.
Saez and Zucman average four studies on wealth tax avoidance and evasion to conclude that the evasion rate is 15 percent.[42] They assumed a 1 percent wealth tax would reduce reported wealth by 8 percent and applied this elasticity to a 2 percent rate for all wealth taxpayers. The Penn Wharton Budget Model uses a semi-elasticity of taxable wealth of -13, a weighted average of the implied semi-elasticities from the existing empirical papers.[43]
It is highly unlikely that the IRS, even with increased funding, can collect the wealth tax more efficiently than the income tax, which relies on extensive employer reporting and withholdingWithholding is the income an employer takes out of an employee’s paycheck and remits to the federal, state, and/or local government. It is calculated based on the amount of income earned, the taxpayer’s filing status, the number of allowances claimed, and any additional amount of the employee requests. of wages. Wealthy taxpayers are believed to be more resourceful in underreporting income and evading taxes. It cannot be neglected that the tax avoidance and evasion rates for the wealth tax tend to increase as the wealth tax rate increases, which has been revealed in an empirical study of the wealth tax in Switzerland.[44]
Conventional Revenue Effects of Sen. Warren’s Wealth Tax Plans
Table 4 presents the year-by-year tax revenue estimates over the next decade (2020-2029). On a conventional basis, without including the effect of economic feedback, Sen. Warren’s wealth tax proposal would raise $2.6 trillion over the 10-year budget window. The estimate includes our assumption on taxpayers’ behavioral response in terms of illegal tax evasion and legal tax avoidance. Under the same avoidance assumption, Sen. Sanders’ plan will collect $3.2 trillion over 2020-2029.
|
Source: Author’s Calculations |
|||||||||||
| 2020 | 2021 | 2022 | 2023 | 2024 | 2025 | 2026 | 2027 | 2028 | 2029 | 2020-2029 | |
|---|---|---|---|---|---|---|---|---|---|---|---|
| Warren’s Plan | 203 | 215 | 226 | 239 | 253 | 267 | 282 | 299 | 317 | 335 | 2636 |
| Sanders’ Plan | 249 | 264 | 279 | 295 | 312 | 331 | 350 | 371 | 394 | 418 | 3261 |
Based on the existing revenue estimates of wealth taxation, this study used the most readily available wealth distribution data from the SCF benchmarked to the aggregate wealth data from the Financial Accounts of the United States to estimate tax revenue. The wealth tax base in this analysis is defined through following the net worth definition in the SCF.[45]
While the SCF includes wealth distribution information, the Financial Accounts of the United States provide closer to real-time detailed wealth aggregates as well as information on defined benefit pension plans and annuities. The recent SCF estimates tend to be higher than in the Financial Accounts of the United States.[46] The Federal Reserve economists have a detailed explanation on why survey respondents tend to overestimate their net worth, such as real estate.[47] This study consolidated two wealth datasets from Federal Reserve. The Federal Reserve has recently released the Distributional Financial Accounts (DFA) aiming to reconcile the Financial Accounts and the SCF. We adjusted the net worth from the SCF based on the gap between the SCF top 1 percent wealth and the counterpart from the DFA, which shrinks the size of the top 1 percent’s wealth from the SCF by 14.7 percent.
The most recently available SCF data is from 2016, and it excludes the Forbes 400 for confidentiality reasons. Our analysis adds to the 2016 SCF the net worth owned by the Forbes 400 richest people.[48] To project the tax revenue over the next years, both the SCF and Forbes wealth data are inflated to the nominal value for the next 10 years using the Congressional Budget Office projections of GDP growth. The average rate of GDP growth for the next 10 years is around 3.8 percent.[49]
The total wealth value from the Financial Accounts will be different from what is reported to the IRS. Under the current individual tax system, taxpayers may underreport their actual tax liability, or simply not file a tax return. Underreporting or nonfiling individual income tax would certainly lead to underreporting and nonfiling wealth tax, since the wealth tax base is where the income flow comes from. The taxpayers who hide their income will choose to hide their taxable assets too.
Based on the most recent IRS reports, the net compliance rate for tax years between 2008 and 2013 is about 85 percent.[50] We apply this compliance rate to the wealth tax base we estimated using the SCF and Financial Accounts. This compliance estimate is for all taxes combined, including individual income tax, corporate tax, payroll taxA payroll tax is a tax paid on the wages and salaries of employees to finance social insurance programs like Social Security, Medicare, and unemployment insurance. Payroll taxes are social insurance taxes that comprise 24.8 percent of combined federal, state, and local government revenue, the second largest source of that combined tax revenue. , estate tax, and excise taxAn excise tax is a tax imposed on a specific good or activity. Excise taxes are commonly levied on cigarettes, alcoholic beverages, soda, gasoline, insurance premiums, amusement activities, and betting, and typically make up a relatively small and volatile portion of state and local and, to a lesser extent, federal tax collections. . It is highly likely that the tax compliance rate of a brand-new wealth tax in the U.S. will be lower than the current tax system, which partially depends on employer reporting and the withholding system. Thus, this assumed tax compliance rate provides an optimistic estimate of static revenue. In addition, the compliance rate is applied to all wealth taxpayers without accounting for the positive relationship between the capacity of underreporting and wealth levels. This revenue estimate should be viewed as optimistic because it assumes the implemented wealth tax has the same compliance rate as the current tax system.
The literature review above revealed the extreme uncertainty of estimated elasticity of taxable wealth in different empirical studies for countries with a wealth tax. For comparison purposes, we follow the semi-elasticity assumption of -8 percent from the Warren campaign. This semi-elasticity implies that a 2 percentage-point increase in the wealth tax decreases the reported taxable wealth by around 15 percent.[51] Instead of applying a universal 15 percent tax avoidance rate for all wealth taxpayers as the Warren campaign did, our analysis assumes higher avoidance rates on higher wealth tax rates. The tax avoidance rate for those facing a 6 percent wealth tax is about 38 percent after applying the semi-elasticity.
As discussed above, a wealth tax levy will erode the process of wealth accumulation. Net worth under a wealth tax will not grow at the same rate as the baseline when there is no wealth taxation. We erode wealth accumulation by the effective wealth tax rate to account for this mechanical effect.
How Would a Wealth Tax Affect the Economy?
A wealth tax of the size and scope proposed by Sens. Warren and Sanders would have potentially profound effects on the U.S. economy, many of which are difficult to model. For example, economists have argued that the more successful the tax is at not only reducing large fortunes but also forestalling their very creation, the more the wealth tax is likely to alter entrepreneurship, venture capital funding, and even immigration of talent to the United States.[52]
This paper abstracts from most of those structural changes and instead focuses on the direct effect the wealth tax will have on saving and investment in the U.S. economy and by extension the flow of capital funds into the United States.
Saez and Zucman[53] (2019) argued that a reduction of U.S. saving due to the wealth tax will not necessarily translate into a significant reduction in the capital stock in the U.S. under the assumption of a small open economy. In the extreme case of a small open economy model without any market friction, a reduction in domestic saving would be fully offset by an increase in foreign investment.
The pair has also argued that a wealth tax with the threshold of $50 million would only apply to about 10 percent of household wealth and that any decrease in the capital stock due to a wealth tax can be offset through increased saving from the rest of the population.
These two points are somewhat in tension. To the extent that foreign capital flows into the United States, international investors will simply replace home-grown billionaires as owners of capital. In that case there is no incentive for ordinary Americans to increase their saving. There will, however, be profound effects on the balance of trade.
At the same time, some economists have suggested that a wealth tax may encourage the owners of large fortunes to put their assets to more productive use instead of letting their wealth sit in low-yielding bonds.[54] On one level this makes sense. Unless they reallocate towards higher yield investments, these taxpayers will see their wealth dwindle rapidly.
Conversely, the very fact that these investors have already chosen to forgo high-yielding investments suggests that extra return is not enough to compensate them for the risk or volatility associated with those assets. By lowering the after-tax return on all investments, a wealth tax would reduce further the number of investors willing to accept high levels of risk and volatility. Instead, the wealth tax would encourage those taxpayers who face it to consume their wealth as rapidly as possible. That consumption could take on many forms, from $100 million weddings[55] to $900 million per election cycle donations to political action committees[56] and untold amounts on personal presidential campaigns.
The Tax Foundation’s model attempts to chart a middle path between these alternatives. It assumes that the market for tradable securities, including corporate stock and government bonds, is completely open. Both C corporations and the U.S. government can receive financing from abroad without significantly altering global interest rates.
On the other hand, the model assumes that pass-through businessA pass-through business is a sole proprietorship, partnership, or S corporation that is not subject to the corporate income tax; instead, this business reports its income on the individual income tax returns of the owners and is taxed at individual income tax rates. es such as partnerships and S corporationAn S corporation is a business entity which elects to pass business income and losses through to its shareholders. The shareholders are then responsible for paying individual income taxes on this income. Unlike subchapter C corporations, an S corporation (S corp) is not subject to the corporate income tax (CIT). s cannot receive foreign capital inflows directly. This raises the service price of capital in these sectors and drives down investment in them.
Over time, U.S. investors may, however, choose to sell some of their financial capital to foreigners and reinvest in U.S. pass-through entities. In the Tax Foundation model, they do this because a wealth tax steadily erodes investment in pass throughs, thus opening profit opportunities for investors who previously held their assets in publicly traded securities.
The economic effect of a wealth tax is thus two-fold. The first effect is straightforward. A wealth tax directly shrinks investment in the pass-through sector. This will lead to a permanent long-run reduction in the level of GDP, productivity, and demand for labor.
The second effect is more complex. A wealth tax decreases U.S. investment in C corporations and government bonds. It does not, however, drive up the service price in these sectors nor decrease total investment. Instead, that investment is made up for by foreign financial inflows.
These foreign financial inflows will drive up the value of the dollar. The higher value of the dollar will cause an increase in U.S. consumption, an increase in U.S. imports from abroad, and a decrease in U.S. exports. The latter two factors combined will lead to a substantial increase in the U.S. trade deficit.
This second effect will drive down long-run GNP but in-and-of-itself it will not permanently change long-run productivity or the demand for labor in the United States. It will almost certainly have large transitional effects.
Long-run Effects of a Wealth Tax
The Tax Foundation estimates that Warren’s wealth tax would reduce long-run GDP by 0.37 percent, while Sanders’ would decrease it by 0.43 percent. We estimate that in the long run, wealth in the United States would be permanently reduced 7.19 percent under Warren’s plan and 10.21 percent in Sanders’. Applied to current wealth, those declines would be equal to $8.1 trillion and $11.5 trillion, respectively. Over time, as the size of the U.S. economy grew, the real dollar value in this wealth reduction would grow as well. This is because under the wealth tax, foreigners will own a larger fraction of U.S. businesses and capital assets in perpetuity.
Furthermore, the entire reduction in wealth is due to increased consumption by Americans. Collections from the wealth tax itself do not reduce the overall wealth in the United States. It simply converts it from private assets to a reduction in outstanding government bonds.
The Tax Foundation’s model assumes that wealth taxes are used to reduce the deficit. If policymakers wish to offset that deficit reduction with specific spending proposals, including public investments, then that should be considered a distinct proposal to be analyzed separately. After all, the U.S. government has access to global capital markets and may well consider borrowing to finance investments with returns greater than the cost of financing.
Because pass-through businesses do not have easy access to international capital markets, a wealth tax would reduce net investment somewhat, leading to a long-run fall in the U.S. capital stock of 0.69 percent under Warren’s plan and 0.81 percent under Sanders’. Once the economy has reached its long-run equilibrium, the net effect on the demand for labor is minimal under either proposal. The transitional effects, however, may be quite large.
|
Source: Tax Foundation General Equilibrium Model |
||||
| GDP | GNP | Capital Stock | Wealth | |
|---|---|---|---|---|
| Warren | -0.37% | -1.15% | -0.69% | -7.19% |
| Sanders | -0.43% | -1.65% | -0.81% | -10.21% |
The Transitional Effects of Effects of a Wealth Tax
The long-run effects on labor demand are minimal because foreign investment in publicly traded companies and government bonds will replace lost domestic investment. The transition to this long-run equilibrium, however, could be dramatic. While access to international capital markets reduces the wealth taxes’ impact on the total U.S. capital stock, it increases the financial volatility. There are likely to be enormous effects on all U.S. asset and commodity prices as financial markets adjust. If large enough, these adjustments could impair the short-term functioning of the economy. For example, standard economic analysis would suggest that among the adjustments will be a sharp collapse in U.S. stock and bond prices coupled with a rise in the dollar of equal speed and magnitude. This would leave the net price of U.S. stocks and bonds unchanged for foreign investors but would decrease the price, and hence increase the yield, for domestic investors. Over time, the dollar would then fall slowly, reducing the yield for foreigners in their own currency.
The distributional and indeed financial solvency and soundness implications of these changes is impossible to predict. Furthermore, the Tax Foundation’s model abstracts from the vast majority of those changes. Our primary analysis then will focus solely on net international capital flows and their implications for the balance of trade.
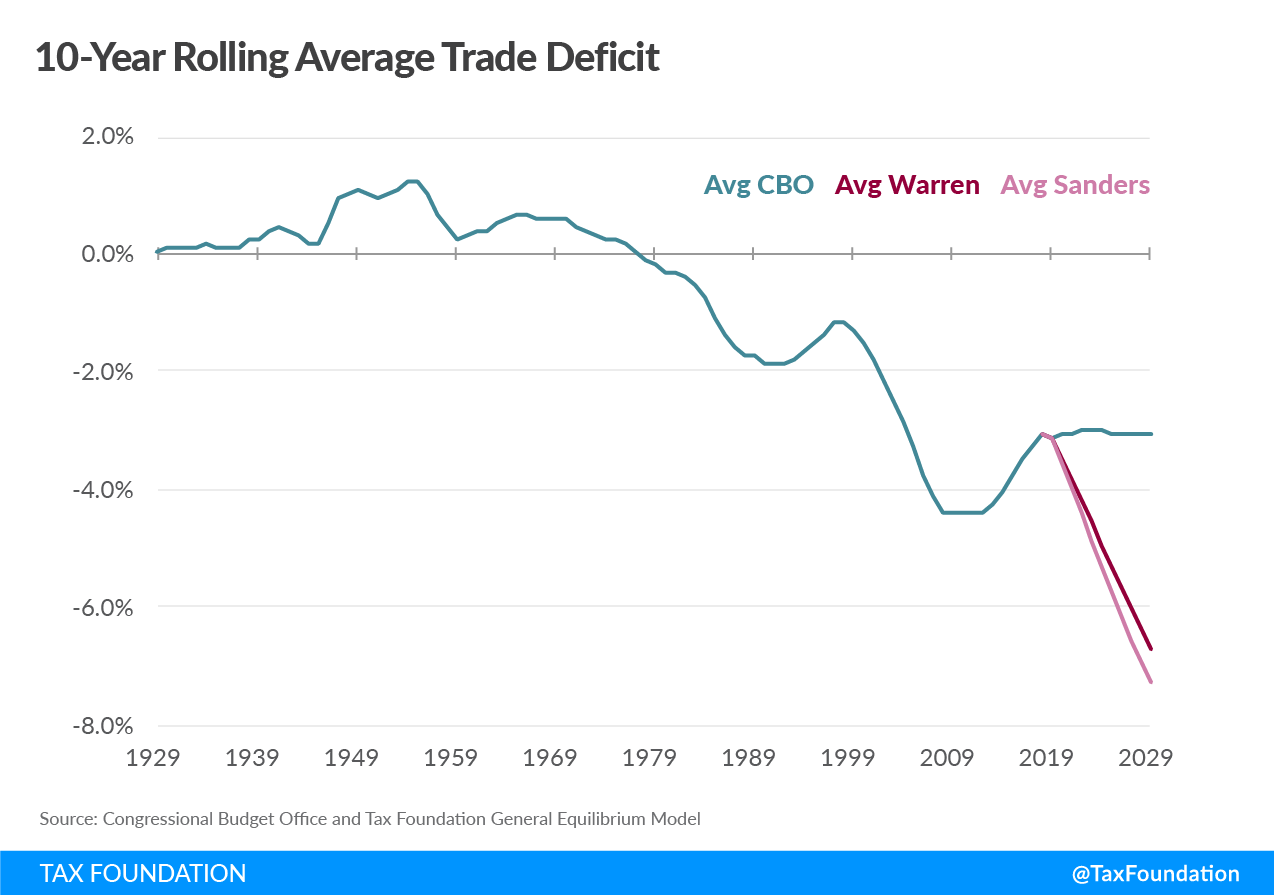
The Tax Foundation estimates that a wealth tax would cause the average trade deficit over the next 10 years to more than double under both Sen. Warren’ and Sen. Sanders’ proposals, from 3.1 percent of GDP to 6.94 percent and 7.53 percent, respectively. While shifts of this magnitude are large, they are not unprecedented. From 1999 to 2008 the 10-year average trade deficit rose from 1.2 percent to 4.4 percent. In percentage-point terms that change of 3.2 percentage points is in the range of, though somewhat less than, the transition expected from Warren’s plan at 3.7pp and Sanders’ plan at 4.1pp.
|
Source: Congressional Budget Office and Tax Foundation General Equilibrium Model |
|
| Average 2020-2029 Trade Deficit as Percent of GDP | |
|---|---|
| CBO | 3.10% |
| Warren | 6.94% |
| Sanders | 7.53% |
The period from the 1999 to 2008 corresponds with what some economists have dubbed China-Shock,[57] a rapid transition in the U.S. economy caused by the rise of China as a trading power. China-Shock has been associated with massive dislocations in manufacturing that left many small towns and rural areas struggling to cope.
The rapid readjustment caused by the wealth tax could mimic these effects. The causes are to a large extent mirror images of one another. From 2000 to 2010, China increased its reserve holdings of U.S. assets by nearly $2 trillion. That increase kept the value of the dollar relatively high compared to the Chinese Yuan, despite persistent trade imbalances.
Figure 1.
Stay informed on the tax policies impacting you.
Subscribe to get insights from our trusted experts delivered straight to your inbox.
SubscribeSimilarly, a wealth tax would induce foreign inflows of hundreds of billions of dollars a year to replace reductions in U.S. savings. Those inflows would drive up the value of the dollar and keep it elevated even as U.S. net exports collapsed.
Crucially, neither China-Shock nor a wealth tax increases the overall demand for U.S. labor. During the 1990s the dollar rose steadily as U.S. productivity increased, from gains in information technology. Real wages rose and the effects of dislocation were less pronounced in part because the rise of the dollar was accompanied by an increase in productivity and hence the demand for workers.[58]
Indeed, our Taxes and Growth model projects that the shift in the trade balance would be far more rapid, occurring almost instantaneously. In part this is because the model treats the tax change as a sudden and unexpected shift. In reality, markets would likely begin to adjust in anticipation of a wealth tax being implemented. The effect of the wealth tax on the dollar and the trade balance would grow more intense as passage of wealth tax legislation became more certain.
Nonetheless, extremely rapid shifts are possible. The U.S. went from running a trade deficit of 0.3 percent of GDP in 1945 to a trade surplus of 4.3 percent in 1947. This dramatic 5.2 percentage-point shift in the trade balance occurred in just three years, largely driven by a surge in U.S. exports.
Lastly, it’s important to note that increases in the trade deficit are not necessarily negative, nor are decreases in the trade deficit positive. One of the most common causes of a decline in the trade deficit is a large recessionA recession is a significant and sustained decline in the economy. Typically, a recession lasts longer than six months, but recovery from a recession can take a few years. . In general, for the United States, rapid growth will be accompanied by an increase in the trade deficit and slower growth by a decline or at least a reduction in the rate of increase.
What matters is both the cause of the change in the trade deficit and the speed and duration of the change. Slow, steady increases in the trade deficit accompanied by higher growth are more easily accommodated than rapid ongoing declines with no increase in overall output or the demand for workers.
Policymakers, however, should be aware that the wealth tax as constructed creates serious adjustment challenges. Furthermore, in recent years, politicians from both parties have shown increasing interest in reducing free trade and attempting to drive down the trade deficit. The Tax Foundation does not believe that such policies are generally conducive to growth and prosperity. Nonetheless, if those policies accomplish their objectives they will radically alter the results of this analysis.
With heavy restrictions on trade and/or the trade balance, foreign capital would not be able to flow into the U.S. to make up for lost savings. Under those circumstances a wealth tax would result in a large drop in productivity, wages, and total jobs in the United States.
As such, under a wealth tax the policymakers are forced to choose between facing a volatile and dramatic readjustment period but modest long-term effects or, conversely, mitigating the adjustment costs and accepting worse long-term outcomes for workers.
Dynamic Revenue Estimates
|
Source: Tax Foundation General Equilibrium Model |
|||||||||||
| 2020 | 2021 | 2022 | 2023 | 2024 | 2025 | 2026 | 2027 | 2028 | 2029 | 2020-2029 | |
|---|---|---|---|---|---|---|---|---|---|---|---|
| Warren | 199 | 206 | 211 | 216 | 221 | 224 | 227 | 229 | 230 | 231 | 2193 |
| Sanders | 243 | 250 | 255 | 259 | 261 | 262 | 261 | 258 | 256 | 251 | 2555 |
After accounting for dynamic macroeconomic feedback effects, the Tax Foundation’s model projects that Sen. Warren’s wealth tax proposal would raise $2.3 trillion during 2020-2029. A reduced wealth accumulation would erode the base for wealth taxation. This dynamic projection also includes the effects of tax avoidance and tax evasion as the conventional estimates. The negative GDP growth would shrink the federal tax bases. The revenue from individual income taxes and payroll taxes would drop by $142 billion over the same budget window. The wealth tax revenue net the dynamic revenue loss from the existing tax system leads to a $2.2 trillion dynamic revenue impact for Warren’s plan.
Using the same modeling approach, the Tax Foundation’s model projects that Sen. Sanders’ wealth tax proposal would raise $2.7 trillion over 2020-2029 after accounting for dynamic economic effects. The revenue from individual income and payroll taxes would shrink by $194 billion. The combined dynamic revenue effect is $2.6 trillion for Sen. Sanders’ wealth tax plan.
Conclusion
Annual wealth taxation has been proposed for raising revenue primarily from the rich and to reduce wealth inequality. It is a new tax concept for the U.S. federal tax system and hence rigorously debated in the tax policy field. This paper starts from introducing the wealth tax basics by comparing it against the current individual income tax in the United States.
The review of the international experience with wealth tax, especially the wealth tax in the European countries, suggests that there has been a general downward trend with the wealth tax across the world due to its limited revenue collection and its administrative difficulties. Although the United States has less of a problem of outmigration than EU countries with open borders, a wealth tax for the rich in the United States still faces significant administrative and enforcement issues.
Using the Tax Foundation’s wealth tax model, we estimate the revenue collection would be much lower than the estimate from the Warren campaign on a conventional basis. The wealth tax on a small number of wealthy individuals has impacts on the entire economy. It slightly reduces the size of economic output. More importantly, it shrinks national income owned by Americans, measured by GNP. The estimated long-term effects on GDP and labor demand are minor; however, the wealth tax would significantly impact international capital flows and cause large economic dislocations in the short term.
Specifically, the Tax Foundation’s model estimates that both Sen. Warren’s and Sen. Sanders’ plans would result in a more than doubling of the average trade deficit over the next 10 years.
Stay informed on the tax policies impacting you.
Subscribe to get insights from our trusted experts delivered straight to your inbox.
Subscribe[1] Kevin Breuninger and Tucker Higgins, “Elizabeth Warren proposes ‘wealth tax’ on Americans with more than $50 million in assets,” CNBC, Jan. 24, 2019, https://www.cnbc.com/2019/01/24/elizabeth-warren-to-propose-new-wealth-tax-economic-advisor.html.
[2] Elizabeth Warrren, “Ending the Stranglehold of Health Care Costs on American Families,” Medium.com, Nov. 1, 2019, https://medium.com/@teamwarren/ending-the-stranglehold-of-health-care-costs-on-american-families-bf8286b13086.
[3] Bernie Sanders, “Tax on Extreme Wealth,” BernieSanders.com, https://berniesanders.com/issues/tax-extreme-wealth/.
[4] Naomi Jagoda, “Biden proposes tax increases for wealthy as part of health care plan,” The Hill, July 15, 2019, https://thehill.com/policy/finance/453110-biden-proposes-tax-increases-for-wealthy-as-part-of-health-care-plan.
[5] Elizabeth Warren, “Ending the Stranglehold of Health Care Costs on American Families.
[6] Emmanuel Saez and Gabriel Zucman, “Progressive Wealth Taxation,” Brookings Papers on Economic Activity, Sept. 4, 2019. https://www.brookings.edu/wp-content/uploads/2019/09/Saez-Zucman_conference-draft.pdf.
[7] In this case the use fee would scale proportionally to the value of the property being used. Crucially, a property must be paid even if, for example, the owner of the home has no or even negative equity.
[8] Erica York and Madison Mauro, “The Composition of Federal Revenue Has Changed Over Time,” Tax Foundation, Feb. 28, 2019. https://taxfoundation.org/composition-of-federal-revenue-over-time/.
[9] Emmanuel Saez and Gabriel Zucman, “How would a progressive wealth tax work? Evidence from the economics literature,” http://gabriel-zucman.eu/files/saez-zucman-wealthtaxobjections.pdf.
[10] Daniel Bunn, “What the U.S. Can Learn from the Adoption (and Repeal) of Wealth Taxes in the OECD,” Tax Foundation, Jan. 30, 2019, https://taxfoundation.org/elizabeth-warren-wealth-tax-oecd/.
[11] OECD, “The Role and Design of Net Wealth Taxes in the OECD,” Apr. 12, 2018,
[12] Wojciech Kopczuk, “Comment on ‘Progressive Wealth Taxation’ by Saez and Zucman prepared for the Fall 2019 Issue of Brookings Papers on Economic Activity,” Columbia University, November 2019, http://www.columbia.edu/~wk2110/bin/BPEASaezZucman.pdf.
[13] Lily L. Batchelder and David Kamin, “Taxing the Rich: Issues and Options,” New York University School of Law, Sept. 11, 2019, http://dx.doi.org/10.2139/ssrn.3452274.
[14] OECD, “The Role and Design of Net Wealth Taxes in the OECD.”
[15] Daniel Bunn, “What the U.S. Can Learn from the Adoption (and Repeal) of Wealth Taxes in the OECD.”
[16] Janet Holtzblatt, “Should Wealth be Taxed? Issues and Options” (PowerPoint presentation), The Tax Policy Center, Sept. 24, 2019, https://www.taxpolicycenter.org/sites/default/files/holtzblatt_ppt.pdf.
[17] Only four countries, Norway, Spain, Switzerland, and Belgium, are levying a net wealth tax based on the OECD’s definition. See OECD, “The Role and Design of Net Wealth Taxes in the OECD.”
[18] Ibid.
[19] Chris Edwards, “Taxing Wealth and Capital Income,” Cato Institute, Aug. 1, 2019, https://www.cato.org/publications/tax-budget-bulletin/taxing-wealth-capital-income.
[20] Wojciech Kopczuk, “Comment on ‘Progressive Wealth Taxation’ by Saez and Zucman prepared for the Fall 2019 Issue of Brookings Papers on Economic Activity.”
[21] Lily L. Batchelder and David Kamin, “Taxing the Rich: Issues and Options.”
[22] Toluse Olorunnipa, “Warren’s ambitious agenda relies on a massive wealth tax that the rich may evade,” The Washington Post, May 22, 2019, https://www.washingtonpost.com/politics/warrens-ambitious-agenda-relies-on-a-massive-wealth-tax-that-the-rich-may-evade/2019/05/21/900d72c4-78a4-11e9-bd25-c989555e7766_story.html.
[23] Emmanuel Saez and Gabriel Zucman, “Wealth Inequality in the United States since 1913: Evidence from Capitalized Income Tax Data,” The Quarterly Journal of Economics 131:2 (May 2016), 519–578.
[24] Matthew Smith, Owen Zidar, and Eric Zwick, “Top Wealth in the United States: New Estimates and Implications for Taxing the Rich,” July 19, 2019, http://ericzwick.com/wealth/wealth.pdf.
[25] IRS, “SOI Tax Stats – Personal Wealth Study Terms and Concepts,” https://www.irs.gov/statistics/soi-tax-stats-personal-wealth-study-terms-and-concepts.
[26] Emmanuel Saez and Gabriel Zucman, “Progressive Wealth Taxation.”
[27] Jeff Stein and Christopher Ingraham, “Elizabeth Warren to propose new ‘wealth tax’ on very rich Americans, economist says,“ The Washington Post, Jan. 24, 2019, https://www.washingtonpost.com/business/2019/01/24/elizabeth-warren-propose-new-wealth-tax-very-rich-americans-economist-says/.
[28] Emmanuel Saez and Gabriel Zucman, “Letter from Emmanuel Saez and Gabriel Zucman to Elizabeth Warren on her Wealth Tax Proposal,” University of California Berkeley, Jan. 18, 2019, https://elizabethwarren.com/wp-content/uploads/2019/01/saez-zucman-wealthtax-warren-v5-web.pdf.
[29] Lawrence H. Summers and Natasha Sarin, “A ‘wealth tax’ presents a revenue estimation puzzle,” The Washington Post, Apr. 4, 2019, https://www.washingtonpost.com/opinions/2019/04/04/wealth-tax-presents-revenue-estimation-puzzle/.
[30] Emmanuel Saez and Gabriel Zucman, “Letter from Emmanuel Saez and Gabriel Zucman to Elizabeth Warren on her Wealth Tax Proposal.”
[31] Lily L. Batchelder and David Kamin, “Taxing the Rich: Issues and Options.”
[32] Ibid.
[33] Matthew Smith, Owen Zidar, and Eric Zwick, “Top Wealth in the United States: New Estimates and Implications for Taxing the Rich.”
[34] Emmanuel Saez, Gabriel Zucman, “Wealth Inequality in the United States since 1913: Evidence from Capitalized Income Tax Data.”
[35] Emmanuel Saez and Gabriel Zucman, “Progressive Wealth Taxation.”
[36] Matthew Smith, Owen Zidar, and Eric Zwick, “Top Wealth in the United States: New Estimates and Implications for Taxing the Rich.”
[37] Katrine Jakobsen, Kristian Jakobsen, Henrik Kleven, and Gabriel Zucman, “Wealth Taxation and Wealth Accumulation: Theory and Evidence from Denmark,” NBER Working Paper No. 24371, March 2018, https://www.nber.org/papers/w24371.
[38] Ibid.
[39] Marius Brülhart, Jonathan Gruber, Matthias Krapf, and Kurt Schmidheiny, “Behavioral Responses to Wealth Taxes: Evidence from Switzerland,” Oct. 28, 2019, http://www.hec.unil.ch/mbrulhar/papers/wealthtax.pdf.
[40] David Seim, “Behavioral Responses to Wealth Taxes: Evidence from Sweden,” American Economic Journal: Economic Policy 9:4 (November 2017), 395-421.
[41] Marius Brülhart, Jonathan Gruber, Matthias Krapf, and Kurt Schmidheiny, “Behavioral Responses to Wealth Taxes: Evidence from Switzerland.”
[42] Scott Eastman, “The Tax GapThe tax gap is the difference between taxes legally owed and taxes collected. The gross tax gap in the U.S. accounts for at least 1 billion in lost revenue each year, according to the latest estimate by the IRS (2011 to 2013), suggesting a voluntary taxpayer compliance rate of 83.6 percent. The net tax gap is calculated by subtracting late tax collections from the gross tax gap: from 2011 to 2013, the average net gap was around 1 billion. Tops $500 Billion a Year,” Tax Foundation, May 15, 2019, https://taxfoundation.org/tax-gap-tops-500-billion-year/.
[43] Penn Wharton Budget Model, “Senator Elizabeth Warren’s Wealth Tax: Projected Budgetary and Economic Effects,” Dec. 12, 2019.
[44] Marius Brülhart, Jonathan Gruber, Matthias Krapf, and Kurt Schmidheiny, “Behavioral Responses to Wealth Taxes: Evidence from Switzerland.”
[45] Federal Reserve, “Definition of SCF Bulletin Asset and Debt Categories in Calculation of Net Worth,” https://www.federalreserve.gov/econres/files/Networth%20Flowchart.pdf.
[46] Lily L. Batchelder and David Kamin, “Taxing the Rich: Issues and Options.”
[47]Michael Batty et al., “Introducing the Distributional Financial Accounts of the United
States,” Finance and Economics Discussion Series 2019-017, Mar. 26, 2019, https://doi.org/10.17016/FEDS.2019.017.
[48] Luisa Kroll and Kerry A. Dolan, “The Forbes 400: The Definitive Ranking Of The Wealthiest Americans,” Forbes, Oct. 2, 2019, https://www.forbes.com/forbes-400/#5b8c44817e2f.
[49] Congressional Budget Office, “An Update to the Budget and Economic Outlook: 2019 to 2029,” Aug. 21, 2019, https://www.cbo.gov/publication/55551.
[50] Barry W. Johnson, Peter J. Rose, et al., “Federal Tax Compliance Research: Tax Gap Estimates for Tax Years 2011–2013,” IRS, Publication 1415, September 2019, https://www.irs.gov/pub/irs-pdf/p1415.pdf.
[51] Max Ghenis, “Warren’s Wealth Tax Would Raise Less Than She Claims—Even Using Her Economists’ Own Assumptions,” Medium.com, Nov. 9, 2019, https://medium.com/@MaxGhenis/warrens-wealth-tax-would-raise-less-than-she-claims-even-using-her-economists-own-assumptions-bea43840bc0a.
[52] Karl W. Smith, “A Wealth Tax Is Simply Un-American,” Bloomberg Opinion, Oct. 29, 2019, https://www.bloomberg.com/opinion/articles/2019-10-29/wealth-tax-proposals-may-be-feasible-but-they-re-un-american.
[53] Emmanuel Saez and Gabriel Zucman, “Progressive wealth taxation.”
[54] OECD, “The Role and Design of Net Wealth Taxes in the OECD.”
[55] P.R. Sanjai and Anto Antony, Blomberg, “Beyonce Meets Bollywood as Daughter of Asia’s Richest Man Weds,” Bloomberg, Dec. 10, 2018, https://www.bloomberg.com/news/articles/2018-12-10/real-crazy-rich-asian-wedding-is-said-to-cost-100-million.
[56] Nicholas Confessore, “Koch Brothers’ Budget of $889 Million for 2016 Is on Par With Both Parties’ Spending,” The New York Times, Jan. 27, 2015, https://www.nytimes.com/2015/01/27/us/politics/kochs-plan-to-spend-900-million-on-2016-campaign.html.
[57] David H. Autor, David Dorn, and Gordon H. Hanson, “The China Shock: Learning from Labor Market Adjustment to Large Changes in Trade,” NBER Working Paper 21906, January 2016, https://www.nber.org/papers/w21906.pdf.
[58] Ellen McGrattan and Edward Prescott, “Why Did U.S. Market Hours Boom in the 1990s?” NBER Working Paper 12046, February 2006, https://www.nber.org/papers/w12046.
Share