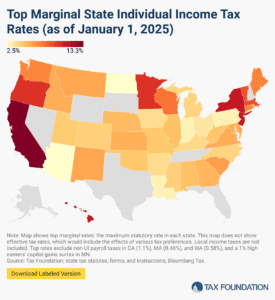
State Individual Income Tax Rates and Brackets, 2025
Individual income taxes are a major source of state government revenue, accounting for more than a third of state tax collections. How do income taxes compare in your state?
12 min readProviding journalists, taxpayers and policymakers with basic data on taxes and spending is a cornerstone of the Tax Foundation’s educational mission. We’ve found that one of the best, most engaging ways to do that is by visualizing tax data in the form of maps.
How does your state collect revenue? Every week, we release a new tax map that illustrates one important measure of state tax rates, collections, burdens and more. If you enjoy our weekly tax maps, help us continue this work and more by making a small contribution here.
Individual income taxes are a major source of state government revenue, accounting for more than a third of state tax collections. How do income taxes compare in your state?
12 min read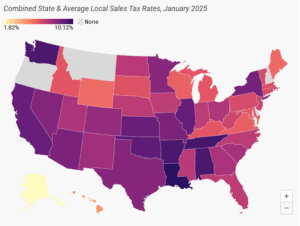
Retail sales taxes are an essential part of most states’ revenue toolkits, responsible for 24 percent of combined state and local tax collections.
15 min read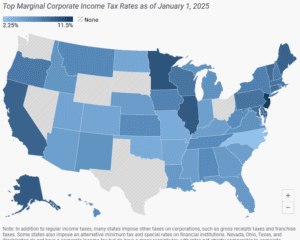
Forty-four states levy a corporate income tax, with top rates ranging from a 2.25 percent flat rate in North Carolina to a 11.5 percent top marginal rate in New Jersey.
7 min read
Property taxes are the primary tool for financing local governments. While no taxpayers in high-tax jurisdictions will be celebrating their yearly payments, property taxes are largely rooted in the benefit principle of taxation: the people paying the property tax bills are most often the ones benefiting from the services.
9 min read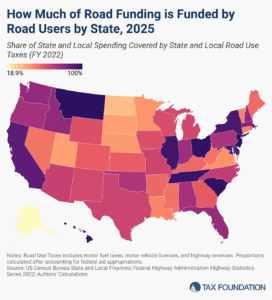
The amount of revenue states raise through roadway-related revenues varies significantly across the US. Only three states raise enough revenue to fully cover their highway spending.
5 min read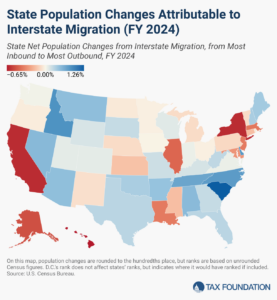
Americans were on the move in 2024, and many chose low-tax states over high-tax ones.
6 min read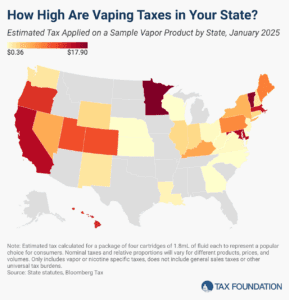
The vaping industry has grown rapidly in recent decades, becoming a well-established product category and a viable alternative to cigarettes for those trying to quit smoking. US states levy a variety of tax structures on vaping products.
7 min read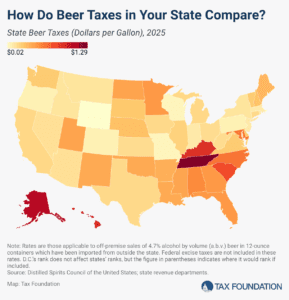
In the United States, taxes are the single most expensive ingredient in beer. The tax burden accounts for more of the final price of beer than labor and materials combined—the many different layers of applicable taxes combining to total as much as 40.8 percent of the retail price.
6 min read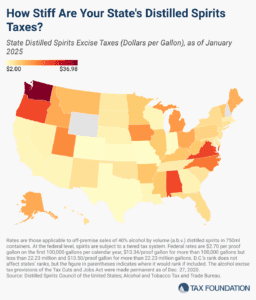
The significant disparity in tax rates across states underscores the complex tax and regulatory environment governing distilled spirits.
6 min read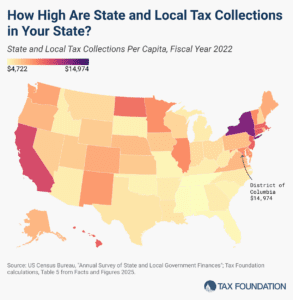
According to the latest economic data from the US Census Bureau, the average per capita state and local tax burden is $7,109. However, collections vary widely by state, reflecting differences in tax rates and bases, natural resource endowments, the scale and scope of taxable economic activity in each state, and residents’ political preferences.
5 min read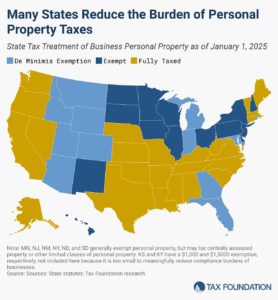
Does your state have a small business exemption for machinery and equipment?
4 min read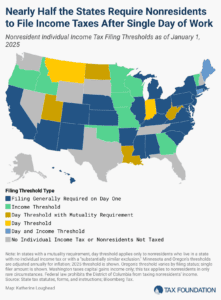
One area of the tax code in which extreme complexity and low compliance go hand-in-hand—and where reform is desperately needed—is in states’ nonresident individual income tax filing and withholding laws.
7 min read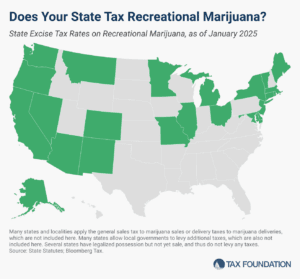
Many states regulate and tax legal marijuana sales and consumption, despite the ongoing federal prohibition. Explore the data here.
8 min read
Facts & Figures serves as a one-stop state tax data resource that compares all 50 states on over 40 measures of tax rates, collections, burdens, and more.
2 min read
The amount of revenue states raise through roadway-related revenues varies significantly across the US. Only three states raise enough revenue to fully cover their highway spending.
5 min read
Property taxes are the primary tool for financing local governments. While no taxpayers in high-tax jurisdictions will be celebrating their yearly payments, property taxes are largely rooted in the benefit principle of taxation: the people paying the property tax bills are most often the ones benefiting from the services.
9 min read
Individual income taxes are a major source of state government revenue, accounting for more than a third of state tax collections. How do income taxes compare in your state?
12 min read
Retail sales taxes are an essential part of most states’ revenue toolkits, responsible for 24 percent of combined state and local tax collections.
15 min read
Forty-four states levy a corporate income tax, with top rates ranging from a 2.25 percent flat rate in North Carolina to a 11.5 percent top marginal rate in New Jersey.
7 min read
Americans were on the move in 2024, and many chose low-tax states over high-tax ones.
6 min read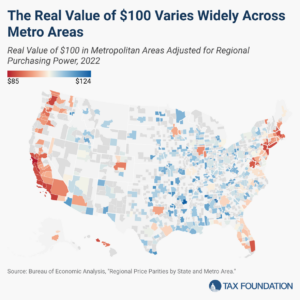
Many policies, such as minimum wage levels, tax brackets, and means-tested public benefit income thresholds, are denominated in nominal dollars, even though a dollar in one region may go much further than a dollar in another. Lawmakers should keep that reality in mind as they make changes to tax and economic policies.
6 min read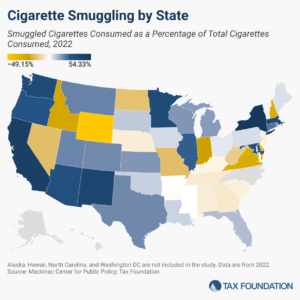
Growing cigarette tax levels and differentials have made cigarette smuggling both a national problem and a lucrative criminal enterprise.
16 min read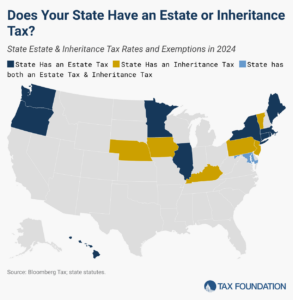
In addition to the federal estate tax, with a top rate of 40 percent, 12 states and DC impose additional estate taxes, while six states levy inheritance taxes.
7 min read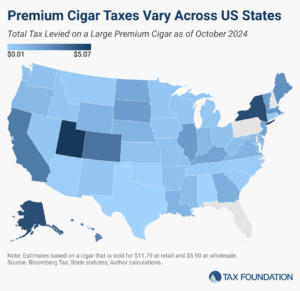
Over 500 million premium cigars were sold in the United States in 2023. With each sale comes a complex tax landscape.
4 min read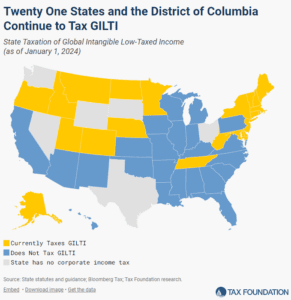
States that tax GILTI increase filing complexity, drive up the cost of tax compliance, and introduce unnecessary economic uncertainty and legal risk. 21 states and DC continue to tax GILTI despite these challenges.
6 min read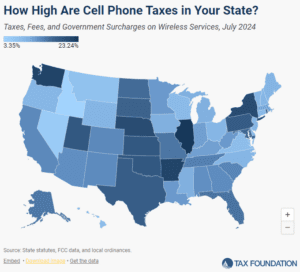
Wireless taxes and fees set a new record high in 2024.
23 min read