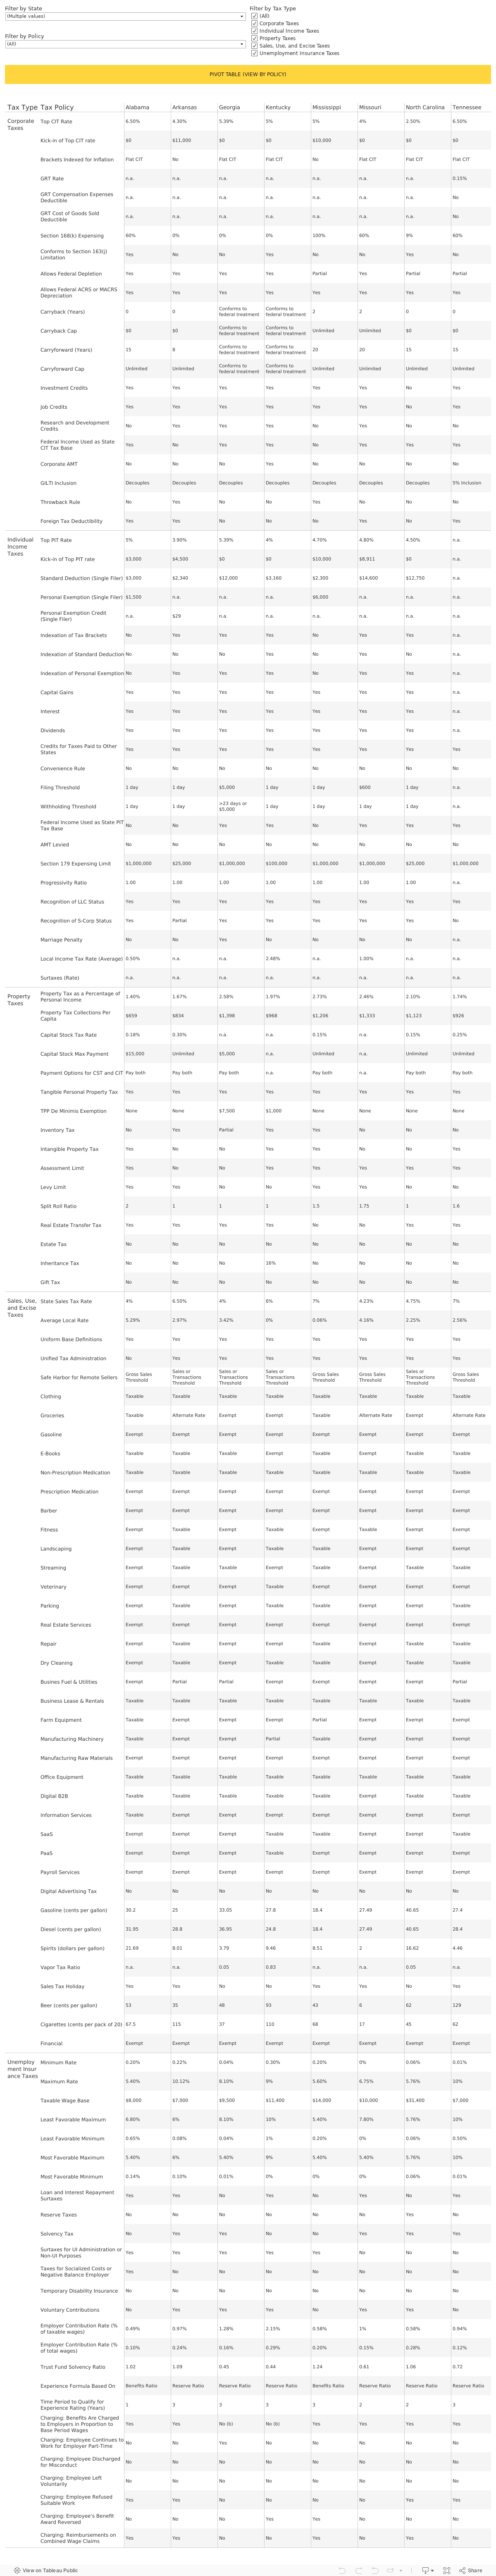
Tennessee‘s tax system ranks 8th overall on the 2025 State Tax Competitiveness Index. Tennessee forgoes an individual income tax, having phased out a narrow tax on interest and dividend income, known as the Hall Tax. However, Tennessee is 1 of 15 states that still has a capital stock tax on the books, despite making structural improvements to it during the 2024 legislative session. Tennessee businesses also face an additional layer of tax on their gross receipts, and not just their net income (profits).
Tennessee excludes most, but not all, global intangible low-taxed income (GILTI) from its tax base, and caps net operating loss carryforwards at 15 years, whereas most states have 20-year or unlimited carryforwards. The state recently conformed to the federal treatment of first-year expensing under Section 168(k) but missed an opportunity to make the treatment permanent at 100 percent.
Tennessee is perpetually tied with Louisiana for the highest combined state and local sales taxes in the nation. The largest portion of the sales tax burden comes from the seven percent state-level sales tax rate, which is second only to California’s 7.25 percent. Because income taxes have a greater impact on economic growth than sales taxes, however, Tennessee’s decision to rely on high sales taxes in lieu of income taxes is an economically advantageous one.
Summer has arrived, and states are beginning to implement policy changes that were enacted during this year’s legislative session (or that have delayed effective dates or are being phased in over time).
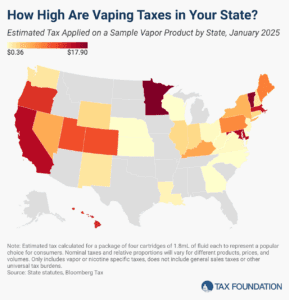
The vaping industry has grown rapidly in recent decades, becoming a well-established product category and a viable alternative to cigarettes for those trying to quit smoking. US states levy a variety of tax structures on vaping products.
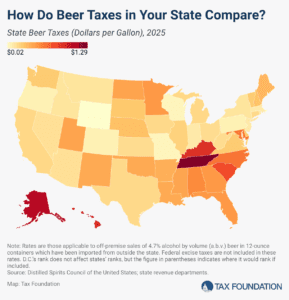
In the United States, taxes are the single most expensive ingredient in beer. The tax burden accounts for more of the final price of beer than labor and materials combined—the many different layers of applicable taxes combining to total as much as 40.8 percent of the retail price.