Taxes generate almost exactly half of state and local government revenue, supplemented by federal transfers, fees, fines, investment income, and other revenue streams. Property taxes edge out income and sales taxes, generating 27.4 percent of state and local taxA tax is a mandatory payment or charge collected by local, state, and national governments from individuals or businesses to cover the costs of general government services, goods, and activities. revenue as of FY 2022. Virtually all of this is at the local level, where property taxes comprise 70.2 percent of all local government revenue.
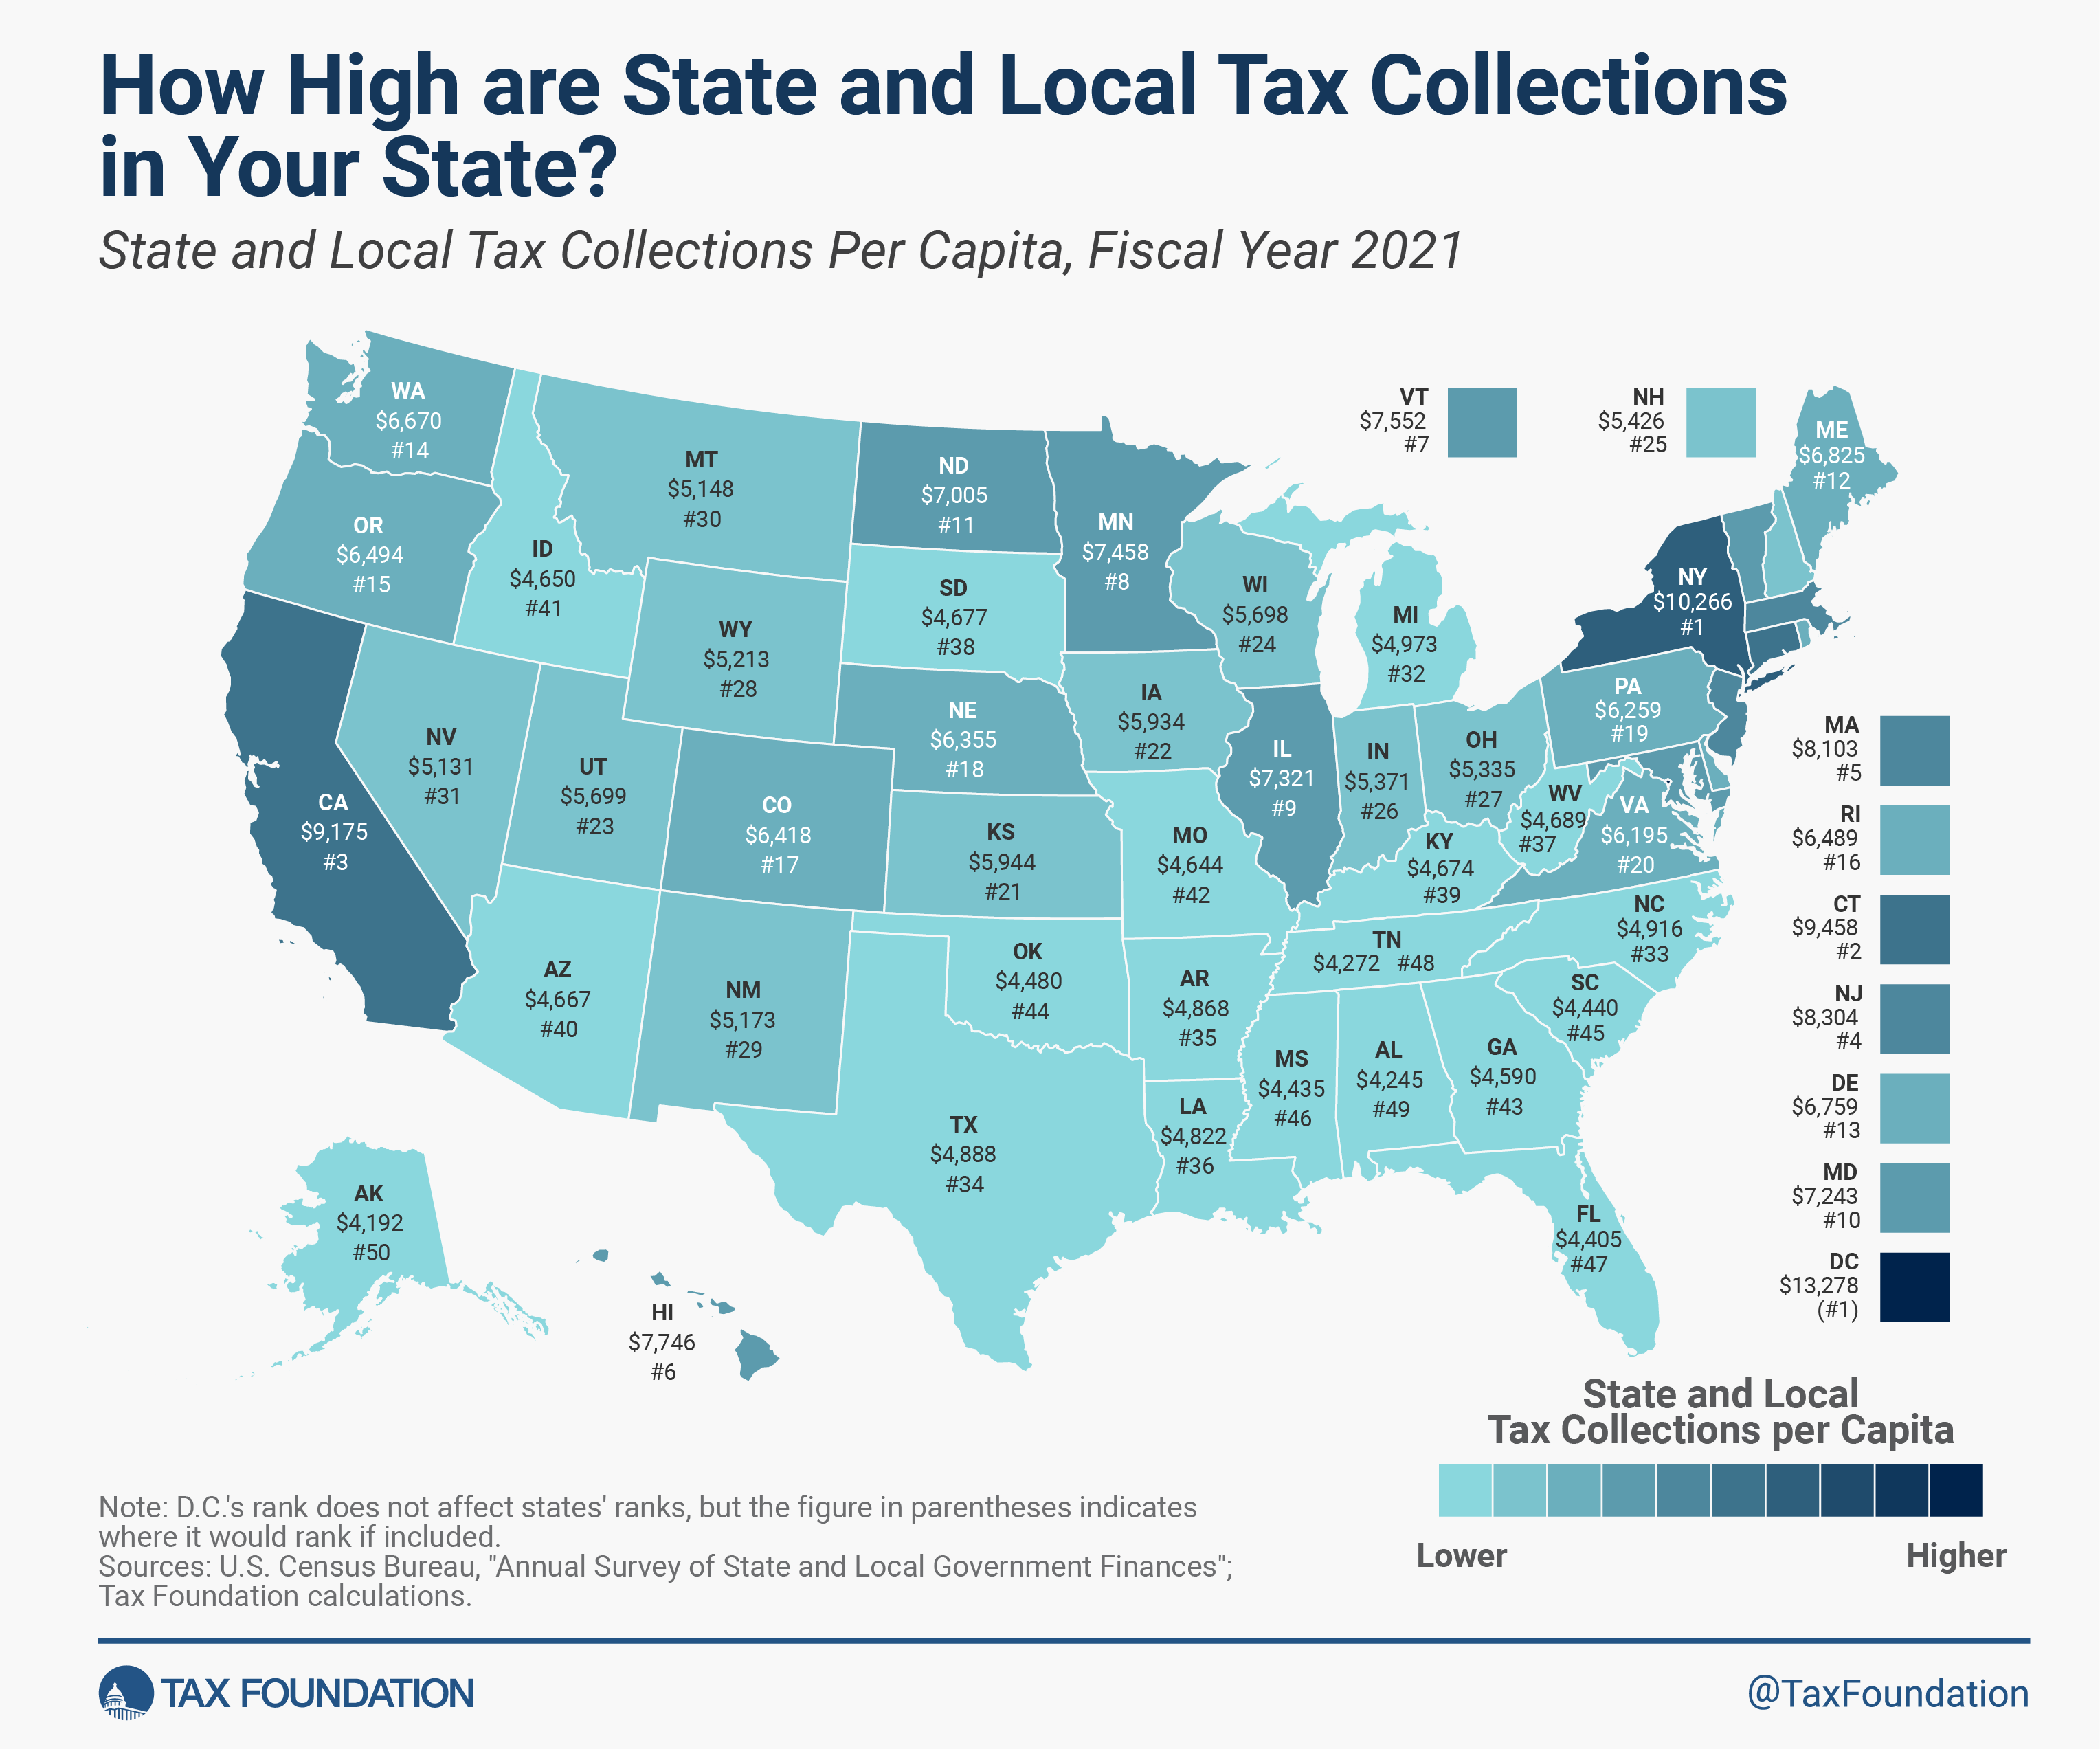
According to the latest economic data from the US Census Bureau (for FY 2022), the average per capita state and local tax burden was $7,109. However, collections vary widely by state, reflecting differences in tax rates and bases, natural resource endowments, the scale and scope of taxable economic activity in each state, and residents’ political preferences.
The District of Columbia again ranks above any state tax revenue per capita, with a total tax burden of $14,974. This is largely due to the mandatory upkeep of federal government property in the District of Columbia. New York residents experienced the second highest combined state and local per capita tax burden at $12,685. California ($10,319) also remains near the top of the list, joined by Connecticut ($9,718) and Hawaii ($9,503). Three southern states bring up the rear: Alabama ($4,722), Tennessee ($4,731), and Mississippi ($4,767). Alaska ($6,915) and North Dakota ($8,961) also continued to be statistical outliers due to their rich natural resource endowments and the proportionate severance tax revenue associated with mineral extraction taxes.
Some states with high tax collections per capita, such as Connecticut ($9,718) and Hawaii ($9,503), illustrate how geography, economic composition, and policy priorities overlap to produce elevated collection levels. Connecticut, which has a wealthy population combined with a progressive rate individual income taxAn individual income tax (or personal income tax) is levied on the wages, salaries, investments, or other forms of income an individual or household earns. The U.S. imposes a progressive income tax where rates increase with income. The Federal Income Tax was established in 1913 with the ratification of the 16th Amendment. Though barely 100 years old, individual income taxes are the largest source of tax revenue in the U.S. structure, generates high per capita revenue collections.
Of course, household income is not the only driver of tax revenues; the structure of the tax baseThe tax base is the total amount of income, property, assets, consumption, transactions, or other economic activity subject to taxation by a tax authority. A narrow tax base is non-neutral and inefficient. A broad tax base reduces tax administration costs and allows more revenue to be raised at lower rates. is also a relevant factor. For instance, Connecticut’s median household income of $91,665 is similar to both Colorado ($92,911) and Utah ($93,421), but the latter two have low single-rate individual income taxes and collect far less in combined state and local taxes. Utah collected around $3,400 less than Connecticut, while Colorado collected $2,400 less per capita. Meanwhile, Hawaii’s heavy reliance on tourism-related consumption taxes involves substantial tax shifting to nonresidents.
Lower-tax-burden states like Alabama ($4,722), Tennessee ($4,731), and Mississippi ($4,767) operate with relatively lean public sector budgets. These states tend to have a low cost of living, though Alabama and Mississippi in particular are also low-income states, making it difficult to raise significant tax revenue even with higher tax rates. Their governments have tended to emphasize boosting their economies over growing government, focusing on lower overall tax rates assessed on a broad base of goods and services.
Tennessee, another state with low per-capita collections, forgoes an individual income tax. Instead, it relied heavily on sales taxes with an average combined state and local sales taxA sales tax is levied on retail sales of goods and services and, ideally, should apply to all final consumption with few exemptions. Many governments exempt goods like groceries; base broadening, such as including groceries, could keep rates lower. A sales tax should exempt business-to-business transactions which, when taxed, cause tax pyramiding. rate of 9.55 percent as of 2025. Florida followed a similar model, ranking toward the bottom at $4,914 per capita. However, Florida relies more heavily on property taxes than sales taxes to make up the foregone individual income tax revenue. It’s notable that both Tennessee and Florida also ranked in the top 10 states in the 2025 State Tax Competitiveness Index. Both states have opted for more limited government, prioritizing lower taxes and economic growth.
Nevada imposes substantial excise taxes on its robust tourism and gaming industries to generate tax revenue without taxing residents through an individual income tax. It also has a relatively low sales tax, which helped it stay in the top half of all states in the 2025 Index.
It is important to recognize that higher per capita tax collections are the result of a complex web of interconnected choices, priorities, and variables—tax rates, tax bases, and the economy on which they’re imposed.
Per capita state and local tax collections must be considered within the broader context of other states’ actions, the current economic realities at play in each individual state, and the future policy priorities of its citizens and legislatures as they seek to maximize their utility and provide a better life for their residents.

State and Local Tax Collections by State
State and Local Tax Collections Per Capita, Fiscal Year 2022
| State | Collections per Capita | Rank |
|---|---|---|
| United States | $7,109 | |
| Alabama | $4,722 | 50 |
| Alaska | $6,915 | 19 |
| Arizona | $5,232 | 40 |
| Arkansas | $5,289 | 37 |
| California | $10,319 | 2 |
| Colorado | $7,263 | 15 |
| Connecticut | $9,718 | 3 |
| Delaware | $7,693 | 13 |
| Florida | $4,914 | 47 |
| Georgia | $5,262 | 39 |
| Hawaii | $9,503 | 4 |
| Idaho | $5,173 | 42 |
| Illinois | $8,148 | 9 |
| Indiana | $5,768 | 31 |
| Iowa | $6,375 | 23 |
| Kansas | $6,326 | 24 |
| Kentucky | $5,223 | 41 |
| Louisiana | $5,497 | 33 |
| Maine | $7,216 | 16 |
| Maryland | $8,048 | 11 |
| Massachusetts | $9,341 | 6 |
| Michigan | $5,281 | 38 |
| Minnesota | $8,050 | 10 |
| Mississippi | $4,767 | 48 |
| Missouri | $4,979 | 46 |
| Montana | $5,842 | 30 |
| Nebraska | $6,732 | 21 |
| Nevada | $6,196 | 27 |
| New Hampshire | $5,949 | 29 |
| New Jersey | $9,366 | 5 |
| New Mexico | $7,752 | 12 |
| New York | $12,685 | 1 |
| North Carolina | $5,335 | 35 |
| North Dakota | $8,961 | 7 |
| Ohio | $5,741 | 32 |
| Oklahoma | $5,038 | 45 |
| Oregon | $6,920 | 18 |
| Pennsylvania | $6,644 | 22 |
| Rhode Island | $7,000 | 17 |
| South Carolina | $5,052 | 44 |
| South Dakota | $5,091 | 43 |
| Tennessee | $4,731 | 49 |
| Texas | $5,469 | 34 |
| Utah | $6,277 | 25 |
| Vermont | $8,158 | 8 |
| Virginia | $6,845 | 20 |
| Washington | $7,431 | 14 |
| West Virginia | $5,335 | 36 |
| Wisconsin | $5,953 | 28 |
| Wyoming | $6,264 | 26 |
| District of Columbia | $14,974 | 1 |
Data compiled by Joseph Johns