Contrary to initial expectations, the pandemic years were good for state and local taxA tax is a mandatory payment or charge collected by local, state, and national governments from individuals or businesses to cover the costs of general government services, goods, and activities. collections, and while the surges of 2021 and 2022 have not continued into calendar year 2023, revenues remain robust in most states and well above pre-pandemic levels even after accounting for inflationInflation is when the general price of goods and services increases across the economy, reducing the purchasing power of a currency and the value of certain assets. The same paycheck covers less goods, services, and bills. It is sometimes referred to as a “hidden tax,” as it leaves taxpayers less well-off due to higher costs and “bracket creep,” while increasing the government’s spendin.
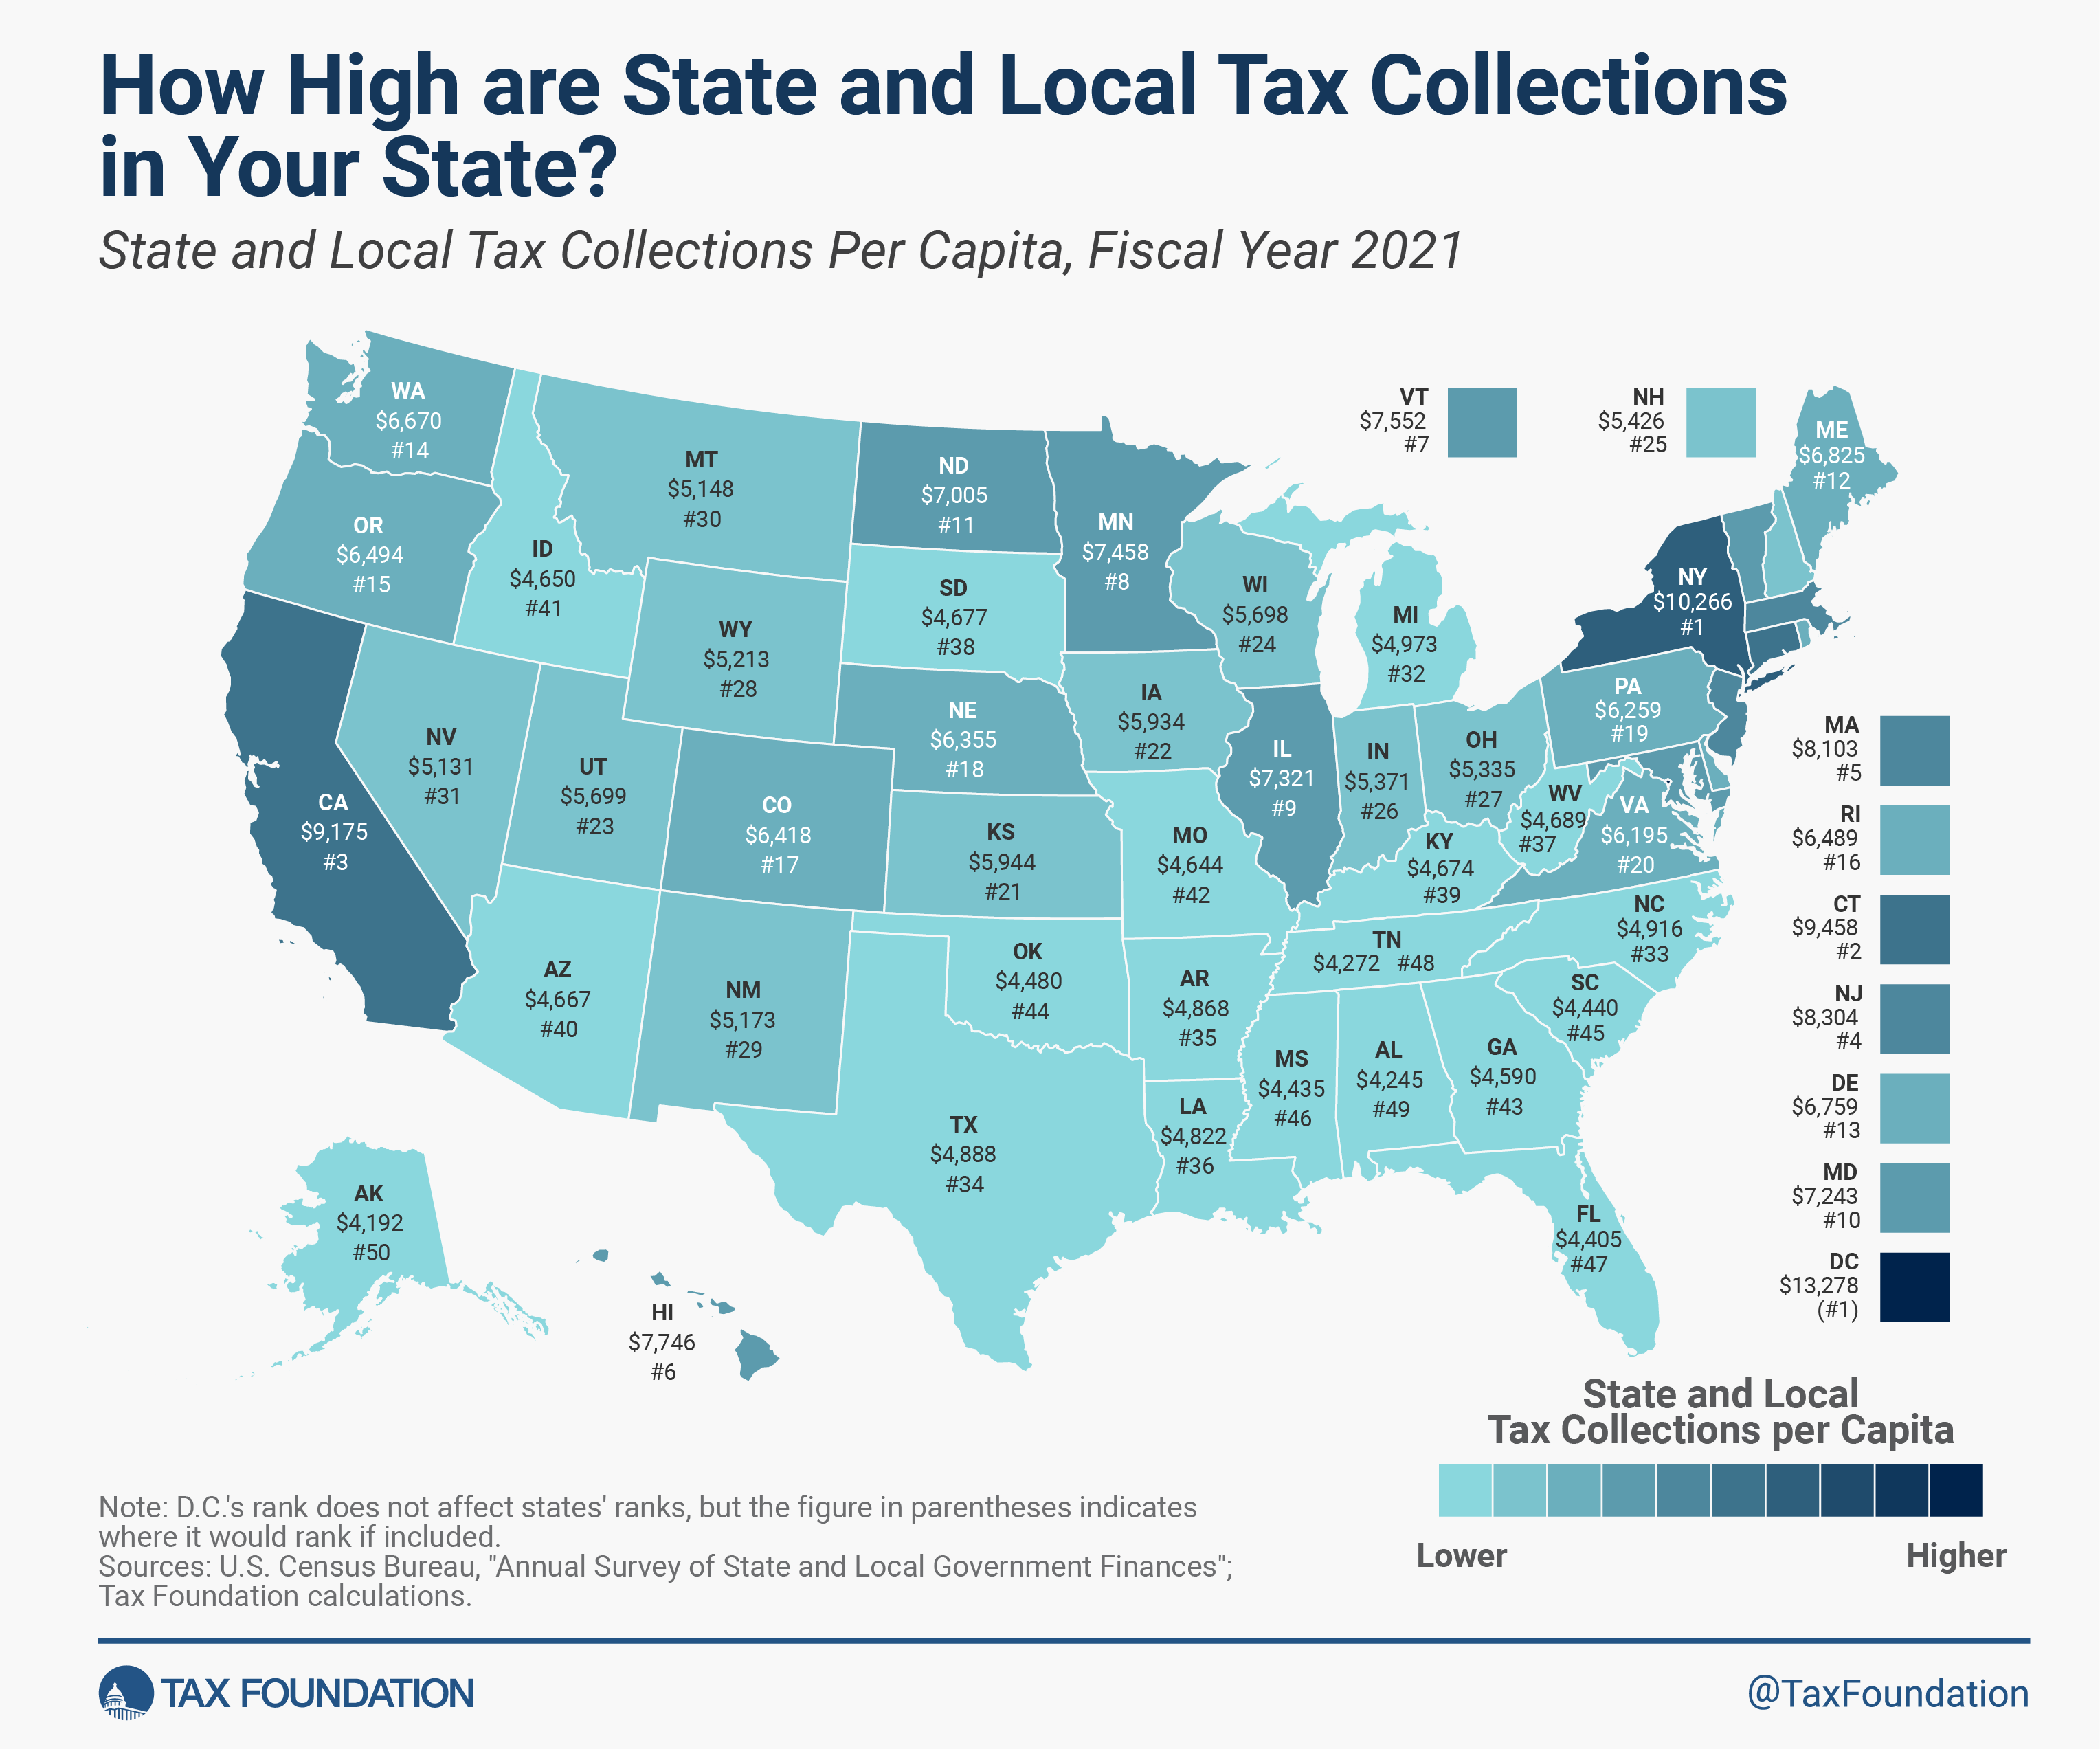
Today’s map shows state and local tax collections per capita in each state as of fiscal year (FY) 2021, the most recent year for which full state-by-state data are available. But because the events of recent years are so significant, we will also discuss the trajectory of state and local tax collections through FY 2023, which ended in June of this year.
For FY 2021, the District of Columbia surpassed all states with $13,278 in per capita tax collections. New York followed at $10,266 in state and local tax collections per person, with Connecticut ($9,458), California ($9,175), New Jersey ($8,303), and Massachusetts ($8,101) not far behind. At the other end of the spectrum, Alaska was lowest at $4,192, followed by Alabama ($4,245), Tennessee ($4,272), Florida ($4,405), and Mississippi ($4,435).
Alaska is an anomaly here: while the state imposes incredibly low tax burdens on residents, its severance taxes generate substantial revenue that often yield relatively high collections per capita. FY 2021, however, captured a period of significant fluctuations in oil markets, from which the industry—and Alaska’s revenues—have since recovered. Similar effects are evident in other resource-dependent states, like North Dakota and Wyoming, which had markedly lower per capita collections in FY 2021 than in years prior, or (based on their own revenue data) since. These states export much of their tax burden, and there was simply less to export that year.
It’s worth noting that severance taxes are only one of many examples of the “tax exporting” that states engage in. Travel taxes—such as hotel, car rental, and meal taxes—also disproportionately impact nonvoting nonresidents who have few means of redress. As a result, states that generate substantial amounts of tax revenue from tourism may also show tax collections per capita that are higher than the actual tax burden that falls on the in-state population. Taxes on businesses may also be exported, at least in part, to investors across the country, and to employees wherever they are located. It is important to keep both legal incidence and economic incidence in mind when evaluating the true costs of any tax.
State and local governments fared well in FY 2021, but with all the ways our world has changed since the start of the pandemic, that feels like eons ago. Even though these maps are always limited by the timing of Census data releases, it’s fair to ask where things stand now. And fortunately, while we can’t go state by state, we do have quarterly data for the national aggregate of state and local tax collections through FY 2023.
Since FY 2019, the last full fiscal year before the pandemic, state and local tax collections have risen more than 27 percent. Much of that gain is subsumed by inflation, but even after adjusting for inflation, state and local tax revenues are more than 7 percent higher than they were pre-pandemic.
Revenues soared in FY 2021, jumping a full 10 percent (inflation-adjusted) higher than pre-pandemic figures, edging up even higher in FY 2022 (to 12 points up) before coming down to earth a bit in FY 2023. But this should not be alarming. Partly, it is a reversion to the mean: state revenues skyrocketed, and it’s okay for them to level off or even decline a little, as long as the new totals remain higher (in real terms) than before. Additionally, almost every state has adopted tax cuts since the start of 2021, including 25 that have cut individual income taxAn individual income tax (or personal income tax) is levied on the wages, salaries, investments, or other forms of income an individual or household earns. The U.S. imposes a progressive income tax where rates increase with income. The Federal Income Tax was established in 1913 with the ratification of the 16th Amendment. Though barely 100 years old, individual income taxes are the largest source rates since then. Legislators wanted to return some of the revenue growth to the taxpayers—and even with that, revenues remain up in real terms.
Recent revenue declines, moreover, are concentrated in California and New York, high-tax states with intense reliance on high marginal income tax rates. Not only are these states more vulnerable to income fluctuations among high earners—an important source of volatility—but in an increasingly mobile environment, they’re driving some of those high earners to other states as well. While only state (not local) tax revenue data are available at a state-by-state level for more recent fiscal years, New York and California’s combined state tax revenue is up 2.9 percent in real terms since FY 2019, compared to 11.3 percent growth in the rest of the country.
The rate of revenue growth witnessed in FY 2021 was never going to be sustainable, but most states remain substantially better off than they were pre-pandemic, even after adopting tax relief, with every expectation that the new baseline is far higher than it was before. Revenues are high enough, in some states, that the tax-cutting trends of 2021-2023 are likely to continue into 2024.
How High are State and Local Tax Collections in Your State?
State and Local Tax Collections Per Capita, Fiscal Year 2021
| State | State and Local Tax Collections Per Capita, FY 2021 | Rank |
|---|---|---|
| Alabama | $ 4,245 | 49 |
| Alaska | $ 4,192 | 50 |
| Arizona | $ 4,667 | 40 |
| Arkansas | $ 4,868 | 35 |
| California | $ 9,175 | 3 |
| Colorado | $ 6,418 | 17 |
| Connecticut | $ 9,458 | 2 |
| Delaware | $ 6,759 | 13 |
| District of Columbia | $ 13,278 | -1 |
| Florida | $ 4,405 | 47 |
| Georgia | $ 4,590 | 43 |
| Hawaii | $ 7,746 | 6 |
| Idaho | $ 4,650 | 41 |
| Illinois | $ 7,321 | 9 |
| Indiana | $ 5,371 | 26 |
| Iowa | $ 5,934 | 22 |
| Kansas | $ 5,944 | 21 |
| Kentucky | $ 4,674 | 39 |
| Louisiana | $ 4,822 | 36 |
| Maine | $ 6,825 | 12 |
| Maryland | $ 7,243 | 10 |
| Massachusetts | $ 8,103 | 5 |
| Michigan | $ 4,973 | 32 |
| Minnesota | $ 7,458 | 8 |
| Mississippi | $ 4,435 | 46 |
| Missouri | $ 4,643 | 42 |
| Montana | $ 5,148 | 30 |
| Nebraska | $ 6,355 | 18 |
| Nevada | $ 5,131 | 31 |
| New Hampshire | $ 5,426 | 25 |
| New Jersey | $ 8,303 | 4 |
| New Mexico | $ 5,173 | 29 |
| New York | $ 10,266 | 1 |
| North Carolina | $ 4,916 | 33 |
| North Dakota | $ 7,005 | 11 |
| Ohio | $ 5,335 | 27 |
| Oklahoma | $ 4,480 | 44 |
| Oregon | $ 6,494 | 15 |
| Pennsylvania | $ 6,259 | 19 |
| Rhode Island | $ 6,489 | 16 |
| South Carolina | $ 4,440 | 45 |
| South Dakota | $ 4,677 | 38 |
| Tennessee | $ 4,272 | 48 |
| Texas | $ 4,888 | 34 |
| Utah | $ 5,699 | 23 |
| Vermont | $ 7,552 | 7 |
| Virginia | $ 6,195 | 20 |
| Washington | $ 6,670 | 14 |
| West Virginia | $ 4,689 | 37 |
| Wisconsin | $ 5,698 | 24 |
| Wyoming | $ 5,213 | 28 |
Stay informed on the tax policies impacting you.
Subscribe to our free newsletter to get the latest tax data, news and analysis.
Subscribe