Facts & Figures 2026: How Does Your State Compare?
Facts & Figures serves as a one-stop state tax data resource that compares all 50 states on over 40 measures of tax rates, collections, burdens, and more.
2 min read
Providing journalists, taxpayers, and policymakers with the latest data on taxes and spending is a cornerstone of the Tax Foundation’s educational mission.
As a nonpartisan, educational organization, the Tax Foundation has earned a reputation for independence and credibility. Our state tax policy team regularly provides accessible, data-driven insights on state tax rates, collections, burdens and more, from sources such as the U.S. Census Bureau, Internal Revenue Service (IRS), and others.

Get facts about taxes in your state and around the US

Facts & Figures serves as a one-stop state tax data resource that compares all 50 states on over 40 measures of tax rates, collections, burdens, and more.
2 min read
Individual income taxes are a major source of state government revenue, accounting for more than a third of state tax collections. How do income taxes compare in your state?
9 min read
Retail sales taxes are an essential part of most states’ revenue toolkits, responsible for nearly a quarter of combined state and local tax collections.
18 min read
Forty-four states levy a corporate income tax, with top rates ranging from a 2 percent flat rate in North Carolina to an 11.5 percent top marginal rate in New Jersey. Four states—Georgia, Nebraska, North Carolina, and Pennsylvania—reduced their corporate income tax rates effective January 1, 2026.
5 min read
Property taxes are the primary tool for financing local governments. While no taxpayers in high-tax jurisdictions will be celebrating their yearly payments, property taxes are largely rooted in the benefit principle of taxation: the people paying the property tax bills are most often the ones benefiting from the services.
9 min read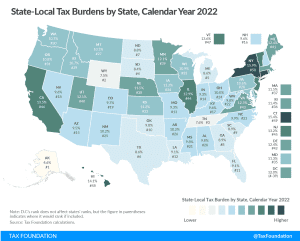
Tax burdens rose across the country as pandemic-era economic changes caused taxable income, activities, and property values to rise faster than net national product. Tax burdens in 2020, 2021, and 2022 are all higher than in any other year since 1978.
24 min read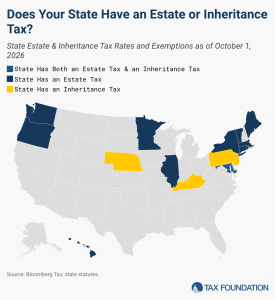
In addition to the federal estate tax, which has a top marginal rate of 40 percent, 12 states and the District of Columbia impose estate taxes, while five states levy inheritance taxes.
8 min read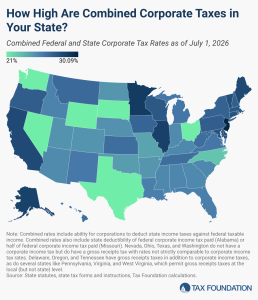
Corporations in the United States pay federal corporate income taxes levied at a 21 percent rate. Forty-four states and D.C. also levy taxes on corporate income, with top marginal rates ranging from 2.5 percent in North Carolina to 11.5 percent in New Jersey.
2 min read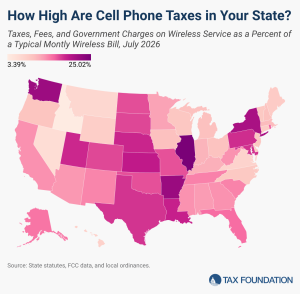
Applying the sales tax, a traditional broad-based consumption tax, is perfectly appropriate, but excessive targeted taxation of wireless services lacks the traditional justifications—a user-pays system or the internalization of social costs—for excise taxation, raising consumer costs and discouraging investment.
5 min read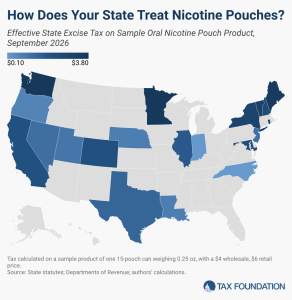
Oral nicotine pouches have rapidly become a popular option for consumers who want nicotine without the harmful combustion and chemicals of traditional cigarettes. As these alternative nicotine products (ANPs) successfully draw smokers to non-combustible nicotine consumption, many states have scrambled to incorporate these new products into their tax regimes.
6 min read
California levies the highest tax on gasoline at 73.6 cents per gallon (cpg), followed by Illinois at 70.4 cpg and Indiana at 63.1 cpg.
10 min read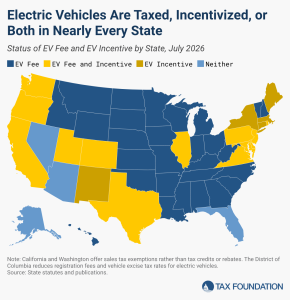
As the market share of electric vehicles (EVs) on the road grows, the gas tax’s ability to fund road projects and decrease traffic congestion erodes. Both federal and state real tax revenue per vehicle mile traveled has been on a steady decline for decades, creating a fiscal gap for road expenditures even as the demand for road infrastructure improvements has grown.
6 min read