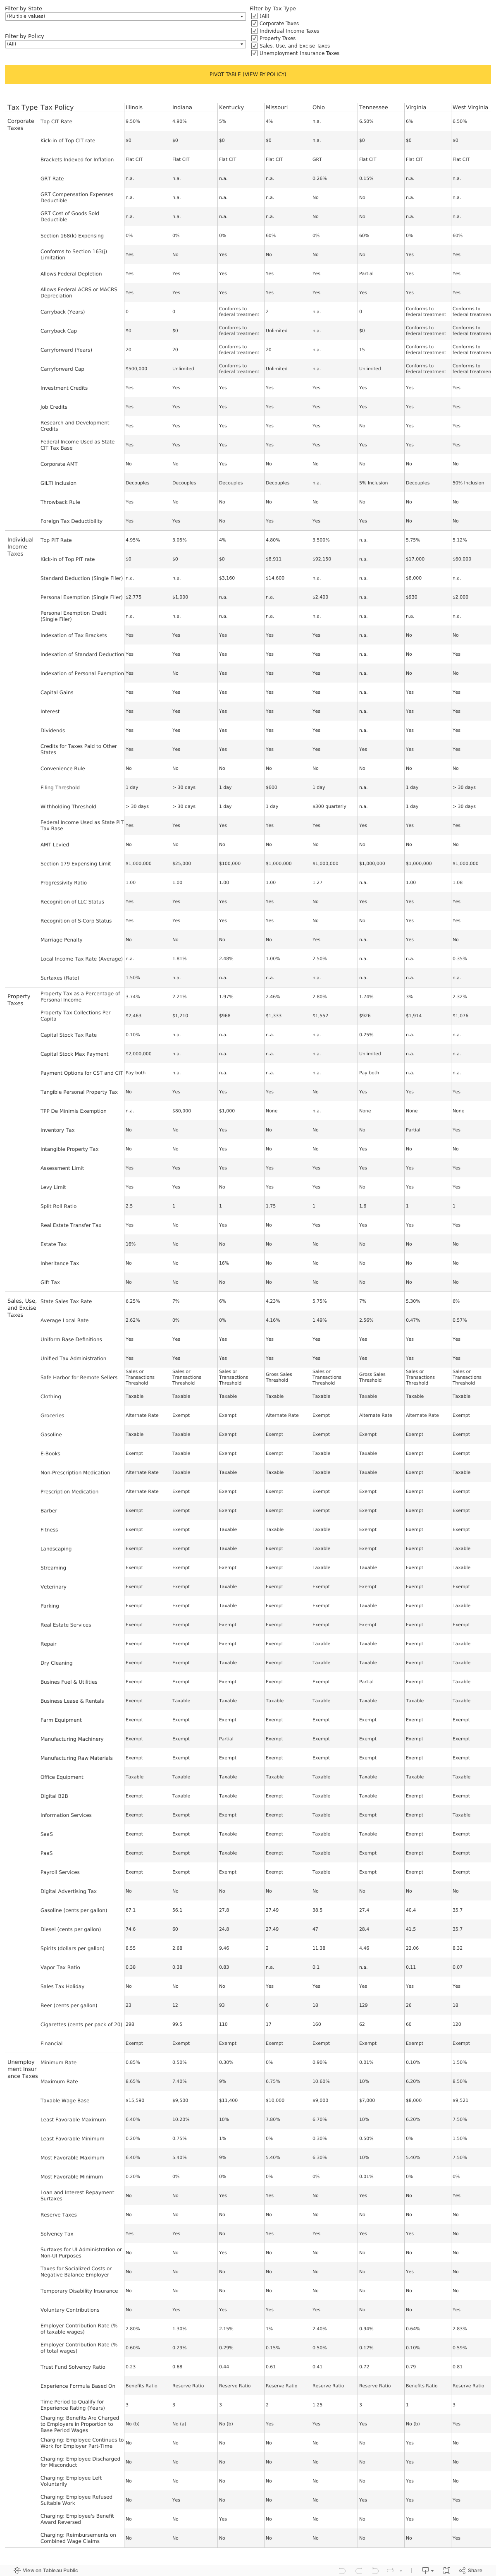
Kentucky‘s tax system ranks 22nd overall on the 2025 State Tax Competitiveness Index. Kentucky’s tax competitiveness has improved substantially in recent years due to several rounds of reforms that broadened the sales tax base to additional categories of mostly final personal consumption while moving to a single-rate individual income tax at a substantially lower rate. However, many other areas of the Commonwealth’s tax code are riddled with antiquated and complex provisions that remain ripe for reform.
Specifically, Kentucky is one of few states that levy income-based taxes on individuals and businesses not just at the state level, but also at the county and municipal levels in the form of occupational license taxes and net profit taxes. In addition to individual and corporate income taxes, Kentucky levies a limited liability entity tax (LLET), which is a gross receipts-based alternative minimum tax on C corporations and limited liability pass-through businesses owed even when businesses do not turn a profit. Kentucky is further hindered by its lack of bonus depreciation allowance for corporate machinery and equipment investments. While Kentucky’s Section 179 small business expensing allowance is broadly available because the Commonwealth does not conform to the federal phaseout threshold, Kentucky’s expensing limit of $100,000 is much lower than the $1 million expensing limit offered in most states.
Kentucky is a notable outlier in applying its tangible personal property taxes to business inventory, a highly distortionary practice that has been abandoned in most states. Furthermore, Kentucky levies an inheritance tax that kicks in at a low level, affecting beneficiaries across the income spectrum, not just the affluent. Additionally, Kentucky’s UI tax ranking is hindered by high maximum rates and a surtax, but recent action to shorten the experience rating waiting period brought needed improvement on this component.
However states choose to respond to other tax provisions of the One Big Beautiful Bill Act, they should conform to the pro-growth provisions, which represent a marked improvement in the corporate tax code.
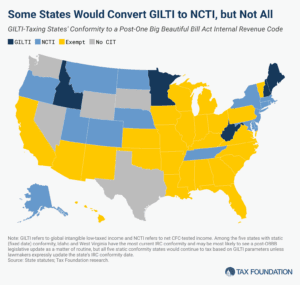
The One Big Beautiful Bill’s changes to the taxation of international income have surprising implications for state codes, yielding tax increases and a revised tax base that, through quirks of state incorporation, bears very little resemblance to the federal base and almost nothing of its purpose.