Key Findings
- Improvements in the long-run standard of living largely depend on peoples’ willingness to work and their ability to invest in capital. TaxA tax is a mandatory payment or charge collected by local, state, and national governments from individuals or businesses to cover the costs of general government services, goods, and activities. policy has a significant effect on removing barriers to work and investment.
- All tax systems contain features that discourage work and investment, thus imposing economic costs that reduce living standards. Additionally, taxes impose administrative costs for the government and compliance costs for taxpayers.
- Two major types of taxes include income taxes, which generally tax people when they earn money and when they see changes in net worth such as returns from saving and investment, and consumption taxes, which generally tax people when they spend money.
- Income taxes impose steeper economic costs, and often steeper administrative and compliance costs, than consumption taxes. They place a higher tax burden on saving and investment. They also impose significant administrative and compliance costs that undermine the large anti-poverty programs for families and children administered through the tax code. Moving to a consumption taxA consumption tax is typically levied on the purchase of goods or services and is paid directly or indirectly by the consumer in the form of retail sales taxes, excise taxes, tariffs, value-added taxes (VAT), or an income tax where all savings is tax-deductible. would end the tax bias against saving and investment and provide an opportunity to greatly simplify anti-poverty programs embedded in the tax code.
- We model two revenue-neutral consumption tax reform options: replacing the corporate income taxA corporate income tax (CIT) is levied by federal and state governments on business profits. Many companies are not subject to the CIT because they are taxed as pass-through businesses, with income reportable under the individual income tax. with a 6.4 percent value-added tax and replacing the corporate and individual income taxAn individual income tax (or personal income tax) is levied on the wages, salaries, investments, or other forms of income an individual or household earns. The U.S. imposes a progressive income tax where rates increase with income. The Federal Income Tax was established in 1913 with the ratification of the 16th Amendment. Though barely 100 years old, individual income taxes are the largest source of tax revenue in the U.S. with a business profits and progressive household compensation tax. Both options would replace major individual tax credits with a flat credit per filer and dependent.
- Both options result in higher economic output and higher after-tax incomeAfter-tax income is the net amount of income available to invest, save, or consume after federal, state, and withholding taxes have been applied—your disposable income. Companies and, to a lesser extent, individuals, make economic decisions in light of how they can best maximize their earnings. for lower-income households and families while raising roughly the same amount of tax revenue for the federal government in the long run, illustrating that pro-growth tax reform can raise long-run living standards.
Introduction
The size of the U.S. economy, as well as the standard of living Americans enjoy, is determined by the level of labor, capital, and technology people provide.[1] Labor is the number of hours people work; capital is how much equipment, buildings, software, and the like is available to work with; and technology is how efficiently people combine the other two factors to make things or provide services other people want.
Substantial evidence shows tax policy has a significant effect on peoples’ decisions about how much to work[2] and how much to invest in capital.[3] While all tax systems contain features that discourage work, saving, and investment, leading to a smaller economy and lower living standards, taxes can be designed to minimize such economic costs.
In addition to economic costs, government agencies incur administrative costs as they enforce tax rules and individuals incur compliance costs as they spend time and money to follow tax rules.
Reforming the tax code can reduce each type of cost imposed by the tax system and increase the standard of living American families enjoy. Reducing the economic cost of taxes can lead to increases in employment, wages, output, and, ultimately, after-tax income. Reducing the administrative burden on the government and the compliance burden on individuals adds to the gains in after-tax income by reducing time and money spent enforcing and complying with tax rules.
Currently, the U.S. income tax code is set to undergo dramatic, scheduled changes in 2026 as most of the Tax Cuts and Jobs Act (TCJA) expires. The scheduled changes offer an opportunity to transform how the U.S. raises revenue for government services. Genuine and permanent overhaul could reduce the economic, administrative, and compliance costs imposed by the current income tax and lead to improvements in the well-being of families and children by:
- Improving employment opportunity
- Increasing living standards
- Removing tax barriers to saving and building wealth
- Streamlining complex social benefits currently administered to families through the Internal Revenue Service (IRS).
Rising living standards are a vital component for advancing human well-being. The concept of well-being is multi-faceted and includes several dimensions related to material abundance such as income and wealth, housing, and work and job quality; well-being also includes dimensions like social connections, civic engagement, safety, and environmental quality.[4] Well-being requires people to be able to thrive across many aspects of life in pursuit of greater meaning.[5]
While increased economic growth and material living standards do not make up the entirety of human well-being, material prosperity is strongly correlated with better outcomes for people across a variety of alternate measures. For example, self-reported life satisfaction is correlated with gross domestic product (GDP) per capita across countries.[6] Similarly, other measures such as levels of air pollution and even levels of interpersonal trust are also strongly correlated with rising incomes.[7]
Other measures of well-being, such as life expectancy and child mortality, also are correlated with higher per capita incomes.[8] While imperfect, living standards as measured by metrics like GDP “provide a great deal of information that is closely related to welfare.”[9] Economic progress and rising living standards help provide greater access to goods and services needed to fulfill human needs, ranging from improved health care, infrastructure, education, and leisure time for pursuits with friends and family.[10]
In the interest of supporting rising living standards and economic growth to advance well-being for families, we will outline two options to reform the current U.S. income tax by transforming it into a consumption tax. The transformation imposes tax when goods and service are consumed rather than when income is earned.
We begin with background on consumption taxes and how they can be structured followed by a review of studies and international examples of consumption taxes. We then turn to an overview of the current U.S. tax system and model two tax reform options.
We find a consumption tax reform would reduce the economic, administrative, and compliance costs of the U.S. tax system, leading to increases in employment, wages, output, and incomes while improving the long-term well-being of American families and children.
Background on Consumption Taxes
Taxes can be structured in many different ways with varying economic, administrative, and compliance costs. Two major tax types are income taxes and consumption taxes.
Income taxes generally levy a tax on taxpayers when they earn money and when they see changes in their net worth, such as from returns from saving and investment. Changes in net worth, however, usually become consumption later. That’s because income is either consumed immediately when it is earned or, if consumption is deferred by saving, income is consumed in the future after it has been saved.
As such, an income tax system double taxes or places a higher tax burden on future or deferred consumption. Such double taxationDouble taxation is when taxes are paid twice on the same dollar of income, regardless of whether that’s corporate or individual income. is problematic for individuals and families. It creates a tax penalty on saving and investment because income that is saved or invested to consume in the future faces a higher tax burden than income that is consumed right away. Taxing income also requires complicated determinations on how to define income, which increases the complexity of the tax code and makes it harder for families to file their taxes and claim certain tax benefits.
In contrast, a consumption tax only taxes income once whether it is consumed right away or saved and consumed in the future. Thus, it removes the tax penalty on saving and investment created by an income tax. Removing that tax penalty means people save and invest more, resulting in higher economic output, employment, wages, and income. That is why a long academic literature has found consumption taxes to be maximally economically efficient and simpler to administer.[11]
To illustrate the higher tax burden on saving and investment under an income tax, imagine two people: Taxpayer A earns $100 and consumes it immediately, and Taxpayer B earns $100 and invests it to consume later.
In a world with no taxes, Taxpayer A would immediately consume $100, and Taxpayer B would later consume $110 (after receiving a 10 percent return).
In a world with a 20 percent income tax, Taxpayer A would owe $20 and be able to immediately consume the remaining $80 compared to $100 in a world with no taxes. The income tax reduces her consumption by 20 percent relative to the no-tax situation.
Taxpayer B would owe $20 and be able to save the remaining $80. She would also owe the 20 percent income tax on the $8 return to her $80 in savings, resulting in an additional $1.60 of taxes. After taxes, Taxpayer B is left with $86.40 to consume compared to $110 in a world with no taxes. The income tax reduces her consumption by 21.5 percent relative to the no-tax situation, compared to 20 percent for Taxpayer A who immediately consumed.
Table 1. Comparing the Tax Burden on Immediate Versus Delayed Consumption
| Taxpayer A | Taxpayer B | |
|---|---|---|
| A. Original income | $100, immediately consumed | $100, saved and invested |
| B. Tax owed on original income (A * 20%) | $20 | $20 |
| C. After-tax income (A – B) | $80 | $80 |
| D. Invested income | $0 | $80 |
| E. Return on investment (D * 10%) | $0 | $8 |
| F. Tax owed on investment return (E * 20%) | $0 | $1.60 |
| H. Amount left to consume relative to no tax situation | $80 out of $100 | $86.40 out of $110 |
| I. Percentage Tax Burden in H | 20.0% | 21.5% |
An income tax thus places a higher percentage tax burden on future consumption than current consumption by reducing the after-tax return to saving.
We can compare the 20 percent income tax to a 20 percent consumption tax. Taxpayer A’s situation would remain the same, paying a 20 percent consumption tax on her immediate consumption, yielding $80 of immediate consumption and a 20 percent effective tax rate.
Taxpayer B’s situation would change. Because Taxpayer B does not immediately consume her earnings, she would not face an initial tax, instead saving all $100 of her earnings. Her savings would earn a $10 return. She would face the 20 percent tax when she consumes her $110 in the future, yielding $88 of consumption and a 20 percent effective tax rate.
Table 2. Comparing the Consumption Tax Burden on Immediate Versus Delayed Consumption
| Taxpayer A | Taxpayer B | |
|---|---|---|
| A. Original income | $100, immediately consumed) | $100, saved and invested) |
| B. Amount of income immediately consumed | $100 | $0 |
| C. Tax on immediate consumption (B * 20%) | $20 | $0 |
| D. Amount of income saved and invested | $0 | $100 |
| E. Return on investment (D * 10%) | $0 | $10 |
| F. Amount of income consumed later (D + E) | $0 | $110 |
| G. Tax on delayed consumption (F * 20%) | $0 | $22 |
| H. Total tax owed (C + G) | $20 out of $100 | $22 out of $110 |
| I. Amount left to consume (A + E - H) | $80 out of $100 | $88 out of $110 |
| I. Percentage tax burden in I | 20.0% | 20.0% |
A consumption tax thus results in a neutral tax burden between uses of income. It removes the income tax bias against saving and results in the same effective tax rate on income no matter if it is consumed now or consumed in the future. Though higher-income households save more, treating income neutrally no matter its use is completely separate from the distributional burden of a tax, as any tax type can be structured to meet various distributional goals.
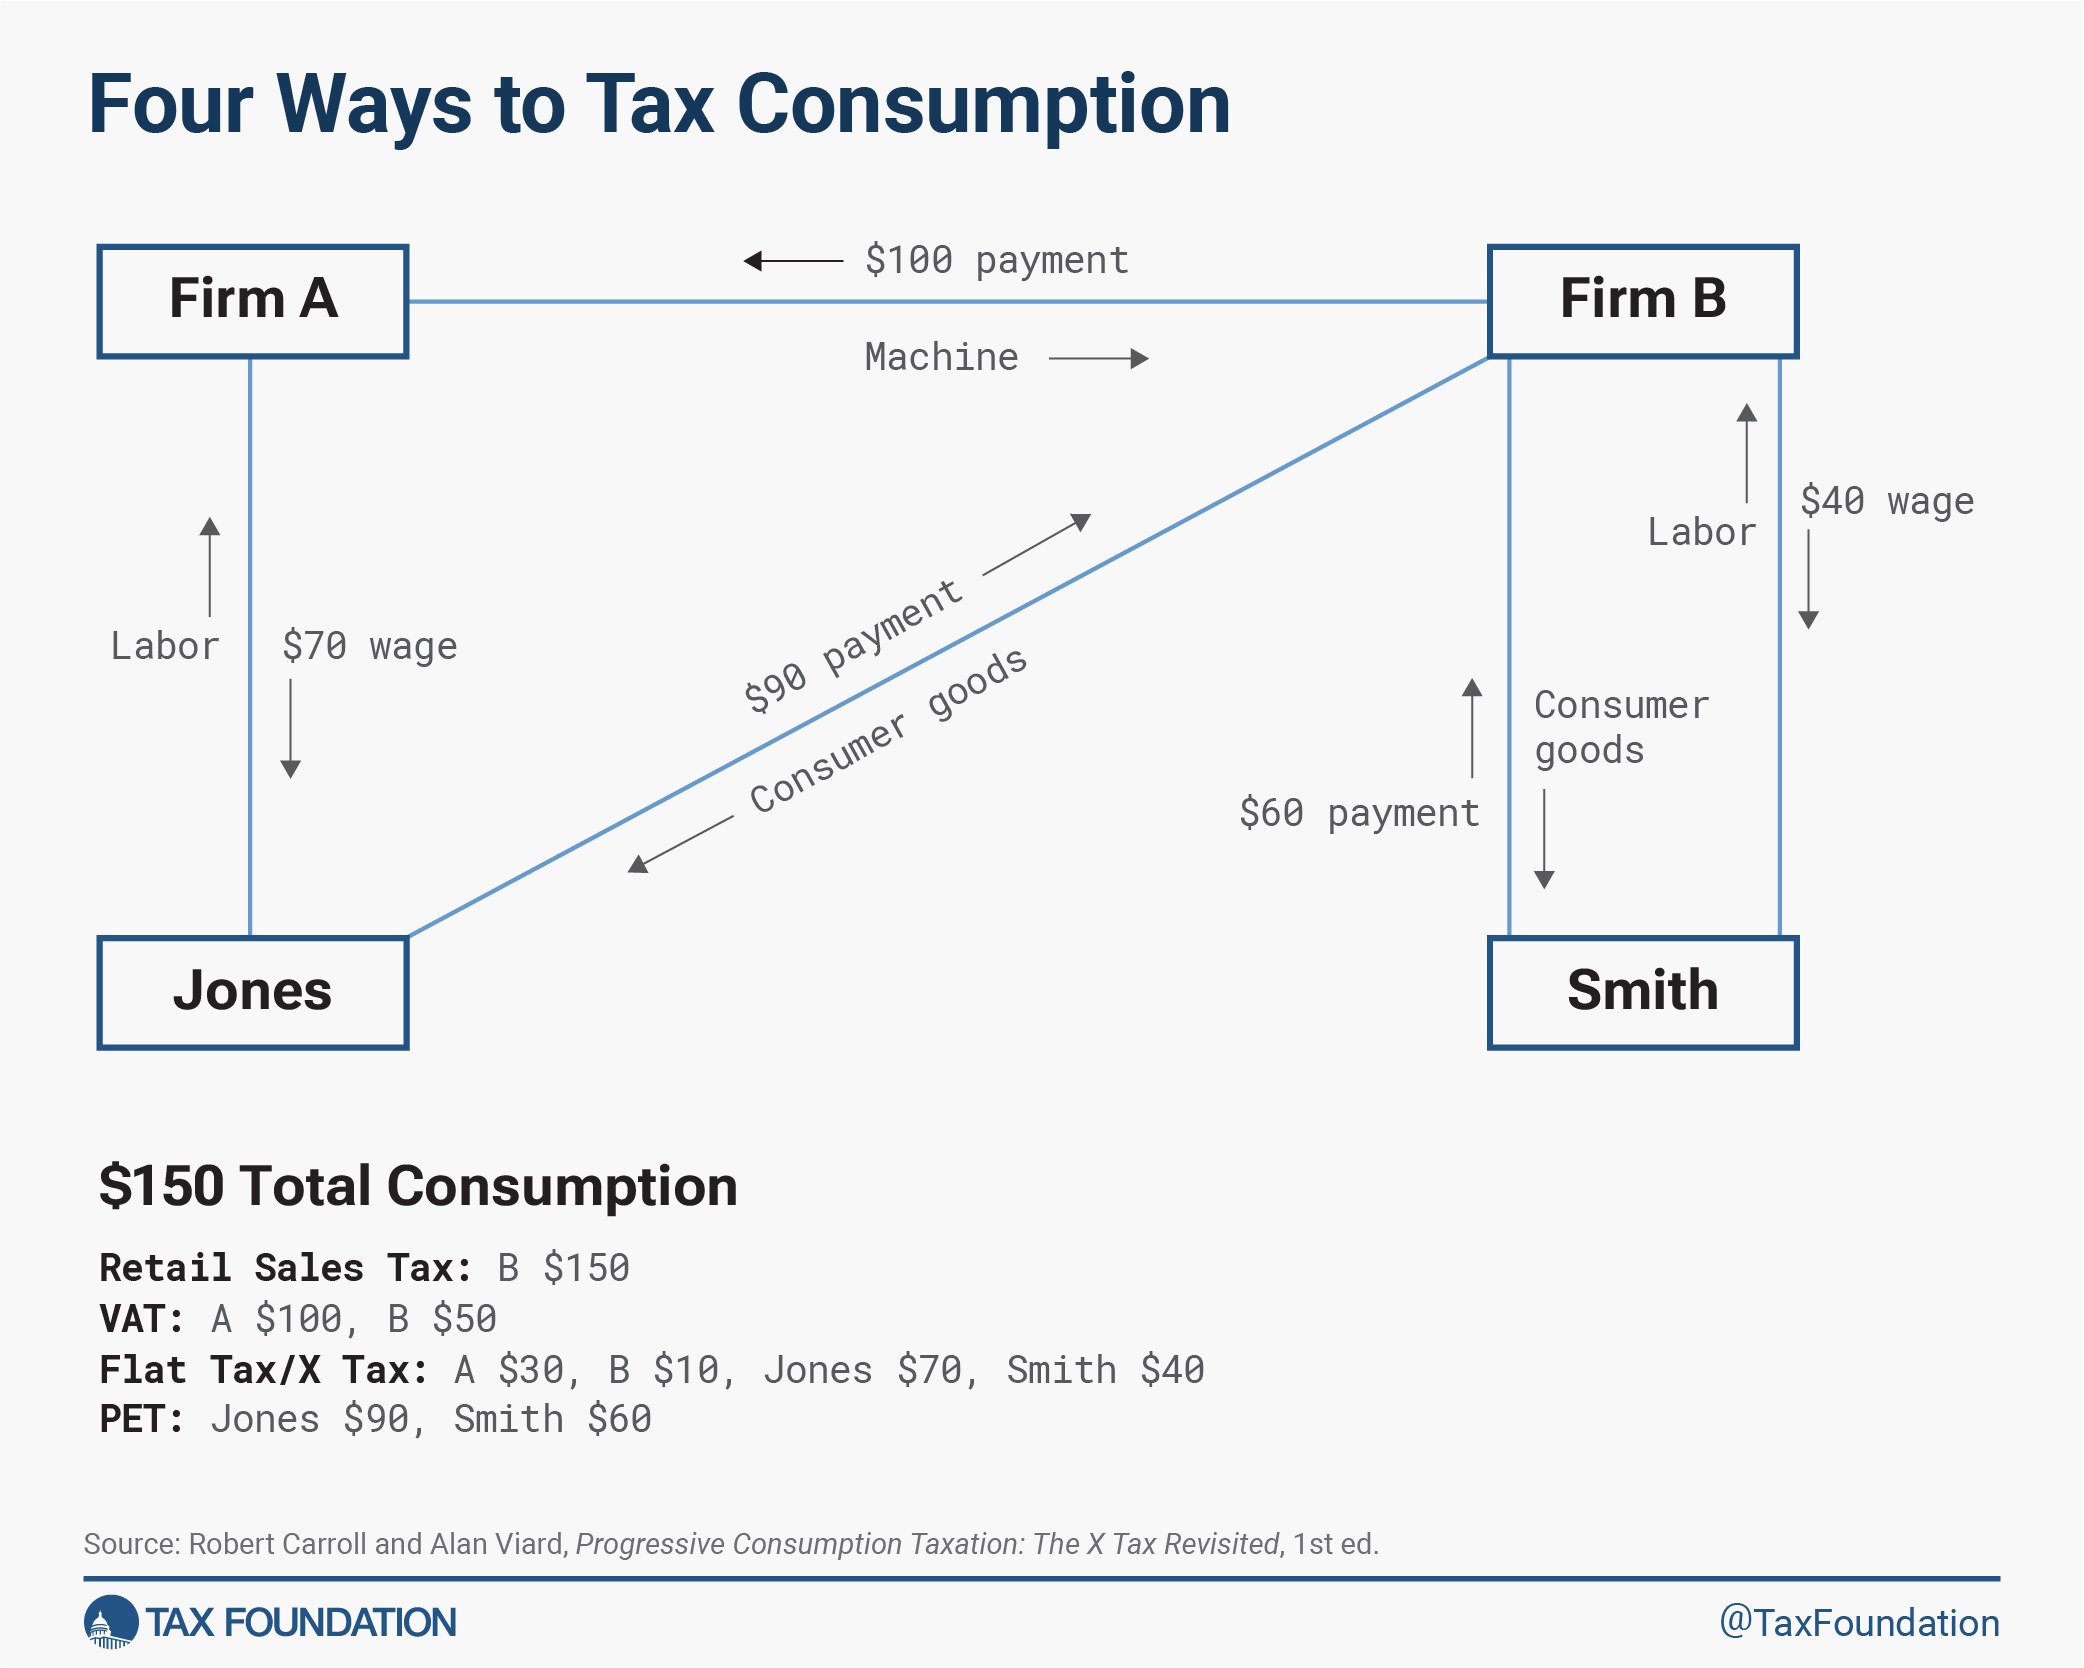
Table 3 outlines four approaches to consumption taxes: the retail sales taxA sales tax is levied on retail sales of goods and services and, ideally, should apply to all final consumption with few exemptions. Many governments exempt goods like groceries; base broadening, such as including groceries, could keep rates lower. A sales tax should exempt business-to-business transactions which, when taxed, cause tax pyramiding. , the value-added tax, the Hall-Rabushka flat taxAn income tax is referred to as a “flat tax” when all taxable income is subject to the same tax rate, regardless of income level or assets. or Bradford X Tax, and the consumed-income tax. While each design is different, all four approaches aim to provide neutral tax treatment between saving and consumption.
Table 3. Four Approaches to Taxing Consumption
| Base | Type and Remitter | Distributional Design Options | |
|---|---|---|---|
| Retail Sales Tax (RST) | Final retail sales to consumers and government (commonly used by U.S. states) | Postpay; Businesses | Cash grants |
| Value-Added Tax (VAT) | Business sales less purchases (equal to RST but collected incrementally) (commonly used by countries across the OECD) | Postpay; Businesses | Cash grants |
| Flat Tax/X Tax | Business sales less purchases and compensation; compensation taxed at individual level (equal to VAT but wages taxed at individual level) | Prepay; Businesses and individuals | Exempt certain level of labor income, X Tax approach applies progressive rate structure on individuals |
| Consumed Income Tax | Household wages and other forms of labor compensation, investment proceeds that are spent, and net borrowing | Prepay; Individuals | Exempt certain level of consumption, progressive rate structure |
The retail sales tax is most obviously a tax on consumption, and while the other three approaches may appear less obvious, they too target the same base. Under an ideal retail sales tax, final sales to consumers and government would face a tax, while business to business transactions would not. Retailers would collect and remit the tax revenue to the government. Retail sales taxes are commonly used by U.S. states and municipalities to raise revenue; as of 2023, 45 states and the District of Columbia levy statewide sales taxes.[12]
A VAT is a modified sales tax, collecting the tax incrementally at each stage of the production process. Businesses would pay taxes on their sales less their purchases from other businesses (or alternatively, pay tax on their sales and receive a credit for taxes paid by other businesses). VATs are commonly used across the OECD, and the U.S. is the only country in the OECD with no VAT as of 2023. Consumption taxes made up about 32.1 percent of OECD tax revenue in 2021.[13]
A flat tax is a further modification, splitting the VAT base in two: businesses would pay taxes on their cash flow (sales less purchases, full deductions for capital investment, and compensation paid), while households would pay taxes on compensation received. Applying a progressive rate schedule at the household level, with the top rate matching the rate on business cash flow is known as the X Tax.[14]
Finally, under a consumed income tax, the entire tax would be collected at the household level on income less saving. Income would include wages and compensation, investment income that is spent, and net borrowing, while saving would include increases in bank deposit accounts and purchases of business assets, financial assets, and owner-occupied housing.
As Figure 1 illustrates, though each tax applies to different transactions, each targets the same base: consumption.
Taxing Consumption Rather Than Income Raises Living Standards
Simulations of moving to a consumption tax and econometric studies of policies that incrementally move away from taxing income toward taxing consumption point to the benefits of taxing consumption rather than income in terms of economic growth and increases in welfare.
Ending the income tax penalty on saving and investment by moving to a consumption tax would boost economic output.[15] Depending on how the transition is designed, all income cohorts can enjoy long-run welfare gains.[16] Simulations of replacing individual and corporate income taxes with various types of consumption taxes find increases in long-run economic output of 5 to 9 percent.[17]
For example, a Treasury Department research paper in 2007 found replacing just the U.S. corporate income tax at the time with a business activity tax (a type of consumption tax that does not tax the normal return to saving or investment) would increase the size of the economy from 2.0 percent to 2.5 percent.[18] The paper explained:
First, because a BAT does not tax the normal return to saving or investment, it is likely to stimulate additional saving and investment. Greater investment means businesses would have more capital, which increases workers’ productivity, and ultimately improves living standards. Second, it would likely reduce a variety of tax distortions that arise under the current tax system due to the uneven treatment of investment and other economic activity.
While most simulations focus on how switching to a consumption tax relieves the tax burden on saving,[19] other simulations have looked at the effect on work effort and productivity. For example, a simulation by Carlos E. da Costa and Marcelo R. Santos finds that switching from a progressive income tax to a progressive consumption tax leads to widespread welfare gains because it results in a more efficient allocation of effort and consumption, which enables more efficient revenue generation for redistribution with welfare improvements ranging from 8.6 percent to 19.0 percent.[20]
While a tax reform that reduces the tax burden on higher-income households, such as moving to a consumption tax from a progressive income tax, may increase inequality in the short-term, other, longer-term effects may work to reduce inequality. Further, even if inequality increases, if a tax reform boosts economic growth, absolute living standards can rise across the income spectrum.[21]
As an example, a reduction in income tax progressivity, according to OECD research, “can also raise incentives to save and invest in human capital and so potentially result in increases in lifetime incomes and reductions in lifetime inequality.”[22] The paper continues:
Tax policy should be considered inside a broader framework of structural reforms for inclusive growth. Taxation is often a second-best policy instrument in achieving inclusive growth policy design. In many cases, inclusive growth challenges are best tackled at source… OECD research has highlighted the need to shift the tax mix away from income taxes towards taxes that have less negative impacts on economic growth, including taxes…on consumption.
In other words, prioritizing a tax code that is simple and pro-growth can raise revenues for government spending priorities while boosting living standards relative to the tax system we have today. Like studies that simulate the benefits of moving toward consumption taxes, econometric studies likewise indicate benefits from taxing consumption.
Economist Anh Ngyuen and her coauthors examined the effects of individual income, corporate, and consumption taxes in the United Kingdom from 1973 to 2009. They found that switching from an income tax baseThe tax base is the total amount of income, property, assets, consumption, transactions, or other economic activity subject to taxation by a tax authority. A narrow tax base is non-neutral and inefficient. A broad tax base reduces tax administration costs and allows more revenue to be raised at lower rates. to a consumption tax base had positive effects on growth, as both individual income and corporate income taxes in their study were found to be more distortionary.[23]
Perhaps the best real-world evidence on the relationship between consumption taxes and economic growth are studies that examine the effects of reducing taxes on saving and capital investment.
For example, the policy of full expensingFull expensing allows businesses to immediately deduct the full cost of certain investments in new or improved technology, equipment, or buildings. It alleviates a bias in the tax code and incentivizes companies to invest more, which, in the long run, raises worker productivity, boosts wages, and creates more jobs. allows businesses to fully deduct the cost of their investments from their taxable incomeTaxable income is the amount of income subject to tax, after deductions and exemptions. For both individuals and corporations, taxable income differs from—and is less than—gross income. at the time investments occur (a feature of a consumption tax base) rather than depreciating them over time (a feature of an income tax base).
The academic evidence has shown that past reforms in the U.S. that expanded bonus depreciationBonus depreciation allows firms to deduct a larger portion of certain “short-lived” investments in new or improved technology, equipment, or buildings in the first year. Allowing businesses to write off more investments partially alleviates a bias in the tax code and incentivizes companies to invest more, which, in the long run, raises worker productivity, boosts wages, and creates more jobs. boosted investment and employment.[24] As our colleague noted:
In a study that analyzed how a sample of more than 120,000 firms responded to the two bonus expensing episodes, Zwick and Mahon found that the policy had a substantial impact on investment. Relative to capital assets that were not eligible for bonus expensing, firms increased their investment in eligible equipment by “10.4 percent on average between 2001 and 2004, and 16.9 percent between 2008 and 2010.”
In a separate study using the same data set, Garrett, Ohrn, and Suárez Serrato estimated that the two episodes of bonus depreciationDepreciation is a measurement of the “useful life” of a business asset, such as machinery or a factory, to determine the multiyear period over which the cost of that asset can be deducted from taxable income. Instead of allowing businesses to deduct the cost of investments immediately (i.e., full expensing), depreciation requires deductions to be taken over time, reducing their value and discouraging investment. led to $5.82 trillion of investments and 6.24 million jobs during that period. Depending on the baseline from which the overall budgetary cost is measured, they estimate that the cost-per-job created from the bonus expensing policy was between $20,000 and $50,000.
Moving to full expensing, an incremental step toward a consumption tax base for businesses, reduces the cost of capital and incentivizes businesses to invest more, which in turn boosts productivity growth and economic output, illustrating the benefits of consumption tax reform.
International Examples of VATs
Consumption taxes are a significant source of revenue for governments across the world, making up 32.1 percent of tax revenues on average among OECD countries as of 2021.[25] In most countries, the primary consumption tax is a VAT. The number of countries with a VAT increased from 3 in 1965 to 166 as of 2016. One reason for the growing adoption is the positive efficiency characteristics of the VAT. VATs also replaced turnover taxes that applied to gross receipts, a more inefficient form of tax.[26]
Meanwhile, the United States is the only country in the OECD that does not levy a VAT, instead taxing consumption primarily via retail sales taxes at the state and local level as well as select excise taxes. While the ideal base for sales taxation is all goods and services at the point of sale to the end-user, many retail sales taxes fall on business inputs, hampering economic growth.[27]
The significant and varied experience of OECD countries with VATs can inform the debate of adopting a consumption tax in the U.S. The average standard VAT rate in the OECD is 19.3 percent and the OECD average tax base ratio is 54 percent.[28] Among OECD countries, some stand out as examples for good VAT policies that have relatively low rates, broad tax bases, and low compliance costs. For example, New Zealand has the broadest tax base covering nearly 100 percent of total consumption. Luxembourg and Estonia follow with ratios of 78 percent and 73 percent, respectively.
Several countries, however, exempt or provide special, lower rates to many goods and undermine the efficiency of their VAT or have high administrative burdens. Recent research shows that reduced rates and exemptions are not an effective way of achieving objectives such as supporting low-income households or addressing environmental externalities.[29]
Even if the intention is to support those who earn little income, individuals across the income distribution will also benefit from the reduced rates. Therefore, a refundable food tax creditA tax credit is a provision that reduces a taxpayer’s final tax bill, dollar-for-dollar. A tax credit differs from deductions and exemptions, which reduce taxable income rather than the taxpayer’s tax bill directly. or other targeted policies would be more effective than the untargeted reduced VAT rates that have proved to be a poor policy tool for addressing income disparities.
Reduced rates and exemptions within VATs can lead to significant reductions in revenue potential as well as higher administrative and compliance costs. For example, in 2020, the average actionable VAT policy gap (additional VAT revenue that could realistically be collected by eliminating reduced rates and certain exemptions) in the EU was 16.4 percent—more than triple the size of the compliance gap.[30]
International experiences with VATs, varied as they may be, all point to the lesson of maintaining as broad a consumption tax base as possible with a single standard rate, and using direct policy means to achieve other goals. Further, specific experiences with VAT implementation can be instructive on other aspects of adopting a consumption tax.
Canada’s Value-added Tax
The Canadian experience of moving to a VAT illustrates the benefits of reducing the cost of capital for business investment. It also offers important lessons for the administration of a new consumption tax system. Canada illustrates how cooperation between national and subnational governments can reduce administrative costs while warning that carving up the tax base through exemptions and rebates claws back some benefits of moving to a broad-based consumption tax.
Canada levies a federal value-added tax (called the Goods and Services Tax, or GST) at a rate of 5 percent. The GST in Canada replaced an earlier tax called the Manufacturer’s Sales Tax (MST). Nearly half the revenue collected from the MST came from business inputs rather than final consumption, leading to a higher cost of capital for business investment as the tax cascaded through the steps of the production process and increased final prices to consumers.[31] One of the leading factors for VAT reform was to remove the disincentive for business investment created by taxing business inputs under the MST.
After initial implementation of the VAT, through decades of negotiations between federal and provincial governments, five provinces now levy fully harmonized provincial VATS (called Harmonized Sales Taxes or HSTs) and Quebec levies the Quebec Sales Tax (QST, a VAT).[32] The GST and HST are now jointly administered and do not require businesses to complete separate filings because they apply to the same tax base and follow the same tax rules. The QST is structured the same way as the GST and HST, but it is administered separately by Revenue Quebec (which also administers the GST in the province). Additionally, some provinces levy a completely separate retail sales tax that is not a VAT.
Research conducted in the period after several provinces replaced their retail sales taxes with harmonized VATs found investment in machinery and equipment rose 12.2 percent above trend in the years following the reforms, resulting from a reduction in the tax burden on business capital.[33]
Of particular interest to U.S. policymakers, as detailed by Richard M. Bird of the University of Toronto, the fiscal reform in Canada that led to the GST “has not resulted to any significant extent either in higher taxes or bigger governments, but rather in governments being able to finance their expenditures in economically less damaging ways.”[34] The value-added taxes in Canada, unique from VATs in Europe, are listed separately on receipts to final consumers. The heightened salience of the VATs may help create political pressure to keep rates from rising.
Bird also notes that while administration of the tax is considered good compared to other countries, the administrative problems that are encountered are most prominently due to tax design rather than management. In particular, decisions to narrow the base and provide complex rebates increase the administrative costs of the tax, offering another lesson to U.S. policymakers of the importance of a broad, simple tax base.
Australia’s Value-added Tax
The Australian experience demonstrates the short-lived impact on prices, consumer spending, retail sales, and the overall economy when transitioning to a consumption tax.
In July 2000, Australia cut personal income taxes and abolished several harmful excise and sales taxes and replaced them with a 10 percent Goods and Services Tax (GST, another name for a VAT). The reform included bonus payments to retirees, increases in pensions, child tax offsets and family benefit increases, and payments to individuals outside the tax and pension systems, in part to relieve the transitional impact of the GST on particular groups.
Government studies indicate the effect of implementing the GST on prices was a one-off and transitory increase in the price level, and other transitional impacts “appear to have ‘washed out’ over the first two years.”[35] Independent research likewise found a clear inflationary impact in the quarter the tax was implemented but no additional price effects before or after that single quarter.[36]
The Australian government also analyzed the transition to a consumption tax in Japan, New Zealand, Canada, and Singapore, finding a general pattern of acceleration in household consumption prior to adoption, followed by a decline, and a distinct, one-off increase in the price level.[37] Their experiences suggest price level changes should not be a major concern for U.S. policymakers interested in moving toward consumption taxes.
Flat Taxes in Estonia, Latvia, and Slovakia
Starting in the 1990s, several former Soviet-bloc countries abandoned their progressive income tax systems and replaced them with flat taxes. Although they still taxed income broadly, some sought to eliminate the prevalence of double taxation by eliminating taxes on dividends and inheritances, moving closer to a consumption tax system.
Estonia was the first to adopt a flat tax, imposing a 26 percent flat rate in 1994, which has since been lowered to 20 percent.[38] In the early 2000s, Estonia reformed its corporate tax system to tax profits only when they are distributed at 20 percent, fully exempting dividends from individual income taxation.[39] Estonia also imposes a VAT of 20 percent.
Following Estonia’s lead, Latvia also switched to a flat tax system in the 1990s, adopting a rate of 25 percent which has since fallen to 23 percent, while also imposing a VAT at a slightly lower rate. Latvia and Georgia are the only other countries to tax distributed profits only. Latvia levies the tax at a 20 percent rate like Estonia, and Georgia levies it at a 15 percent rate.[40]
Slovakia pursued similar reform in the early 2000s. Prior to 2004, Slovakia imposed a progressive taxA progressive tax is one where the average tax burden increases with income. High-income families pay a disproportionate share of the tax burden, while low- and middle-income taxpayers shoulder a relatively small tax burden. on income, a corporate income tax, and a VAT. Following a desire to create a simple and transparent tax system, Slovakia switched to a flat tax of 19 percent on all income and eliminated all taxes on dividends and inheritances.[41] The reform effectively removed the double taxation of income that characterizes most income tax systems. The policies were eventually reversed in 2012 under a different administration and a progressive income tax was reinstated. One OECD analysis estimated that a reversal of the flat tax in Slovakia would reduce aggregate incomes, and the reduction in economic growth would reduce tax revenue.[42]
Each country experienced substantial growth post-reform, with Estonia and Latvia converging significantly with other European countries in terms of GDP per capita.[43] Slovakia also experienced strong growth in the 2000s, with foreign direct investment (FDI) in particular showing substantial increases.[44] One paper estimated that switching to a distributed profits taxA distributed profits tax is a business-level tax levied on companies when they distribute profits to shareholders, including through dividends and net share repurchases (stock buybacks). in Estonia boosted firm investment and labor productivity, and also reduced firms reliance on debt-financing.[45] Follow-up modeling found similar positive effects for the Estonian reform.[46]
Practical and Implementation Issues in the U.S.
The Current U.S. Hybrid Tax System and Its Effects
The current federal tax code is not a pure version of either a consumption tax or income tax. It most closely resembles a broad income tax, generally taxing a person’s current earnings (whether spent or saved) plus the change in the value of their existing assets (such as dividends, capital gains, interest, etc.). In some cases, however, it adopts consumption tax provisions like retirement savings accounts for individuals and investment deductions for businesses.[47] In all, the current U.S. tax system distorts saving and investment decisions and holds back economic growth, reducing the living standards of American families.
For example, the current business tax system reduces incentives to invest by its differing treatment of different types of investment, firm structure (corporate versus noncorporate), and financing method. The nearby table illustrates the distortions created under current law as different types of investments face drastically different marginal tax rates in 2023.
Higher marginal tax rates on capital increase the required rate of return for a given investment to be viable, meaning the tax system can prevent otherwise worthwhile investments from occurring. Over time, high marginal tax rates can reduce the size of the capital stock, which harms workers by reducing labor productivity and wages.[48]
Table 4. Marginal Tax Rates on Capital in 2023
| Nonresidential Equipment | Nonresidential Structures | Residential Property | Research and Development and Own-Account Software | Other Intellectual Property Products | Inventories |
|---|---|---|---|---|---|
| 9.8% | 21.0% | 25.3% | -4.9% | 14.5% | 30.6% |
Standard economic analysis assigns 25 percent to 50 percent of the corporate income tax burden to workers, and in some cases, workers’ share of the burden can be even higher.[49] Further, research in Germany has shown that higher corporate taxes reduce wages the most for low-skilled, women, and young workers, which significantly reduces the assumed progressivity of corporate income taxes.[50]
In addition to discouraging decisions to work, save, and invest, complying with existing income tax rules is very costly. Tax Foundation estimates the compliance burden across individual and business income tax returns exceeds $300 billion annually.[51] Each year, billions of hours and dollars are diverted away from productive uses, instead wasted on complying with an increasingly complex web of tax rules.
Compliance costs are particularly important for entrepreneurs and their decision to enter or exit an industry. High compliance costs can discourage entrepreneurs from beginning a venture, creating structural barriers to entry beyond the negative economic incentives created by high marginal tax rates on work, saving, and investment.[52] This, in turn, reduces living standards for families with children, both for families who are entrepreneurs themselves and for families who benefit from increased entrepreneurship.
Social Benefits Embedded in the Tax System Lead to Complexity
Consumption tax reform can boost after-tax income for families with children, simplify the tax filing experience, and ensure a robust system for raising revenue for government programs.
The individual income tax system contains some of the U.S.’s largest support programs for families with children, most notably the Child Tax Credit (CTC) and the Earned Income Tax Credit (EITC), which encourage work participation and supplement income. Both credits phase in with earned income (wages or self-employment income) to create an incentive to work, plateau, and then phase-out when income exceeds certain thresholds. In 2022, the EITC provided $63 billion in support; the CTC, $124 billion.[53] Both credits are also refundable, meaning the credits allow a taxpayer to reduce their income tax liability until it reaches zero and then receive any additional credit they are eligible for as a refund payment.
The Congressional Research Service (CRS) estimates the income tax reduces the share of total individuals in poverty by 15 percent (from 14.7 percent to 12.5 percent in 2020, concentrated among families with both children and workers).[54] Together, the refundable CTC and EITC lifted more than 5 million people above the poverty line in 2020.[55] More recently, the temporary expansion of the CTC during the pandemic under the American Rescue Plan Act, which increased the maximum credit and made it fully available to households with little to no income, lifted an additional estimated 2.1 million children above the poverty line.[56]
Reducing material hardship is a worthy goal. Income poverty causes negative outcomes for children; and many studies have found that reducing material poverty, including through income transfers, translates into improved outcomes for children.[57]
For instance, a review of the EITC literature by the National Academy of Sciences concluded, “Periodic increases in the generosity of the Earned Income Tax Credit Program have improved children’s educational and health outcomes” such as reducing the likelihood of low infant birth weight and increasing college attendance.[58]
Embedding much of the social safety net in the income tax code, however, creates complexities for families and limits the effectiveness in providing support to households who do not file taxes.
The CTC and EITC depend on often-complicated family characteristics, leading to difficulties for families. For example, to qualify for the EITC, taxpayers must meet at least 20 requirements.[59] Partially as a result, the EITC suffers from a relatively high rate of incorrectly issued payments—it reached 32 percent, or $18 billion, in fiscal year 2022.[60] Both overpayments and underpayments are mostly due to qualifying child errors.[61]
The relationship, residency, and identification tests legally required to qualify for the CTC are likewise difficult for families to comply with and for the IRS to enforce, especially for families with complex living arrangements.[62] It suffered from an overpayment rate of 16 percent or $5 billion in fiscal year 2022.[63] For several years, the Taxpayer Advocate’s Annual Report to Congress has recommended reform of the credits chiefly because of their complexity.[64]
Perhaps a reflection of the high improper payment rate, auditA tax audit is when the Internal Revenue Service (IRS) conducts a formal investigation of financial information to verify an individual or corporation has accurately reported and paid their taxes. Selection can be at random, or due to unusual deductions or income reported on a tax return. rates for EITC returns are disproportionately high, creating another significant burden for lower-income families.
In 2017, more than 27 million tax returns claimed the EITC while about 126 million did not. The IRS audited 1 percent of the EITC returns, resulting in 280,000 audits, and audited 0.3 percent of non-EITC returns, resulting in 420,000 audits.[65] Research finds lower-income taxpayers often face barriers to understanding and effectively participating in audits, further increasing the disproportionate burden.[66]
Embedding support in the tax system creates additional difficulties for low-income families. Unlike other relief programs that provide monthly payments, the refundable tax credits are lump sum payments. Research indicates the credits supply about 9 to 13 percent of income for lower-income households,[67] meaning some families receive the largest single share of their annual income at tax filing time.
It can, however, be difficult to predict the size of credits from year to year. For example, about 40 percent of low-income families with children see EITC decreases of more than $500, while 19 percent see CTC decreases of more than $500.[68] The decreases are most often due to higher incomes, but unpredictable changes in family characteristics can also cause changes. Large, yearly swings in eligible credit size present a challenge for advancing the benefits on a regular basis outside the tax filing season. Further, most refundable tax creditA refundable tax credit can be used to generate a federal tax refund larger than the amount of tax paid throughout the year. In other words, a refundable tax credit creates the possibility of a negative federal tax liability. An example of a refundable tax credit is the Earned Income Tax Credit (EITC). beneficiaries rely on paid tax preparers whose fees can capture up to 20 percent of EITC refunds.[69]
While the current income tax code reduces material hardship, primarily for working taxpayers with children, it falls short on simplicity and efficiency grounds. The status quo warrants massive simplification.
Distributional and Design Choices
Two commonly cited concerns when moving to a consumption tax are the distributional impact and transition. We briefly discuss both concerns and highlight options policymakers may implement to address them.
Consumption taxes are generally assumed to have a regressive distribution. When the burden of a consumption tax is measured as a share of current income, studies tend to show lower-income people pay a higher share of their income than higher-income people. That is primarily because lower-income households tend to consume a relatively larger share of their income than higher-income households, while higher-income households save a larger share of their income.
When consumption taxes are measured as a share of current expenditures, however, research indicates they are proportional, or in some cases, even progressive.[70] The expenditures approach is useful because it recognizes that income saved will eventually be spent, facing the consumption tax at that time.
Nevertheless, measured as a share of current income, moving to a consumption tax would likely be less progressive than the income tax system we have today. As such, when designing a consumption tax, policymakers will likely consider elements to offset that distributional effect. The most efficient way to increase the progressivity of a consumption tax while also maintaining a broad tax base and single tax rate would be to offer targeted relief to lower-and middle-income households.
Replacing the current income tax system with a consumption tax would create transitional effects for people currently holding capital by affecting asset values. On the one hand, repealing the income tax would increase the after-tax return to capital, increase demand for capital, and thus increase its value. On the other hand, imposing a consumption tax would reduce the value of existing capital. The net impact depends on various factors. It is likely the value of most existing capital falls at least somewhat, meaning shareholders face a one-time tax burden on their wealth (their existing saving) at the time of transition. The one-time tax on existing wealth would be progressive given that asset ownership is skewed toward the wealthy.
Moving to a consumption tax also requires deciding whether to apply the tax on an origin basis, as today’s income taxes are, or on a destination basis, as VATs are. Destination-based taxes mean only activity within a country’s borders faces the tax; that treatment is achieved by applying the tax to imports and exempting exports.[71] The decision of how to apply the tax at the border on an origin or destination basis results in equal treatment and has no effect on international competitiveness, but it can have transitional effects.[72]
Other considerations involve how to treat fringe benefits. The current income tax allows employers to deduct what they spend on health insurance and other fringe benefits and does not tax such items as income for individuals. Under a flat tax, employers would still deduct all forms of compensation, including fringe benefits, and households would pay taxes on all forms of compensation they receive.
Alternatively, fringe benefits could be taxed at the source, meaning firms would not deduct the cost of fringe benefits and households would not pay tax on fringe benefits, and could be subject to payroll taxes.
Offering some form of relief to mitigate transition effects is likely warranted, though it should be simple and well-targeted. Any revenues used for transition relief require a higher tax rate to reach revenue neutrality, thus reducing economic efficiency.[73]
Finally, questions of administration, particularly with respect to state sales tax systems and state conformity with the federal income tax code, would need to be addressed. Enticing states to conform to a federal consumption tax could lead to additional economic, administrative, and compliance cost reductions.
Modeling Consumption Tax Reforms for the United States
Economic, Revenue, and Distributional Effects of a Value-Added Tax and Rebate
The first consumption tax reform we model implements a value-added tax and rebate to replace the corporate income tax and child tax credit, earned income tax credit, and child and dependent care tax credit.[74]
The value-added tax base is broadly defined to include all consumption. It is defined as labor income (wages and salaries as well as other forms of labor compensation), capital income across all sectors (less investment, which is deductible under a VAT), and net imports (see Appendix Table 1 in Modeling Notes).[75] The broad VAT base is equal to about 72 percent of GDP based on 2021 levels.
Under the broad VAT base, we modeled a rate of 6.4 percent and rebate of $525 per filer and $2,100 per dependent starting in 2024 and adjusting for inflationInflation is when the general price of goods and services increases across the economy, reducing the purchasing power of a currency and the value of certain assets. The same paycheck covers less goods, services, and bills. It is sometimes referred to as a “hidden tax,” as it leaves taxpayers less well-off due to higher costs and “bracket creep,” while increasing the government’s spending power. annually thereafter. Overall, the option increases the long-run size of the economy by 0.3 percent and the capital stock by 1.9 percent. Wages would rise by 1.2 percent while hours worked would fall by 531,000 full-time equivalent jobs.
Replacing the corporate income tax with a value-added tax lowers the cost of capital, which leads to a larger capital stock and higher wages as productivity grows. While a value-added tax does not discourage business investment or household saving, it does still distort labor supply decisions. It creates a wedge between the amount of money a person earns from labor and how much consumption a person can afford after tax, which leads to a reduction in hours worked. That is why the reform reduces hours worked, even as it results in higher economic output, investment, and wages through its reduction in the cost of capital.
Eliminating individual tax credits that phase-in and phase-out with income leads to opposing effects on marginal income tax rates that, on net, reduce marginal tax rates overall and lead to a slightly positive economic effect. Replacing the credits with a flat, lump sum credit offsets some loss of benefit without distorting marginal income tax rates and significantly simplifies the credits. The lump sum credit is worth $525 per filer and $2,100 per dependent.
Families at different income levels would experience different changes in their net benefits under the proposed reforms. For example, under current law, a single parent with $5,000 in income and one child dependent would qualify for nearly $2,100 of tax credits. The same family would qualify for $2,625 under the proposed reform, without facing the complexities of the current tax credit system. Families with no incomes would newly qualify for full benefits under the reform, whereas currently they receive none.
The EITC currently reaches a maximum credit of $3,995 for families with one dependent or $7,430 for three or more dependents. Families higher on the EITC and CTC phase in ranges could see a decrease in their net benefits. For example, a family of joint filers earning $35,000 with two child dependents would qualify for about $7,000 to $9,000 of tax credits currently, which would fall to $5,250 under the proposed reform.[76]
Table 5. Economic Effects of a Replacement Value-Added Tax and Rebate
| Broad-Based VAT and Rebate | |
|---|---|
| GDP | 0.3% |
| Capital Stock | 1.9% |
| Wages | 1.2% |
| Employment | -531,000 |
Over the 10-year budget window, the option raises revenue by $569 billion on a conventional basis and by $24 billion on a dynamic basis after accounting for economic effects. The reform raises less revenue on a dynamic basis because initially the economic effect of the reform is negative: labor supply responds relatively fast to the introduction of a value-added tax, while investment responds relatively slow to the removal of the corporate income tax.
In the long run, the plan has a positive economic effect and is approximately revenue neutral on a conventional basis.
Table 6. Revenue Effects of a Replacement Value-Added Tax and Rebate (in billions)
| 2024 | 2025 | 2026 | 2027 | 2028 | 2029 | 2030 | 2031 | 2032 | 2033 | 2024-2033 | |
|---|---|---|---|---|---|---|---|---|---|---|---|
| Conventional | $222.2 | $207.0 | $31.8 | $7.2 | $21.3 | $18.7 | $19.9 | $16.4 | $14.1 | $10.3 | $568.8 |
| Dynamic | $139.3 | $129.5 | -$31.6 | -$51.8 | -$32.7 | -$30.7 | -$24.8 | -$25.9 | -$23.9 | -$23.5 | $24.1 |
In the long run, as measured on a conventional basis, after-tax income of all taxpayers increases slightly on average, as the plan is roughly revenue neutral. The bottom 20 percent of taxpayers would see an increase in after-tax income of 5.5 percent. On a dynamic basis, after-tax income increases by 0.3 percent on average, when factoring in the positive economic effects of the reform.
Table 7. Distributional Effects of a Replacement VAT and Rebate (Percent Change in After-Tax Income)
| Percentile | Income Threshold (2023 Dollars) | Conventional, Long-Run | Dynamic, Long-Run |
|---|---|---|---|
| 0% to 20% | $0 to $22,815 | 5.5% | 5.5% |
| 20% to 40% | $22,816 to $36,133 | 1.3% | 1.3% |
| 40% to 60% | $36,134 to $54,403 | 1.2% | 1.2% |
| 60% to 80% | $54,404 to $84,300 | -0.2% | -0.2% |
| 80% to 100% | $84,301 and up | -0.4% | -0.3% |
| 80% to 90% | $84,301 to $121,057 | -1.0% | -0.9% |
| 90% to 95% | $121,058 to $173,100 | -1.3% | -1.2% |
| 95% to 99% | $173,101 to $437,799 | -1.1% | -1.0% |
| 99% to 100% | $437,800 and up | 1.3% | 1.6% |
| Total | 0.2% | 0.3% |
Looking at families with children, we estimate that on a conventional basis, after-tax income increases by 4.0 percent for the bottom 20 percent of income earners and by 2.1 percent on average overall.
Table 8. Distributional Effects of a Replacement VAT and Rebate for Taxpayers with Child Dependents (Percent Change in After-Tax Income)
| Percentile | Income Threshold (2023 Dollars) | Conventional, Long-Run |
|---|---|---|
| 0% to 20% | $0 to $22,815 | 4.0% |
| 20% to 40% | $22,816 to $36,133 | 2.5% |
| 40% to 60% | $36,134 to $54,403 | 4.2% |
| 60% to 80% | $54,404 to $84,300 | 2.5% |
| 80% to 100% | $84,301 and up | 0.8% |
| Total | 2.1% |
Economic, Revenue, and Distributional Effects of a Tax on Business Profits and Household Compensation
The second option modifies the first by splitting the broad value-added tax into two components: a tax at the business level on cash flow profits and a progressive tax at the household level on compensation with a per person credit. The business profits and household compensation tax replace the current corporate and individual income taxes and the per person credit replaces the EITC, CTC, and CDCTC.
The base of the tax is equal to a broad-based VAT. For businesses, it would provide full and immediate expensing for all business investment, flip the treatment of interest so that it is not deductible and not taxable, remove foreign income from the tax base, remove general business tax credits, and be border adjusted. The resulting measure of profit would face a flat 30 percent tax.
Households would pay taxes on wages and salaries as well as supplements such as employer-provided health insurance and other fringe benefits but would not pay taxes on capital income such as capital gains, interest, or dividends. Compensation would be taxed progressively as described in Table 9 below, with rates ranging from 10 percent to 30 percent. All itemized deductions and the CTC, EITC, and CDCTC would be eliminated. A lump sum credit of $600 per filer and $2,400 per dependent would replace the eliminated credits.
Table 9. Comparing Current Law to the Household Compensation Tax
| Current Law | Reform Option | |
|---|---|---|
| Ordinary Income Tax Rates | Seven brackets in 2024: 10%, 12%, 22%, 24%, 32%, 35%, 37% with the top rate applying above $608,550 single and $730,250 joint in 2024. Seven brackets beginning in 2026: 10%, 15%, 25%, 28%, 33%, 35%, 39.6% with the top rate applying above $543,450 single and $611,400 joint. | Five brackets: 10%, 15%, 22%, 27%, 30% using current law income thresholds, with the top rate applying at $192,000 single and $384,000 joint in 2024. |
| Deductions and Exemptions | Filers may choose the standard deduction or itemize their deductions, whichever is larger. Personal and dependent exemptions set to $0 in 2024 and 2025, return in 2026. | Eliminates all itemized deductions, retains standard deduction and personal exemption as under current law. |
| Credits | Qualifying filers may claim the Earned Income Tax Credit, Child Tax Credit, and/or Child Dependent Care Credit. | Replaces the three credits with a lump sum credit set at $600 per filer and $2,400 per dependent in the household, adjusted for inflation thereafter. |
| Interest | Interest income is generally taxed with certain exemptions (municipal bond interest). Interest paid is tax deductible in some limited cases, such as mortgage interests. | Interest income is exempt from individual income taxation while interest paid is not deductible. |
| Capital Gains and Dividends | Taxed under the current individual income tax system and potentially face the net investment income tax. | Exempt from tax and repeals the net investment income tax. |
| Fringe Benefits, such as health insurance | Exempt from individual income taxation. | Subject to individual income taxation. |
Replacing the corporate and non-corporate income taxes with a cash flow tax that allows full expensing of all capital investment significantly reduces the cost of capital and thus incentivizes new domestic investment.
Restructuring the individual income tax to fall on only labor income, instead of labor income and the returns to saving and investment, boosts incentives to save and work, as does eliminating the net investment income tax (a surtaxA surtax is an additional tax levied on top of an already existing business or individual tax and can have a flat or progressive rate structure. Surtaxes are typically enacted to fund a specific program or initiative, whereas revenue from broader-based taxes, like the individual income tax, typically cover a multitude of programs and services. on certain investment income under current law). Broadening the base to eliminate itemized deductions and tax non-wage compensation such as health insurance and fringe benefits increases the tax burden on labor but reduces distortions in the current tax base and offsets the costs of the other reforms.
The combined effect of better structured tax bases is to boost incentives to work, save, and invest. Additionally, setting the top tax rate on household income at 30 percent to match the tax rate on business profits reduces incentives to recharacterize income at the margin, which reduces administrative and compliance costs too.
Eliminating individual tax credits that phase-in and phase-out with income leads to opposing effects on marginal income tax rates that, on net, reduce marginal tax rates overall and lead to a slightly positive economic effect. Replacing the credits with a flat, lump sum credit offsets some loss of benefit without distorting marginal income tax rates and simplifies rules leading to easier administration and compliance.
Using the same examples as above, a single parent with $5,000 in income and one child dependent would qualify for nearly $2,100 of tax credits under current law. The same family would qualify for $3,000 under the proposed reform. A family of joint filers earning $35,000 with two child dependents would qualify for about $7,000 to $9,000 of tax credits currently, which would fall to $6,000 under the proposed reform.
Overall, the business profits and household compensation tax would boost long-run GDP by 1.9 percent, expand the capital stock by 2.8 percent, lift wages by 1.2 percent, and increase hours worked by 886,000 full-time equivalent jobs.
Table 10. Economic Effects of a Business Profits and Household Compensation Tax
| GDP | 1.9% |
|---|---|
| Capital Stock | 2.8% |
| Wages | 1.2% |
| Employment | 886,000 |
Within the 10-year budget window, the reform would reduce federal revenue by slightly more than $1 trillion on a conventional basis. When factoring in the positive economic feedback from increased investment and work, federal revenue would decrease by about $130 billion.
In the long-run, the plan is roughly revenue neutral on a conventional basis.
Table 11. Revenue Effects of a Business Profits and Household Compensation Tax (in billions)
| 2024 | 2025 | 2026 | 2027 | 2028 | 2029 | 2030 | 2031 | 2032 | 2033 | 2024-2033 | |
|---|---|---|---|---|---|---|---|---|---|---|---|
| Conventional | $138.9 | $157.7 | -$100.3 | -$107.1 | -$115.3 | -$160.8 | -$179.2 | -$197.9 | -$224.4 | -$244.4 | -$1,032.8 |
| Dynamic | $139.0 | $165.4 | -$21.8 | -$17.5 | -$17.0 | -$53.6 | -$62.8 | -$72.4 | -$89.9 | -$99.1 | -$129.6 |
On a long-run conventional basis, taxpayers overall would see a slight change in after-tax income, as the reform is nearly revenue neutral. Taxpayers in the bottom quintile, however, would see a 5.8 percent increase in after-tax income, largely a function of replacing complex, refundable tax credits with simple, lump sum tax credits. The increase would be much smaller for the second quintile overall, while taxpayers from the 40th to 99th percentiles would, on average, see a reduction in after-tax income. Taxpayers in the top 1 percent would see an increase in after-tax income of 7.9 percent.
On a dynamic basis, after-tax income of taxpayers overall would rise by 1.8 percent due to increased economic growth and higher incomes. The bottom three quintiles would see higher after-tax income as a result of the positive economic impact of the reform. Taxpayers in the fourth quintile would still see a slight decrease in after-tax income, as would taxpayers in the 80th to 99th percentile.
Table 12. Distributional Effects of a Business Profits and Household Compensation Tax (Percent Change in After-Tax Income)
| Percentile | Income Threshold (2023 Dollars) | Conventional, Long-Run | Dynamic, Long-Run |
|---|---|---|---|
| 0% to 20% | $0 to $22,815 | 5.8% | 7.7% |
| 20% to 40% | $22,816 to $36,133 | 1.8% | 4.1% |
| 40% to 60% | $36,134 to $54,403 | -0.2% | 2.1% |
| 60% to 80% | $54,404 to $84,300 | -2.3% | -0.2% |
| 80% to 100% | $84,301 and up | -0.5% | 1.4% |
| 80% to 90% | $84,301 to $121,057 | -3.1% | -1.2% |
| 90% to 95% | $121,058 to $173,100 | -4.1% | -2.3% |
| 95% to 99% | $173,101 to $437,799 | -3.9% | -2.1% |
| 99% to 100% | $437,800 and up | 7.9% | 10.0% |
| Total | -0.2% | 1.8% |
For taxpayers with child dependents, after-tax income on a long-run conventional basis would increase by 4.2 percent for the bottom 20 percent of families with children. The simplified lump sum credits are especially impactful for taxpayers with children, increasing income by more than the overall average for the bottom 60 percent of taxpayers.
Table 13. Distributional Effects of a Business Profits and Household Compensation Tax for Taxpayers with Child Dependents (Percent Change in After-Tax Income)
| Percentile | Income Threshold (2023 Dollars) | Conventional, Long-Run |
|---|---|---|
| 0% to 20% | $0 to $22,815 | 4.2% |
| 20% to 40% | $22,816 to $36,133 | 3.5% |
| 40% to 60% | $36,134 to $54,403 | 2.7% |
| 60% to 80% | $54,404 to $84,300 | -0.5% |
| 80% to 100% | $84,301 and up | -0.2% |
| Total | 1.0% |
Conclusion
Improvements in the long-run standard of living largely depend on peoples’ willingness to work and to invest in capital. Tax policy has a significant effect on decisions to work and to invest by changing the after-tax benefits of both.
While increased economic growth and material living standards do not make up the entirety of human well-being, material prosperity is strongly correlated with better outcomes for people across a variety of alternate measures.
Reforming the current income tax system toward a consumption tax system would support rising living standards and economic growth. Combined with a simpler system of providing tax credits for individuals and children, such a reform could reduce the economic, administrative, and compliance costs imposed by the current tax system.
Appendix: Modeling Notes
We use the Tax Foundation General Equilibrium Tax Model to estimate the impact of tax policy changes in terms of economic, budgetary (tax revenue), and distributional effects. Economic impact measures include GDP, wages, employment, capital stock, investment, consumption, saving, and the trade deficit. Conventional tax revenue estimates hold the size of the economy constant but include certain behavioral effects of tax policy, such as profit shiftingProfit shifting is when multinational companies reduce their tax burden by moving the location of their profits from high-tax countries to low-tax jurisdictions and tax havens. . Dynamic revenue estimates consider both behavioral and macroeconomic effects of tax policy on revenue. Our revenue and distributional estimates do not include the impact of the proposed tax changes on non-filers.
Appendix Tables 1 and 2 illustrate the construction of the value-added tax base using data from the Bureau of Economic Analysis for calendar year 2021. The broad-based VAT illustrates the tax base in the Tax Foundation’s General Equilibrium model and includes an adjustment for housing so that owner-occupied homes are taxed on a pre-pay basis.
Simply multiplying the VAT rate by the proper economic accounts would overstate the potential revenue impact of a VAT because any tax will suffer from some tax avoidance. As such, we reduce the VAT base to account for potential tax avoidance. We assume that the VAT noncompliance rate would be 15 percent.
If lawmakers excluded certain categories of goods or services from the VAT base, it would require a higher tax rate to generate the same revenue as the option we simulated. Appendix Table 2 illustrates one such example of a narrow tax base.
Appendix Table 1. Constructing a Broad Value-Added Tax Base (Billions of Dollars, 2022)
| Compensation of Employees | $12,538 |
|---|---|
| Net Capital Income (Profits + Interest + Consumption of Fixed Capital + Excise Taxes - Investment) | $6,181 |
| Net Imports | $862 |
| Housing Adjustment to Prepay Tax on Owner-Occupied Housing (Household Investment Less Household Gross Capital Income) | -$347 |
| Non-Compliance (15% rate) | -$2,472 |
| Broad VAT Base (Before Exemptions) | $16,761 |
| Broad VAT Base (% of GDP) | 72% |
Source: BEA Tables 6.7, 1.1.5, 1.13, 7.5, and 2.4.5, Tax Foundation calculations
Appendix Table 2. Constructing a Narrow Value-Added Tax Base (Billions of Dollars, 2022)
| Broad VAT Base (Before Exemptions) | $16,761 |
|---|---|
| Exempt Housing (Household Investment Plus Rent of Tenant-Occupied Nonfarm Housing) | -$1,577 |
| Exempt Education | -$293 |
| Exempt Healthcare | -$2,584 |
| Exempt Food | -$908 |
| Total Exemptions | -$5,362 |
| Narrow VAT Base (After Exemptions) | $11,399 |
| Narrow VAT Base (% of GDP) | $0 |
Source: BEA Tables 6.7, 1.1.5, 1.13, 7.5, and 2.4.5, Tax Foundation calculations
Under the household compensation tax, to model the tax revenue and distributional effects associated with eliminating the exclusion for employer-sponsored health insurance (HI) and other fringe benefits, we used the tax expenditureTax expenditures are a departure from the “normal” tax code that lower the tax burden of individuals or businesses, through an exemption, deduction, credit, or preferential rate. Expenditures can result in significant revenue losses to the government and include provisions such as the earned income tax credit (EITC), child tax credit (CTC), deduction for employer health-care contributions, and tax-advantaged savings plans. estimates provided by the Treasury Department, the HI benefit amounts provided by the Bureau of Economic Analysis, and the distributional analysis provided by the Congressional Budget Office.
We then estimated the HI benefit as a share of wages and added it as an additional source of income in our modeling of the household compensation tax, also including it in our economic and distributional analysis. We assume that under the reform, firms shift compensation away from HI and other fringe benefits towards cash compensation, such that in the 10th year all compensation is in cash. The extent to which the shift to cash compensation occurs is uncertain, however, and if the shift is only partial, it would raise less revenue than what our analysis assumes.
Appendix Table 3. Stacked Economic Effects of a Business Profits and Household Compensation Tax
| GDP | Capital Stock | Wages | Full-time Equivalent Jobs | |
|---|---|---|---|---|
| Elim AMT | -0.1% | Less than +0.05% | Less than +0.05% | -112,000 |
| Consolidate to Five Brackets and Tax Only Labor Income | 1.4% | 1.8% | 0.3% | 1.2 million |
| Eliminate Itemized Deductions | -0.2% | -0.2% | Less than +0.05% | -201,000 |
| Eliminate CTC, EITC, CDCC | 0.3% | 0.4% | Less than +0.05% | 343,000 |
| Full Expensing, Flip the Treatment of Interest, Eliminate the Book Minimum Tax, Eliminate General Business Credits, Apply 30% Rate to Business Profits | 1.0% | 1.3% | 0.8% | 202,000 |
| Eliminate NIIT | Less than +0.05% | 0.1% | Less than +0.05% | 6,000 |
| Tax Health Insurance | -0.4% | -0.5% | 0.00% | -474,000 |
| Tax Other Fringes | Less than -0.05% | Less than -0.05% | Less than -0.05% | -40,000 |
| Lump Sum Credit | 0% | 0% | 0% | 0 |
| Total | 1.9% | 2.6% | 1.1% | 886,000 |
Source: Tax Foundation General Equilibrium Model, September 2023.
[1] Charles W. Cobb and Paul H. Douglas, “A Theory of Production,” The American Economic Review 18, no. 1, (March 1928): 139-165, https://www.aeaweb.org/aer/top20/18.1.139-165.pdf.
[2] Congressional Budget Office, “How Labor Supply Responds to Changes in Fiscal Policy,” October 2012, https://www.cbo.gov/sites/default/files/cbofiles/attachments/10-25-2012-Labor_Supply_and_Fiscal_Policy.pdf.
[3] Giorgia Maffini, Jing Xing, and Michael P Devereux, “The impact of investment incentives: evidence from UK corporation tax returns,” Working Papers 1601, Oxford University Centre for Business Taxation, 2016, https://ideas.repec.org/p/btx/wpaper/1601.html.
[4] Organization for Economic Cooperation and Development, “Measuring Well-bring and Progress: Well-being Research,” https://www.oecd.org/wise/measuring-well-being-and-progress.htm.
[5] Robert Wood Johnson Foundation, “Well-Being: Expanding the Definition of Progress,” May 2020, https://www.rwjf.org/en/insights/our-research/2020/05/well-being–expanding-the-definition-of-progress.html.
[6] J.F. Helliwell et al., “Self-reported life satisfaction vs. GDP per capita, 2022,” Our World in Data, Mar. 3, 2023, https://ourworldindata.org/grapher/gdp-vs-happiness.
[7] R. Fouquest, “Air pollution vs. GDP per capita, 1700 to 2015,” Our World in Data, Feb. 15, 2016 https://ourworldindata.org/grapher/air-pollution-vs-gdp-per-capita; “There is a very strong positive relationship [between trust and GDP per capita]. Most academic studies find that this relationship remains after controlling for further characteristics. And similar results can also be obtained by looking at other measures of economic outcomes.” For more, see Esteban Ortiz-Ospina and Max Roser, “Trust,” Our World in Data, 2016, https://ourworldindata.org/trust.
[8] Max Roser, Estaban Ortiz-Ospina, and Hannah Ritchie, “Life expectancy and GDP,” Our World in Data, October 2019, https://ourworldindata.org/life-expectancy#life-expectancy-and-gdp. See also Max Roser, Hannah Ritchie and Bernadeta Dadonaite, “Child and Infant Mortality,” Our World in Data, November 2019, https://ourworldindata.org/child-mortality#child-mortality-and-income-level.
[9] Karen Dynam and Louise Sheiner, “GDP as a Measure of Economic Well-being,” Brookings Institution Hutchins Center on FIscal & Monetary Policy, August 2018, https://www.brookings.edu/wp-content/uploads/2018/08/WP43-8.23.18.pdf.
[10] See, for example, Randall K.Q. Akee et al., “Parents’ Income and Children’s Outcomes: A Quasi-Experiment,” American Economic Journal: Applied Economics, 2, no. 1 (Jan. 2010), https://www.aeaweb.org/articles?id=10.1257/app.2.1.86, and Kerris Cooper and Kitty Stewart, “Does Household Income Affect Children’s Outcomes? A Systematic Review of the Evidence,” Child Indicators Research, November 4, 2020, https://link.springer.com/article/10.1007/s12187-020-09782-0.
[11] Anthony Atkinson and Joseph Stiglitz, “The design of tax structure: Direct versus indirect taxation,” Journal of Public Economics 6 (1976): 55-75; Louis Kaplow, “On the undesirability of commodity taxation even when income taxation is not optimal,” Journal of Public Economics 90 (2006): 1235-1250; Joseph Bankman and David Weisbach, “The Superiority of an Ideal Consumption Tax over an Ideal Income Tax,” Stanford Law Review 58 (2005): 1413-1456.
[12] Janelle Fritts, “State and Local Sales Tax Rates, 2023,” Tax Foundation, Feb. 7, 2023, https://taxfoundation.org/data/all/state/2023-sales-taxes/.
[13] Daniel Bunn and Cecilia Perez Weigel, “Sources of Government Revenue in the OECD, 2023,” Tax Foundation, Feb. 23, 2023, https://taxfoundation.org/data/all/global/oecd-tax-revenue-by-country-2023/.
[14] See Robert Carroll and Alan Viard, Progressive Consumption Taxation: The X Tax Revisited, 1st ed. (Washington, D.C.: The AEI Press, 2012), 68-81 for more discussion on why the top household compensation tax rate should match the business cash-flow rate to prevent income mischaracterization at the margin.
[15] Ibid 6-11.
[16] David Altig, et al., “Simulating Fundamental Tax Reform in the U.S.” The American Economic Review, (June 2001), https://eml.berkeley.edu/~auerbach/ftp/taxreform/flatfinal.pdf.
[17] Ibid.
[18] Office of Tax Policy U.S. Department of the Treasury, “Approaches to Improve the Competitiveness of the U.S. Business Tax System for the 21st Century,” Dec. 20, 2007, https://home.treasury.gov/system/files/131/Report-Improve-Competitiveness-2007.pdf.
[19] A consumption tax still falls on returns to capital arising from risk taking, entrepreneurial or market power, and luck. Such returns typically accrue to higher income and higher wealth households, meaning a share of their returns to capital still face tax. As such, the idea that “consumption tax reform is a sop to the rich is almost certainly unfair, especially if a progressive consumption tax,” is considered. See R. Glenn Hubbard, “Would a Consumption Tax Favor the Rich?” in Kevin A. Hassett and Alan J. Auerbach, Toward Fundamental Tax Reform, https://www.aei.org/wp-content/uploads/2013/12/-toward-fundamental-tax-reform-chapter-5_130947205941.pdf.
[20] Carlos E. da Costa and Marcelo R. Santos, “Progressive Consumption Taxes,” Jan. 12, 2021, https://papers.ssrn.com/sol3/papers.cfm?abstract_id=3803684.
[21] Oguzhan Akgun, Boris Cournède, and Jean-Marc Fournier, “The effects of the tax mix on inequality and growth,” OECD Economics Department Working Papers, No. 1447, Dec. 15, 2017, https://doi.org/10.1787/c57eaa14-en.
[22] Pierce O’Reilly, “Tax policies for inclusive growth in a changing world”, OECD Taxation Working Papers, No. 40, Dec. 18, 2018, https://doi.org/10.1787/1fdafe21-en.
[23] Anh Ngyuen, Luisanna Onis, and Raffaele Rossi, “The Macroeconomic Effects of Income and Consumption Tax Changes,” American Economic Journal, Vol. 13, No.2 (May 2021): 439-66, https://www.aeaweb.org/articles?id=10.1257/pol.20170241; Countries may have economic, social, and cultural differences that limit applicability to the U.S. External validation may always be tentative and it is important to use carefully designed empirical research when making cross-country comparisons.
[24] Scott Hodge, “Empirical Evidence Shows That Expensing Leads to More Investment and Higher Employment,” Tax Foundation, May 19, 2020, https://taxfoundation.org/expensing-leads-to-more-investment-and-higher-employment/.
[25] Daniel Bunn and Cecilia Perez Weigel, “Sources of Government Revenue in the OECD, 2023,” Tax Foundation, Feb. 23, 2023, https://taxfoundation.org/oecd-tax-revenue-by-country-2023/. .
[26] O’Reilly, “Tax policies for inclusive growth in a changing world”; Garrett Watson and Daniel Bunn, “Learning from Europe and America’s Shared Gross Receipts TaxGross receipts taxes are applied to a company’s gross sales, without deductions for a firm’s business expenses, like compensation, costs of goods sold, and overhead costs. Unlike a sales tax, a gross receipts tax is assessed on businesses and applies to transactions at every stage of the production process, leading to tax pyramiding. Experience,” Feb. 12, 2019, Tax Foundation, https://taxfoundation.org/blog/europe-america-gross-receipts-taxes/.
[27] Janelle Fritts and Jared Walczak, “2022 State Business Tax Climate Index,” Tax Foundation, Dec. 16, 2021, https://taxfoundation.org/research/all/state/2022-state-business-tax-climate-index/.
[28] Daniel Bunn, Cristina Enache, and Ulrik Boesen, “Consumption Tax Policies in OECD Countries,” Tax Foundation, Jan. 26, 2021, https://taxfoundation.org/data/all/global/consumption-tax-policies/: Daniel Bunn and Lisa Hogreve, International Tax Competitiveness Index 2022, Tax Foundation, Oct. 17, 2022, https://taxfoundation.org/research/all/global/2022-international-tax-competitiveness-index/.
[29] Rita de la Feria and Michael Walpole, “The Impact of Public Perceptions on General Consumption Taxes,” British Tax Review 67, no. 5 (Dec. 4, 2020), 637-669, https://papers.ssrn.com/sol3/papers.cfm?abstract_id=3723750.
[30] Cristina Enache, “VAT Expansion and Labor Tax Cuts,” Tax Foundation, Jan. 10, 2023, https://taxfoundation.org/vat-tax-expansion-and-labor-tax-cuts/.
[31] Richard M. Bird, “The GST/HST: Creating an Integrated Sales Tax in a Federal Country,” The School of Public Policy Publications (SPPP); Calgary Vol. 5, (2012), https://www.proquest.com/docview/2204835860.
[32] PwC Worldwide Tax Summaries, “Canada Corporate – Other taxes,” June 15, 2023, https://taxsummaries.pwc.com/canada/corporate/other-taxes.
[33] Michael Smart and Richard Miller Bird, “The Impact on Investment of Replacing a Retail Sales Tax by a Value-Added Tax: Evidence from Canadian Experience,” Institute for International Business, No. 15, (June 2008), https://ssrn.com/abstract=1273773.
[34] Ibid.
[35] Australia Treasury, “Preliminary assessment of the impact of The New Tax System,” April 3, 2003, https://treasury.gov.au/publication/economic-roundup-autumn-2003/preliminary-assessment-of-the-impact-of-the-new-tax-system.
[36] Abbas Valadkhani and A. P. Layton, “Quantifying the Effect of GST on Inflation in Australia’s Capital Cities: An Intervention Analysis,” Australian Economic Review, 37, no. 2, (March 2004), https://ro.uow.edu.au/cgi/viewcontent.cgi?article=1410&context=commpapers.
[37] Australia Treasury, “Preliminary assessment of the impact of The New Tax System.”
[38] Daniel J. Mitchell, “Flat Tax is the Way of the Future.” Heritage Foundation, March 2006, https://www.heritage.org/taxes/commentary/flat-tax-the-way-the-future.
[39] William McBride, Garrett Watson, and Erica York. “Taxing Distributed Profits Make Taxation Simple and Efficient,” Tax Foundation, Mar. 1, 2023, https://taxfoundation.org/distributed-profits-tax-us-businesses/.
[40] Amir El-Sibaie, “Latvia Joins the Cash Flow Tax Club,” Tax Foundation, Apr. 16, 2018. https://taxfoundation.org/latvia-cash-flow-tax/.
[41] Scott Hodge. “Flat Tax Lessons from Slovakia,” Tax Foundation, Oct. 26, 2011, https://taxfoundation.org/flat-tax-lessons-slovakia.
[42] Michal Horvath et al., “The End of the Flat Tax Experiment in Slovakia…” Economic Modeling, Vol. 80, (August 2019): 171-184, https://www.sciencedirect.com/science/article/abs/pii/S0264999317316425.
[43] European Central Bank, “Convergence and Adjustment in the Baltic States,” 2017, https://www.ecb.europa.eu/pub/pdf/other/ebbox201705_01.en.pdf.
[44] Tomasz Daborowski. “Slovakia’s Economic Success and the Global Crisis,” Centre for Eastern Studies, 2009, https://www.files.ethz.ch/isn/96500/commentary_19.pdf.
[45]Jaan Masso, Jaanika Merikull, and Pritt Vahter, “Gross Profit Taxation Versus Distributed Profit Taxation and Firm Performance: Effects of Estonia’s Corporate Tax Reform,” The University of Tartu Faculty of Economics and Business Administration, Working Paper No. 81, March 23, 2011, https://ssrn.com/abstract=1793143.
[46] Jaan Masso and Jaanika Merikull, “Macroeconomic Effects of Zero Corporate Income Tax on Retained Earnings,” Baltic Journal of Economics 11, no. 2 (2011): 81-99, https://www.tandfonline.com/doi/pdf/10.1080/1406099X.2011.10840502.
[47] See discussion in Report of the President’s Advisory Panel on Federal Tax Reform, Nov. 1, 2005, https://govinfo.library.unt.edu/taxreformpanel/final-report/index.html.
[48] Kyle Pomerleau, “The Tax Burden on Business Investments Under Joe Biden’s Proposals,” American Enterprise Institute, September 2020, https://www.aei.org/wp-content/uploads/2020/09/The-tax-burden-on-business-investment-under-Joe-Bidens-tax-proposals.pdf?x91208.
[49] Stephen J. Entin, “Labor Bears Much of the Cost of the Corporate Tax,” Tax Foundation, Oct. 24, 2017,
https://www.taxfoundation.org/labor-bears-corporate-tax/; Alex Durante, “Who Bears the Burden of Corporate Taxation? A Review of Recent Evidence,” June 10, 2021, https://taxfoundation.org/blog/who-bears-burden-corporate-tax/; William McBride, “Testimony: Joint Economic Committee Hearing on the Revenue Provisions of the Build Back Better Act,” Oct. 6, 2021, https://taxfoundation.org/blog/build-back-better-revenue-joint-economic-committee-tax/.
[50] Clemens Fuest, Andreas Peichl, and Sebastian Siegloch, “Do Higher Corporate Taxes Reduce Wages? Micro Evidence from Germany,” American Economic Review 108, no. 2 (February 2018): 393–418, https://www.doi.org/10.1257/aer.20130570.
[51] Scott Hodge, “The Tax Compliance Costs of IRS Regulations,” Tax Foundation, Aug. 23, 2022, https://taxfoundation.org/tax-compliance-costs-irs-regulations/.
[52] Garrett Watson and Nicole Kaeding, “Tax Policy and Entrepreneurship: A Framework for Analysis,” Tax Foundation, April 3, 2019, https://taxfoundation.org/tax-policy-entrepreneurship/.
[53] Congressional Budget Office, “Revenue Projections, by Category,” February 2023, https://www.cbo.gov/system/files/2023-02/51138-2023-02-Revenue.xlsx.
[54] Margot L. Crandall-Hollick, Jameson A. Carter, and Gene Falk, “The Impact of the Federal Income Tax Code on Poverty,” Congressional Research Service, Oct. 19, 2020, https://crsreports.congress.gov/product/pdf/R/R45971.
[55] United States Census Bureau, “The Supplemental Poverty Measure: 2020: Table 7,” https://www.census.gov/library/publications/2021/demo/p60-275.html.
[56] Joint Economic Committee, “The Expanded Child Tax Credit Dramatically Reduced Child Poverty in 2021,” Nov. 30, 2022, https://www.jec.senate.gov/public/index.cfm/democrats/issue-briefs?id=CD9DF1DD-39AF-4F31-9401-B2687B593E59.
[57] National Academy of Sciences, “A Roadmap to Reducing Childhood Poverty,” Feb. 28, 2019, https://www.ncbi.nlm.nih.gov/books/NBK547371/.
[58] Ibid.
[59] Amir El-Sibaie, “Illustrating the Earned Income Tax Credit’s Complexity,” Tax Foundation, July 14, 2016, https://www.taxfoundation.org/illustrating-earned-income-tax-credit-s-complexity/.
[60] Scott Hodge, “Why Congress Is More to Blame than IRS for $26 Billion in Refundable Tax Credit Overpayments,” Tax Foundation, Jun. 6, 2023, https://taxfoundation.org/blog/irs-tax-credits-overpayments/.
[61] Congressional Research Service, “The Earned Income Tax Credit (EITC): Administrative and Compliance Challenges,” Apr. 23, 2018, https://crsreports.congress.gov/product/pdf/R/R43873.
[62] Congressional Research Service, “Child Tax Benefits and Children with Complex or Dynamic Living Arrangements,” Mar. 12, 2021, https://crsreports.congress.gov/product/pdf/IN/IN11634.
[63] Scott Hodge, “Why Congress Is More to Blame than IRS for $26 Billion in Refundable Tax Credit Overpayments.”
[64] National Taxpayer Advocate, “2022 Purple Book,” Dec. 31, 2021, https://www.taxpayeradvocate.irs.gov/wp-content/uploads/2022/01/ARC21_PurpleBook_08_MiscRecs_56.pdf.
[65] Congressional Research Service, “Audits of EITC Returns: By the Numbers,” June 13, 2022, https://crsreports.congress.gov/product/pdf/IN/IN11952/1.
[66] Taxpayer Advocate Service, “CORRESPONDENCE EXAMINATION: The IRS’s Correspondence Examination Procedures Burden Taxpayers and Are Not Effective in Educating the Taxpayer and Promoting Future Voluntary Compliance,” https://www.taxpayeradvocate.irs.gov/wp-content/uploads/2020/07/ARC18_Volume1_MSP_08_CorrespondenceExamination.pdf.
[67] Marianne Bitler, Hilary Hoynes, and Elira Kuka, “Child Poverty, the Great RecessionA recession is a significant and sustained decline in the economy. Typically, a recession lasts longer than six months, but recovery from a recession can take a few years. , and the Social Safety Net in the United States,” NBER Working Paper No. w2268, September 2016, https://gspp.berkeley.edu/assets/uploads/research/pdf/Bitler-Hoynes-Kuka_final_nospacing_nofootnotes_final.pdf.
[68] Elaine Maag, Nikhita Airi, and Lillian Hunter, “Understanding Yearly Changes in Family Structure and Income and Their Impact on Tax Credits,” Tax Policy Center, Feb. 3, 2023, https://www.taxpolicycenter.org/publications/understanding-yearly-changes-family-structure-and-income-and-their-impact-tax-credits/full.
[69] Paul Weinstens Jr and Bethany Patten, “The Price of Paying Taxes II: How paid tax preparer fees are diminishing the Earned Income Tax Credit (EITC),” progressive policy institute, April 2016, https://www.progressivepolicy.org/wp-content/uploads/2016/04/2016.04-Weinstein_Patten_The-Price-of-Paying-Takes-II.pdf.
[70] Cristina Enache, “Contrary to Popular Belief, Value-Added Taxes Found to Be Slightly Progressive,” Tax Foundation, Aug. 13, 2020, https://taxfoundation.org/value-added-tax-vat-progressive/.
[71] A destination-based tax is like a traditional Individual Retirement Account (IRA), as the tax exempts U.S. production sent abroad but taxes returns to activity abroad in the form of imports. Similarly, traditional IRAs exempt contributions but tax the returns to contributions when withdrawn. An origin-based consumption tax is the reverse, as it offers no export exemption and levies no import tax. An origin-based tax is like a Roth IRA, as it applies tax immediately at the source of production in the U.S. but does not tax returns from investment abroad in the form of imports. Likewise, Roth IRAs tax contributions immediately but do not tax returns to those contributions when withdrawn.
[72] Robert Carroll and Alan Viard, Progressive Consumption Taxation: The X Tax Revisited, 118-134.
[73] Ibid.
[74] Retaining the current structure of individual income taxes on pass-through businesses would lead to a short-term distortion that would fade in the long run as businesses would be incentivized to take on corporate form. We do not incorporate that effect in our modeling.
[75] The broad base includes a housing adjustment to tax owner-occupied housing consumption on a pre-pay basis. See discussion in Satya Poddar, “Taxation of housing under a VAT,” Tax Law Review, Aug. 31, 2010, https://papers.ssrn.com/sol3/papers.cfm?abstract_id=1669559.
[76] Lawmakers could consider a number of options to increase benefits to families with children, including larger tax credit maximums, changes to existing spending programs, or developing new spending programs.
Share this article