State Individual Income Tax Rates and Brackets, 2026
Individual income taxes are a major source of state government revenue, accounting for more than a third of state tax collections. How do income taxes compare in your state?
9 min readProviding journalists, taxpayers and policymakers with basic data on taxes and spending is a cornerstone of the Tax Foundation’s educational mission. We’ve found that one of the best, most engaging ways to do that is by visualizing tax data in the form of maps.
How does your state collect revenue? Every week, we release a new tax map that illustrates one important measure of state tax rates, collections, burdens and more. If you enjoy our weekly tax maps, help us continue this work and more by making a small contribution here.

Individual income taxes are a major source of state government revenue, accounting for more than a third of state tax collections. How do income taxes compare in your state?
9 min read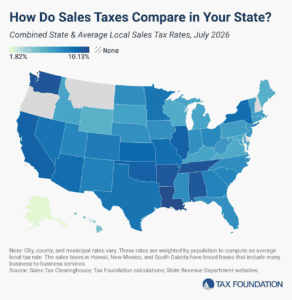
The five states with the highest average combined state and local sales tax rates are Louisiana (10.13 percent), Tennessee (9.61 percent), Washington (9.57 percent), Arkansas (9.48 percent), and Alabama (9.46 percent).
8 min read
Forty-four states levy a corporate income tax, with top rates ranging from a 2 percent flat rate in North Carolina to an 11.5 percent top marginal rate in New Jersey. Four states—Georgia, Nebraska, North Carolina, and Pennsylvania—reduced their corporate income tax rates effective January 1, 2026.
5 min read
Property taxes are the primary tool for financing local governments. While no taxpayers in high-tax jurisdictions will be celebrating their yearly payments, property taxes are largely rooted in the benefit principle of taxation: the people paying the property tax bills are most often the ones benefiting from the services.
9 min read
Millions of Americans, along with significant amounts of income and economic activity, are moving from high-tax states to those with more competitive tax systems and lower overall costs of living.
8 min read
The amount of revenue states raise through roadway-related revenues varies significantly across the US. Only two states raise enough revenue to fully cover their highway spending.
5 min read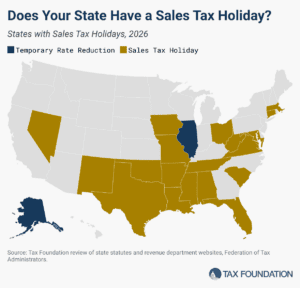
However well-intended they may be, sales tax holidays remain the same as they always have been—ineffective and inefficient.
12 min read
The five states with the highest average combined state and local sales tax rates are Louisiana (10.13 percent), Tennessee (9.61 percent), Washington (9.57 percent), Arkansas (9.48 percent), and Alabama (9.46 percent).
8 min read
Whether a sommelier or a casual enjoyer, wine drinkers may not be aware of just how much they are paying in taxes to uncork their drink of choice.
6 min read
In the United States, taxes are the single most expensive ingredient in beer. The tax burden accounts for more of the final price of beer than labor and materials combined—the many different layers of applicable taxes combining to total as much as 40.8 percent of the retail price.
7 min read
The significant disparity in tax rates across states underscores the complex tax and regulatory environment governing distilled spirits.
9 min read
Tax collections vary widely by state, making per capita collections figures—a measure of collections per person—especially useful, as they allow comparisons across differences in tax rates and bases, economic capacities, and policy decisions that impact the size and scope of government.
5 min read
Millions of Americans, along with significant amounts of income and economic activity, are moving from high-tax states to those with more competitive tax systems and lower overall costs of living.
8 min read
Nearly half of US states regulate and tax recreational markets, and only 10 states still lack a comprehensive medical marijuana program.
8 min read
Facts & Figures serves as a one-stop state tax data resource that compares all 50 states on over 40 measures of tax rates, collections, burdens, and more.
2 min read
The amount of revenue states raise through roadway-related revenues varies significantly across the US. Only two states raise enough revenue to fully cover their highway spending.
5 min read
Property taxes are the primary tool for financing local governments. While no taxpayers in high-tax jurisdictions will be celebrating their yearly payments, property taxes are largely rooted in the benefit principle of taxation: the people paying the property tax bills are most often the ones benefiting from the services.
9 min read
The vaping industry has grown rapidly in recent decades, becoming a well-established product category and a viable alternative to cigarettes for those trying to quit smoking. US states levy a variety of tax structures on vaping products.
8 min read
Individual income taxes are a major source of state government revenue, accounting for more than a third of state tax collections. How do income taxes compare in your state?
9 min read
One area of the tax code in which extreme complexity and low compliance go hand-in-hand—and where reform is desperately needed—is in states’ nonresident individual income tax filing and withholding laws.
9 min read
Retail sales taxes are an essential part of most states’ revenue toolkits, responsible for nearly a quarter of combined state and local tax collections.
18 min read
Forty-four states levy a corporate income tax, with top rates ranging from a 2 percent flat rate in North Carolina to an 11.5 percent top marginal rate in New Jersey. Four states—Georgia, Nebraska, North Carolina, and Pennsylvania—reduced their corporate income tax rates effective January 1, 2026.
5 min read
Many policies, such as minimum wage levels, tax brackets, and means-tested public benefit income thresholds, are denominated in nominal dollars, even though a dollar in one region may go much further than a dollar in another. Lawmakers should keep that reality in mind as they make changes to tax and economic policies.
6 min read
Americans may be surprised to see just how much they are taxed for renting a car.
5 min read
Cigarette tax avoidance costs states billions in forgone tax revenue and necessitates additional spending on enforcement of the ineffective policies.
6 min read
Tobacco is the most highly taxed consumer product in the United States. The tools on this page allow you to explore state tax rates and the effects tax policy and tobacco regulations can have on state revenues, smuggling, and effective tax rates for different income groups.
2 min read