State Individual Income Tax Rates and Brackets, 2026
Individual income taxes are a major source of state government revenue, accounting for more than a third of state tax collections. How do income taxes compare in your state?
9 min readProviding journalists, taxpayers and policymakers with basic data on taxes and spending is a cornerstone of the Tax Foundation’s educational mission. We’ve found that one of the best, most engaging ways to do that is by visualizing tax data in the form of maps.
How does your state collect revenue? Every week, we release a new tax map that illustrates one important measure of state tax rates, collections, burdens and more. If you enjoy our weekly tax maps, help us continue this work and more by making a small contribution here.

Individual income taxes are a major source of state government revenue, accounting for more than a third of state tax collections. How do income taxes compare in your state?
9 min read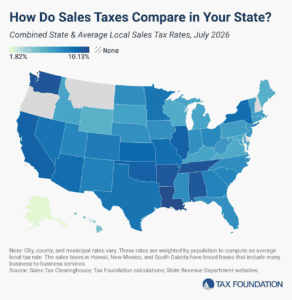
The five states with the highest average combined state and local sales tax rates are Louisiana (10.13 percent), Tennessee (9.61 percent), Washington (9.57 percent), Arkansas (9.48 percent), and Alabama (9.46 percent).
8 min read
Forty-four states levy a corporate income tax, with top rates ranging from a 2 percent flat rate in North Carolina to an 11.5 percent top marginal rate in New Jersey. Four states—Georgia, Nebraska, North Carolina, and Pennsylvania—reduced their corporate income tax rates effective January 1, 2026.
5 min read
Property taxes are the primary tool for financing local governments. While no taxpayers in high-tax jurisdictions will be celebrating their yearly payments, property taxes are largely rooted in the benefit principle of taxation: the people paying the property tax bills are most often the ones benefiting from the services.
9 min read
Millions of Americans, along with significant amounts of income and economic activity, are moving from high-tax states to those with more competitive tax systems and lower overall costs of living.
8 min read
The amount of revenue states raise through roadway-related revenues varies significantly across the US. Only two states raise enough revenue to fully cover their highway spending.
5 min read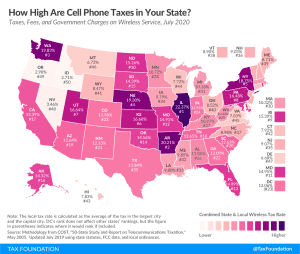
A typical American household with four phones on a “family share” wireless plan can expect to pay about $270 per year (or 22 percent of their cell phone bill) in taxes, fees, and surcharges.
36 min read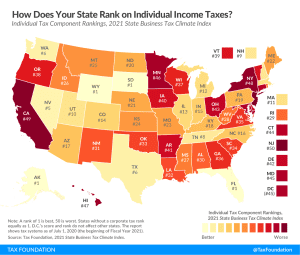
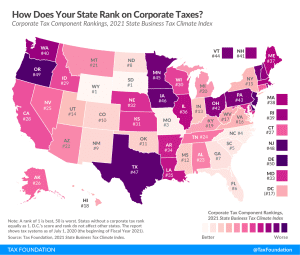
The corporate tax component of our Index measures each state’s principal tax on business activities. Most states levy a corporate income tax on a company’s profits (receipts minus most business expenses, including compensation and the cost of goods sold), while some states levy gross receipts taxes, which allow few or no deductions for a company’s expenses.
2 min read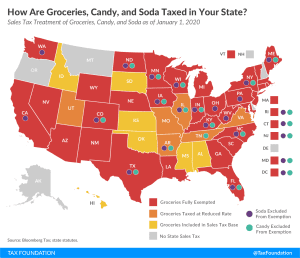
Even in 2020, jack-o’-lanterns and fake skeletons have popped up in neighborhoods as they do every October, although Halloween may look and play out differently this time around.
4 min read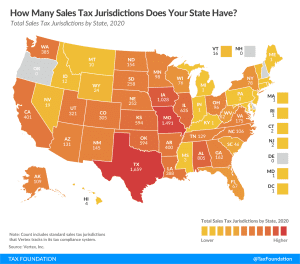
Following the Wayfair decision, states’ move to tax online sales has increased the importance of simplicity in sales tax systems, as sellers now have to deal with differing regulations in multiple states. There are over 11,000 standard sales tax jurisdictions in the United States in 2020
2 min read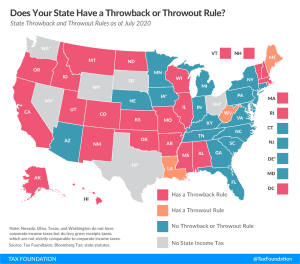
State throwback and throwout rules may not be widely understood, but they have a notable impact on business location and investment decisions and reduce economic efficiency for the states which impose such rules.
3 min read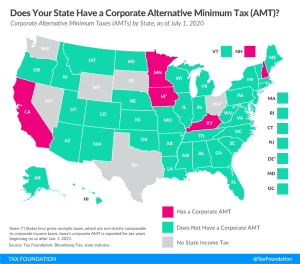
Five states currently collect corporate AMTs: California, Iowa, Kentucky, Minnesota, and New Hampshire. This is a significant drop from the eight states that levied AMTs in tax year 2017.
2 min read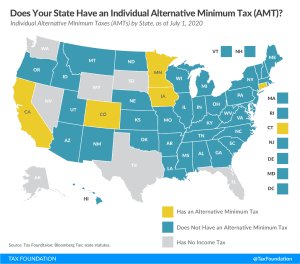
Under an individual AMT, many taxpayers are required to calculate their income tax liability under two different systems and pay the higher amount.
2 min read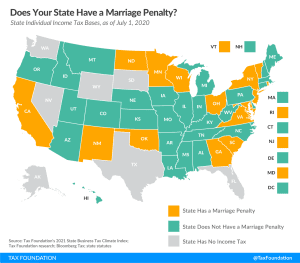
A marriage penalty exists when a state’s income brackets for married taxpayers filing jointly are less than double the bracket widths that apply to single filers.
2 min read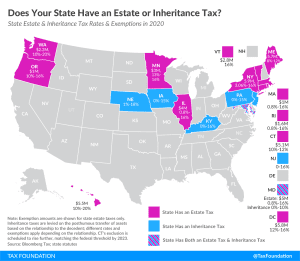
In addition to the federal estate tax, with a top rate of 40 percent, some states levy an additional estate or inheritance tax.
3 min read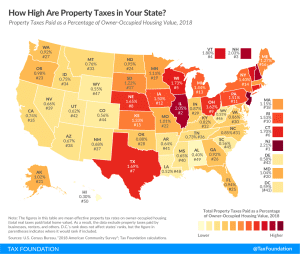
New Jersey has the highest effective rate on owner-occupied property at 2.21 percent, followed closely by Illinois (2.05 percent) and New Hampshire (2.03 percent).
2 min read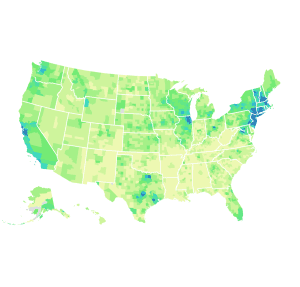
The five counties with the highest median property tax payments are all located near New York City and have bills exceeding $10,000.
3 min read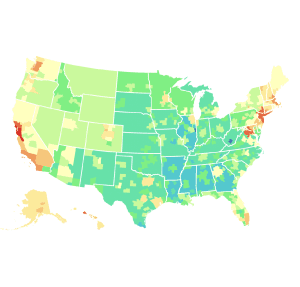
California is home to 7 of the 10 most expensive metro areas in America. See what’s the real value of $100 in your metro area with our new purchasing power map.
4 min read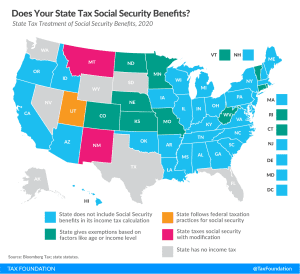
The question, “Does my state tax Social Security benefits?” may be simple enough, but the answer includes a lot of nuance. Many states have unique and specific provisions regarding the taxation of Social Security benefits, which can be broken into a few broad categories.
3 min read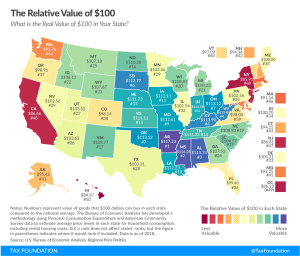

California pumps out the highest tax rate of 62.47 cents per gallon, followed by Pennsylvania (58.7 cpg), Illinois (52.01 cpg), and Washington (49.4 cpg).
2 min read
In the midst of the coronavirus crisis, some states are hoping that a sales tax holiday might help restart struggling industries by stimulating the economy. However, sales tax holidays can mislead consumers about savings and distract from genuine, permanent tax relief.
41 min read

Sales tax rates differ by state, but sales tax bases also impact how much revenue is collected from a tax and how the tax affects the economy.
12 min read