State Individual Income Tax Rates and Brackets, 2025
Individual income taxes are a major source of state government revenue, accounting for more than a third of state tax collections. How do income taxes compare in your state?
12 min readProviding journalists, taxpayers and policymakers with basic data on taxes and spending is a cornerstone of the Tax Foundation’s educational mission. We’ve found that one of the best, most engaging ways to do that is by visualizing tax data in the form of maps.
How does your state collect revenue? Every week, we release a new tax map that illustrates one important measure of state tax rates, collections, burdens and more. If you enjoy our weekly tax maps, help us continue this work and more by making a small contribution here.
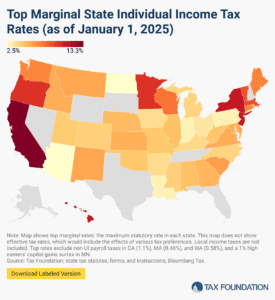
Individual income taxes are a major source of state government revenue, accounting for more than a third of state tax collections. How do income taxes compare in your state?
12 min read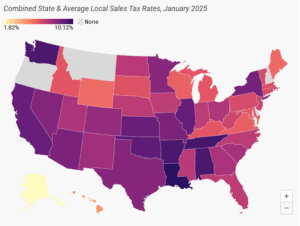
Retail sales taxes are an essential part of most states’ revenue toolkits, responsible for 24 percent of combined state and local tax collections.
15 min read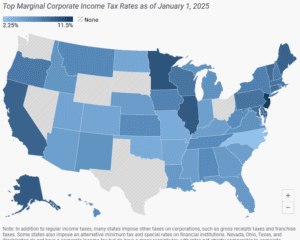
Forty-four states levy a corporate income tax, with top rates ranging from a 2.25 percent flat rate in North Carolina to a 11.5 percent top marginal rate in New Jersey.
7 min read
Property taxes are the primary tool for financing local governments. While no taxpayers in high-tax jurisdictions will be celebrating their yearly payments, property taxes are largely rooted in the benefit principle of taxation: the people paying the property tax bills are most often the ones benefiting from the services.
9 min read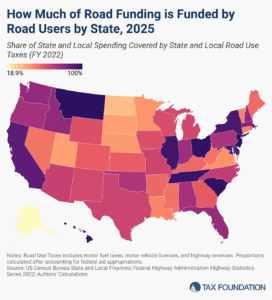
The amount of revenue states raise through roadway-related revenues varies significantly across the US. Only three states raise enough revenue to fully cover their highway spending.
5 min read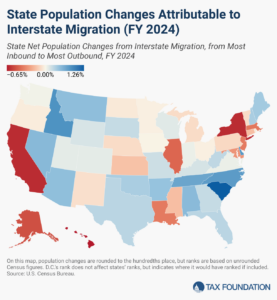
Americans were on the move in 2024, and many chose low-tax states over high-tax ones.
6 min read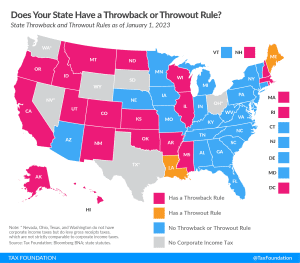
While throwback and throwout rules in states’ corporate tax codes may not be widely understood, they have a notable impact on business location and investment decisions and reduce economic efficiency.
4 min read
Facts & Figures serves as a one-stop state tax data resource that compares all 50 states on over 40 measures of tax rates, collections, burdens, and more.
2 min read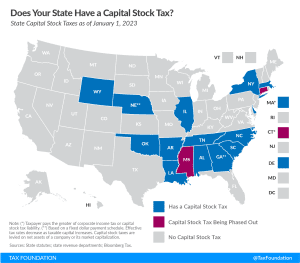
States can better position themselves for success by moving away from economically-damaging taxes like the capital stock tax.
4 min read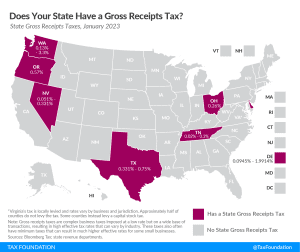
Gross receipts taxes impose costs on consumers, workers, and shareholders alike. Shifting from these economically damaging taxes can thus be a part of states’ plans for improving their tax codes in an increasingly competitive tax landscape.
4 min read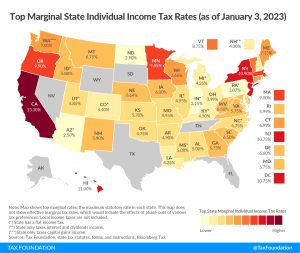
Individual income taxes are a major source of state government revenue, accounting for more than a third of state tax collections:
9 min read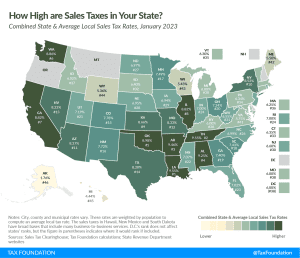
While many factors influence business location and investment decisions, sales taxes are something within policymakers’ control that can have immediate impacts.
11 min read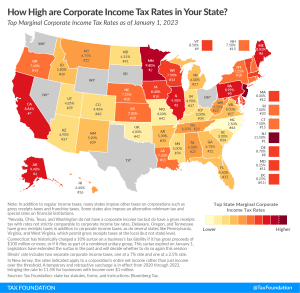
New Jersey levies the highest top statutory corporate tax rate at 11.5 percent, followed by Minnesota (9.8 percent) and Illinois (9.50 percent). Alaska and Pennsylvania levy top statutory corporate tax rates of 9.40 percent and 8.99 percent, respectively.
6 min read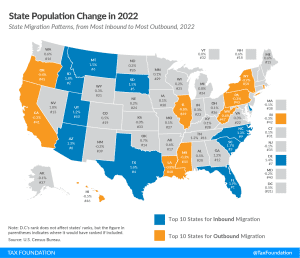
The pandemic has accelerated changes to the way we live and work, making it far easier for people to move—and they have. As states work to maintain their competitive advantage, they should pay attention to where people are moving, and try to understand why.
5 min read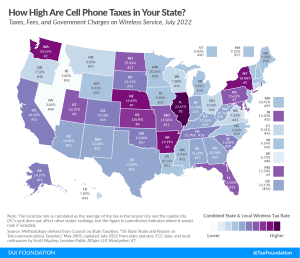
While the wireless market has become increasingly competitive in recent years, resulting in steady declines in the average price for wireless services, the price reduction for consumers has been partially offset by higher taxes.
41 min read
People respond to incentives. As tax rates increase or products are banned from sale, consumers and producers search for ways around these penalties and restrictions.
19 min read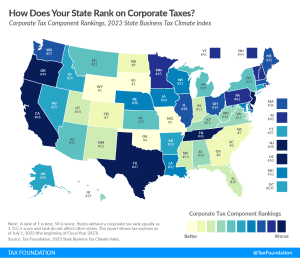
All corporate income taxes fall on capital investment, but the structure should not make matters worse, and policymakers should take care not to distort investment decisions through the use of targeted incentives for select firms or activities instead of a lower rate for all businesses.
2 min read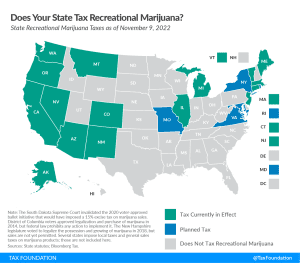
Recreational marijuana taxation is one of the hottest policy issues in the U.S. Currently, 19 states have implemented legislation to legalize and tax recreational marijuana sales.
6 min read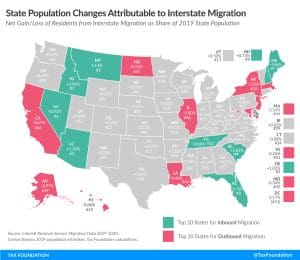
IRS and Census data show that people and businesses favor states with low and structurally sound tax systems, which can impact the state’s economic growth and governmental coffers.
12 min read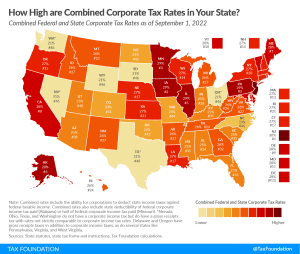
When examining tax burdens on businesses, it is important to consider both federal and state corporate taxes. Corporate taxes are one of the most economically damaging ways to raise revenue and are a promising area of reform for states to increase competitiveness and promote economic growth, benefiting both companies and workers.
3 min read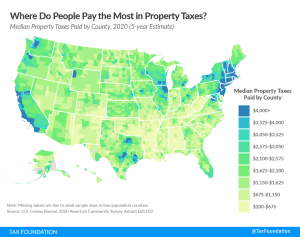
Property taxes are the primary tool for financing local government and generating state-level revenue in some states as well.
5 min read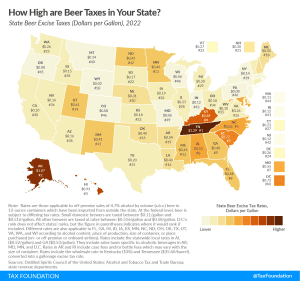
Tennessee, Alaska, Hawaii, and Kentucky levy the highest beer excise tax rates in the nation. How does your state compare?
3 min read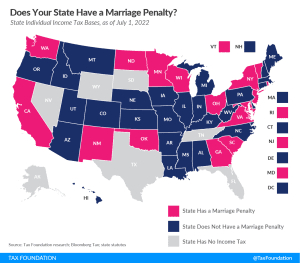
A marriage penalty exists when a state’s income brackets for married taxpayers filing jointly are less than double the bracket widths that apply to single filers. In other words, married couples who file jointly under this scenario have a higher effective tax rate than they would if they filed as two single individuals with the same amount of combined income.
3 min read
However well-intended they may be, sales tax holidays remain the same as they always have been—ineffective and inefficient.
43 min read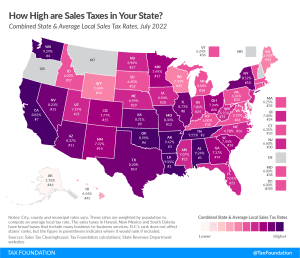
While many factors influence business location and investment decisions, sales taxes are something within policymakers’ control that can have immediate impacts.
12 min read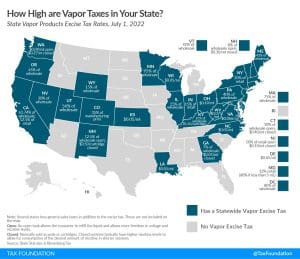
If the policy goal of taxing cigarettes is to encourage cessation, vapor taxation must be considered a part of that policy design.
4 min read