Key Findings
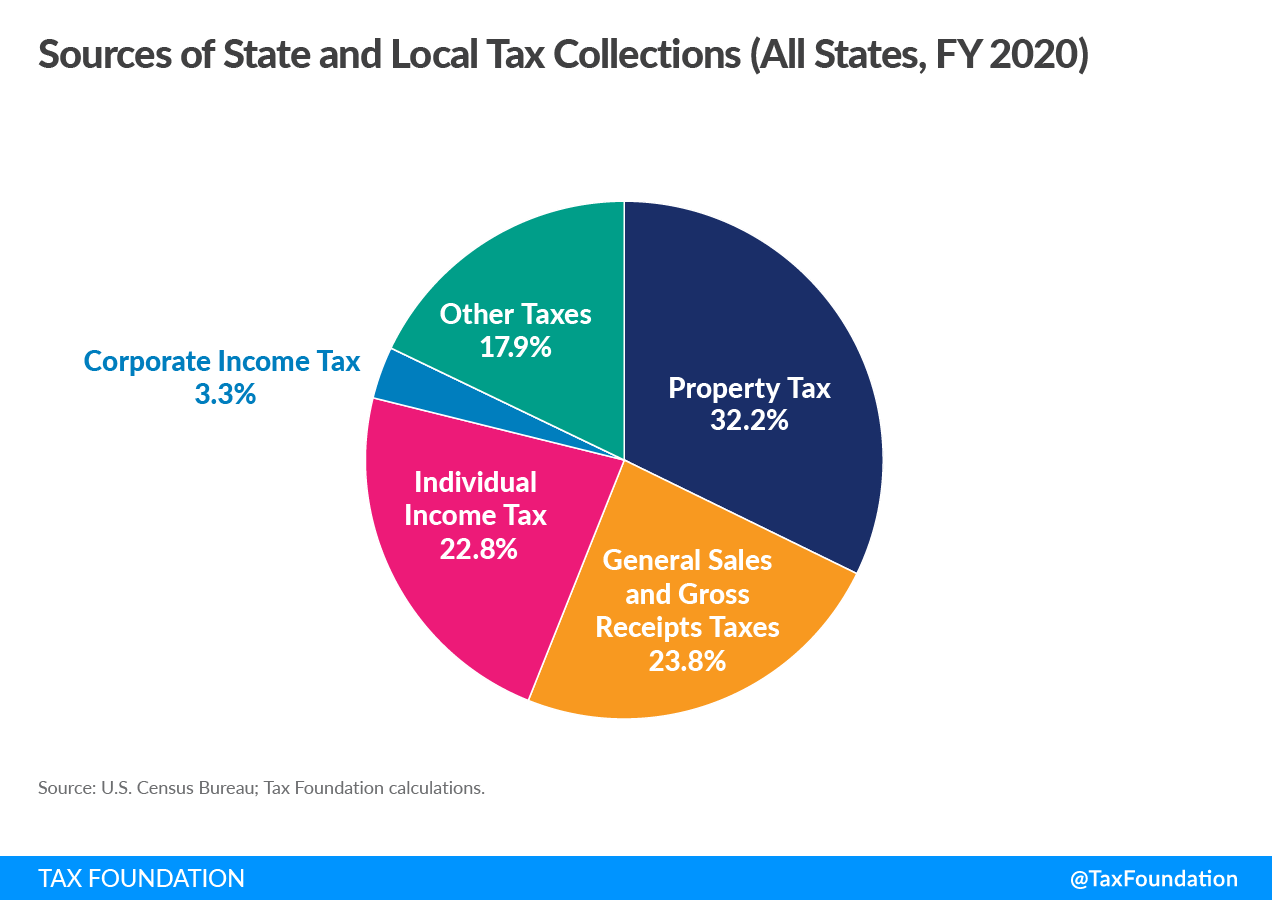
- Property taxes are the primary source of taxA tax is a mandatory payment or charge collected by local, state, and national governments from individuals or businesses to cover the costs of general government services, goods, and activities. collections at the local level, responsible for 72.2 percent of local tax revenue in fiscal year 2020 (the most recent year for which data are available). Once a significant driver of state budgets as well, their share of state collections has dropped to a mere 1.8 percent.
- Corporate income taxes only generated 3.3 percent of state and local tax revenue in fiscal year 2020. They are also among the more volatile sources of revenue for states.
- Individual income taxes are the largest source of state tax revenue, though nine states forgo the taxation of wage income. Income taxes are less pro-growth than consumption taxes because they discourage savings and labor force participation.
- Sales taxes generated 32.2 percent of state tax revenue in fiscal year 2020, and are a significant source of revenue for all 45 states which impose them. They also constitute a major local government revenue stream in some states.
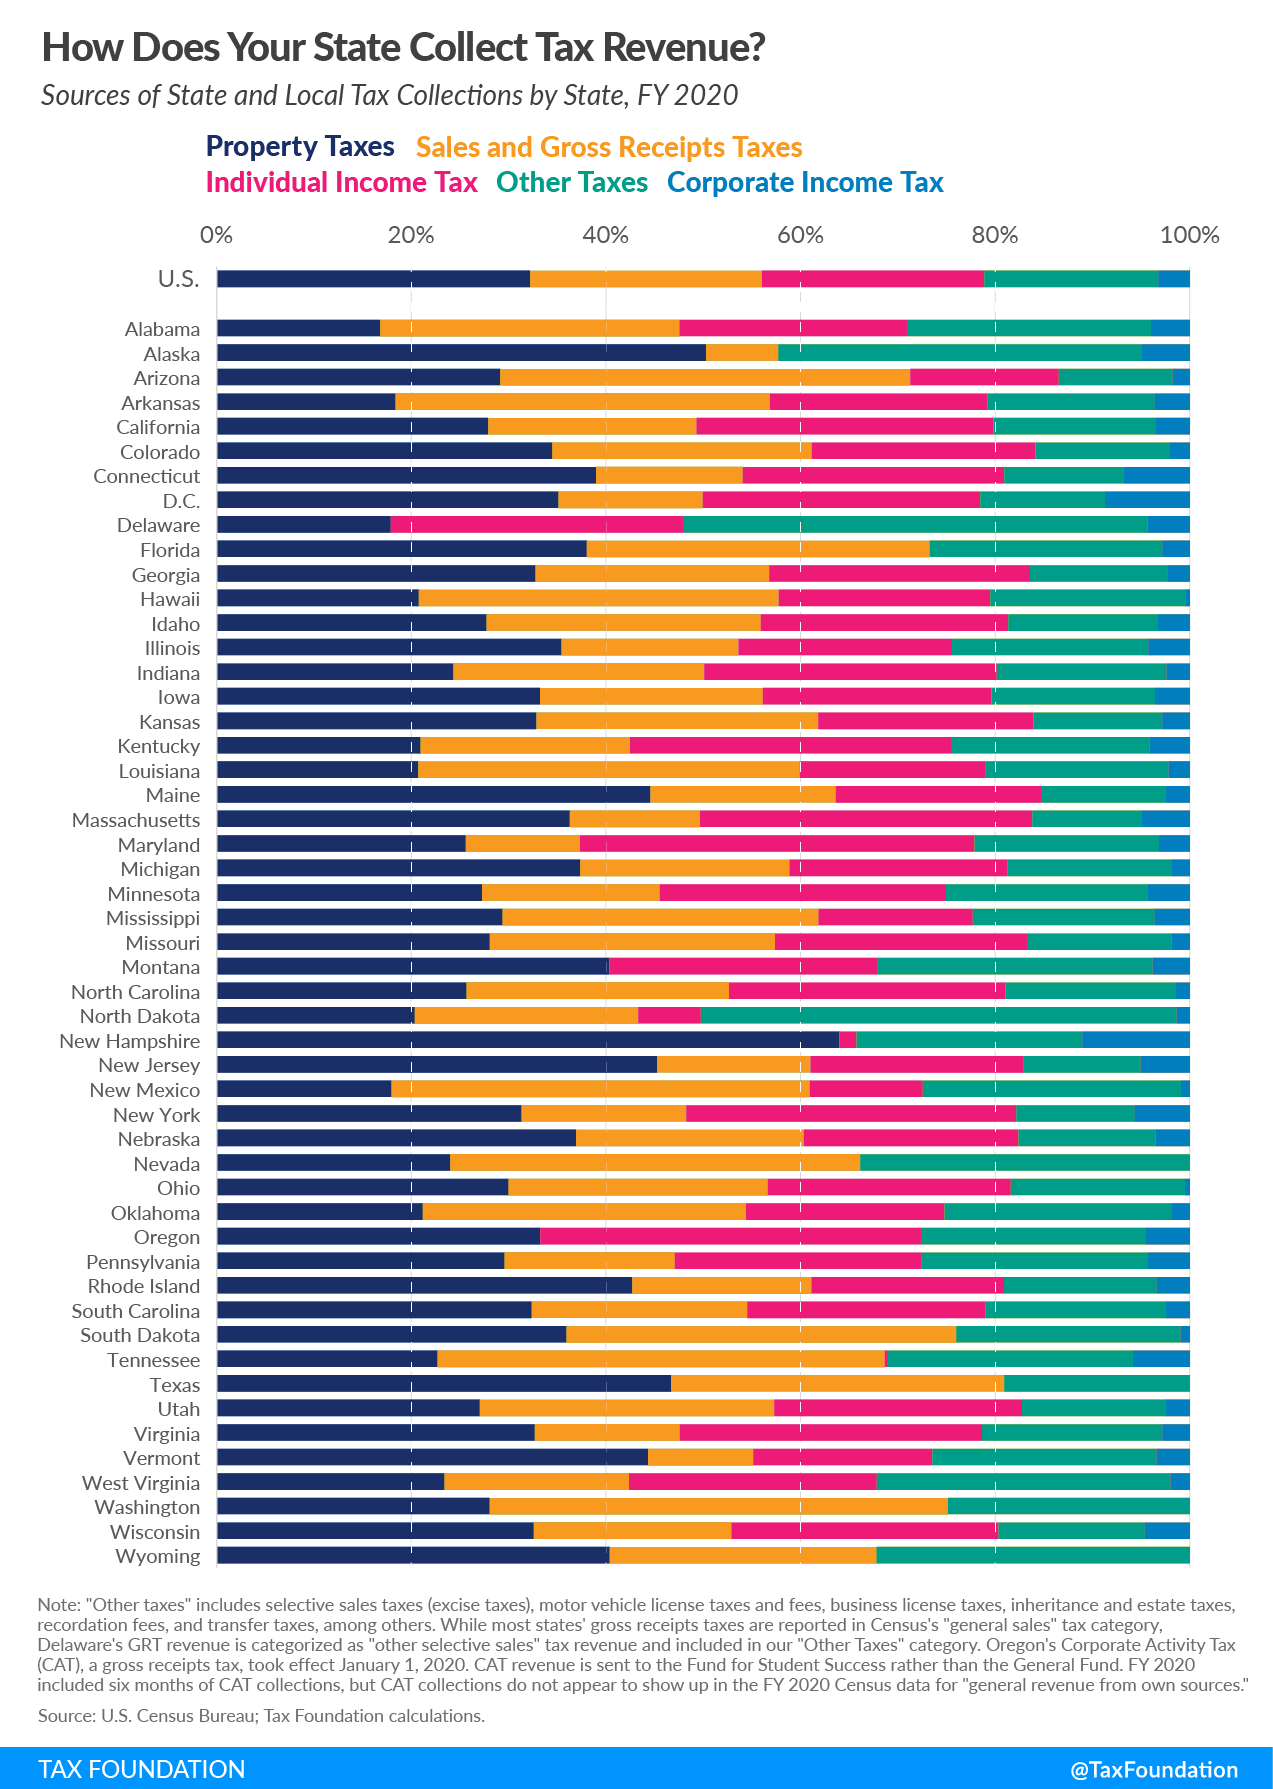
- Significant regional variations exist in tax reliance, with Southwestern states relying the most on property and sales taxes as a source of state and local tax collections, while Mideastern and New England states rely most on income taxes. Severance taxes have an outsized influence in the more resource-rich Far West.
- The mix of tax sources states choose can have important implications for both revenue stability and economic growth, and the many variations across states are indicative of the different ways states weigh competing policy goals.
Introduction
Maine has its blueberry tax[1] and the voluminous Alabama constitution specifically provides for mosquito taxes in Mobile County[2]—alas, the tax is levied on property, not mosquitoes—but when state and local governments wish to raise revenue, they generally turn to a traditional canon of tax options, like property taxes, sales taxA sales tax is levied on retail sales of goods and services and, ideally, should apply to all final consumption with few exemptions. Many governments exempt goods like groceries; base broadening, such as including groceries, could keep rates lower. A sales tax should exempt business-to-business transactions which, when taxed, cause tax pyramiding. es, and individual and corporate income taxA corporate income tax (CIT) is levied by federal and state governments on business profits. Many companies are not subject to the CIT because they are taxed as pass-through businesses, with income reportable under the individual income tax. es. The degree to which states lean on these options, however, and the extent to which they turn to alternatives, varies based on demography, geography, and even ideology.
Oregon derives nearly three-quarters of its state tax revenue from individual and corporate income taxes, while North Dakota raises just over a tenth of its revenue that way. In New England, less than 1 percent of local government tax revenue comes from sales taxes, compared to 25.1 percent in the Rocky Mountain region. In “live free or die” New Hampshire, 27.3 percent of state tax revenue is generated by corporate taxes, whereas such taxes are responsible for a mere 0.6 percent of state tax revenue in Hawaii.[3]
A state with an abundance of natural resources, like North Dakota, might turn predominantly to severance taxes, while one with a high volume of tourists, like Florida, can see value in relying heavily on sales taxes. Some states, particularly in New England and to a lesser extent in the Southwest, have longstanding traditions of both state and local property taxA property tax is primarily levied on immovable property like land and buildings, as well as on tangible personal property that is movable, like vehicles and equipment. Property taxes are the single largest source of state and local revenue in the U.S. and help fund schools, roads, police, and other services. es, while others, especially in the Southeast and Southwest, make extensive use of general sales taxes at both levels of government.
Stay informed on the tax policies impacting you.
Subscribe to get insights from our trusted experts delivered straight to your inbox.
Subscribe| State | Property Tax | Sales and Gross Receipts Taxes | Individual Income Tax | Corporate Income Tax | Other Taxes |
|---|---|---|---|---|---|
| U.S. | 32.2% | 23.8% | 22.8% | 3.3% | 17.9% |
| Alabama | 16.8% | 30.8% | 23.4% | 4.0% | 25.0% |
| Alaska | 50.3% | 7.4% | 0.0% | 4.9% | 37.4% |
| Arizona | 29.2% | 42.1% | 15.3% | 1.8% | 11.7% |
| Arkansas | 18.4% | 38.5% | 22.3% | 3.6% | 17.2% |
| California | 27.9% | 21.4% | 30.5% | 3.6% | 16.6% |
| Colorado | 34.5% | 26.7% | 23.0% | 2.1% | 13.7% |
| Connecticut | 39.0% | 15.1% | 26.9% | 6.8% | 12.3% |
| Delaware | 17.9% | 0.0% | 30.0% | 4.3% | 47.7% |
| Florida | 38.1% | 35.2% | 0.0% | 2.8% | 23.9% |
| Georgia | 32.8% | 24.0% | 26.8% | 2.3% | 14.2% |
| Hawaii | 20.8% | 37.0% | 21.7% | 0.4% | 20.1% |
| Idaho | 27.8% | 28.2% | 25.4% | 3.3% | 15.4% |
| Illinois | 35.4% | 18.2% | 21.9% | 4.3% | 20.2% |
| Indiana | 24.3% | 25.8% | 30.0% | 2.4% | 17.5% |
| Iowa | 33.2% | 22.9% | 23.5% | 3.6% | 16.8% |
| Kansas | 32.9% | 29.0% | 22.1% | 2.8% | 13.2% |
| Kentucky | 21.0% | 21.5% | 33.0% | 4.1% | 20.4% |
| Louisiana | 20.7% | 39.2% | 19.1% | 2.2% | 18.8% |
| Maine | 44.6% | 19.1% | 21.1% | 2.5% | 12.8% |
| Maryland | 25.6% | 11.7% | 40.5% | 3.2% | 19.0% |
| Massachusetts | 36.3% | 13.4% | 34.1% | 5.0% | 11.2% |
| Michigan | 37.4% | 21.5% | 22.4% | 1.9% | 16.9% |
| Minnesota | 27.3% | 18.2% | 29.4% | 4.3% | 20.7% |
| Mississippi | 29.4% | 32.4% | 15.9% | 3.6% | 18.7% |
| Missouri | 28.1% | 29.3% | 25.9% | 1.9% | 14.8% |
| Montana | 40.4% | 0.0% | 27.6% | 3.8% | 28.2% |
| Nebraska | 36.9% | 23.4% | 22.1% | 3.5% | 14.1% |
| Nevada | 24.0% | 42.1% | 0.0% | 0.0% | 33.9% |
| New Hampshire | 64.0% | 0.0% | 1.7% | 11.0% | 23.2% |
| New Jersey | 45.3% | 15.7% | 21.9% | 5.1% | 12.0% |
| New Mexico | 18.0% | 43.0% | 11.6% | 0.9% | 26.5% |
| New York | 31.4% | 16.9% | 33.9% | 5.6% | 12.2% |
| North Carolina | 25.7% | 27.0% | 28.4% | 1.5% | 17.4% |
| North Dakota | 20.4% | 23.0% | 6.4% | 1.4% | 48.9% |
| Ohio | 30.0% | 26.6% | 25.0% | 0.5% | 17.9% |
| Oklahoma | 21.2% | 33.2% | 20.4% | 1.8% | 23.4% |
| Oregon | 33.3% | 0.0% | 39.1% | 4.5% | 23.1% |
| Pennsylvania | 29.6% | 17.5% | 25.4% | 4.3% | 23.2% |
| Rhode Island | 42.7% | 18.4% | 19.8% | 3.4% | 15.7% |
| South Carolina | 32.4% | 22.1% | 24.5% | 2.4% | 18.6% |
| South Dakota | 36.0% | 40.0% | 0.0% | 0.9% | 23.0% |
| Tennessee | 22.7% | 45.9% | 0.2% | 5.8% | 25.3% |
| Texas | 46.7% | 34.2% | 0.0% | 0.0% | 19.0% |
| Utah | 27.1% | 30.2% | 25.5% | 2.5% | 14.8% |
| Vermont | 44.3% | 10.8% | 18.4% | 3.4% | 23.0% |
| Virginia | 32.7% | 14.9% | 31.0% | 2.8% | 18.5% |
| Washington | 28.1% | 47.1% | 0.0% | 0.0% | 24.9% |
| West Virginia | 23.4% | 19.0% | 25.4% | 2.0% | 30.2% |
| Wisconsin | 32.6% | 20.3% | 27.4% | 4.6% | 15.0% |
| Wyoming | 40.4% | 27.4% | 0.0% | 0.0% | 32.2% |
| Washington, D.C. | 35.1% | 14.8% | 28.5% | 8.7% | 12.8% |
| Note: Percentages may not add to 100 due to rounding. “Other taxes” includes selective sales taxes (excise taxes), motor vehicle license taxes and fees, business license taxes, inheritance and estate taxes, recordation fees, and transfer taxes, among others.
While most states’ gross receipts taxes are reported in Census’s “general sales” tax category, Delaware’s GRT revenue is categorized as “other selective sales” tax revenue and included in our “Other Taxes” category. Oregon’s Corporate Activity Tax (CAT), a gross receipts tax, took effect January 1, 2020. CAT revenue is sent to the Fund for Student Success rather than the General Fund. FY 2020 included six months of CAT collections, but CAT collections do not appear to show up in the FY 2020 Census data for “general revenue from own sources.” Source: Census Bureau; Tax Foundation calculations. |
|||||
Property Taxes
Property taxes are the largest source of combined state and local tax revenue in the United States, responsible for 32.2 percent of collections across all state and local tax jurisdictions in fiscal year 2020 (the most recent year for which data are available). This is driven almost entirely by the predominance of property taxes in the local revenue toolkit, where they are responsible for 72.2 percent of all tax revenues. Most states have abandoned, or nearly so, any reliance on statewide property taxes, which now account for a mere 1.8 percent of state tax revenue nationwide, down from 52.6 percent in 1902.[4]
This category includes taxes on commercial and residential real estate, as well as tangible personal property taxes levied on business equipment and select personal property like cars and boats. Real estate taxes are typically a source of local tax revenue, while personal property taxes may fund state or local governments, or both. States have been moving away from the taxation of personal property, but for now, many such taxes remain in place.[5]
Economists tend to favor taxes on real property and improvements (land and structures), as they adhere reasonably well to the benefit principle, or the idea in public finance that taxes paid should relate closely with benefits received. They help to pay for services tied to property ownership—local road maintenance, law enforcement and emergency services, and the like—and the value of the property is a reasonable, if imperfect, proxy for the value of those services.[6] Many economists also favor property taxes over alternative forms of taxation, like income and sales taxes, because they have a relatively limited impact on economic growth and development.[7] Whereas capital is frequently mobile, and can be shifted to lower tax jurisdictions, real property is immovable. Thus, while its value is affected by taxation, it cannot be moved due to tax costs.
Tax jurisdictions levy property taxes in a variety of ways: some impose a rate or a millage—the amount of tax per thousand dollars of value—on the fair market value of the property, while others impose it on some percentage (the assessment ratio) of the market value, yielding an assessed value. Occasionally, valuations are made on income potential or other metrics.
Some states have equalization requirements, ensuring uniformity across the state. Sometimes caps limit the degree to which one’s property taxes can rise in a given year, and sometimes rate adjustments are mandated after assessments to ensure uniformity or maintenance of revenues.[8] Abatements are often available to certain taxpayers, like veterans or senior citizens. Localities frequently offer abatements or other property tax incentives to select companies.[9] And of course, property tax rates are set by political subdivisions at a variety of levels: not only by cities and counties, but often also by school boards, fire departments, and utility commissions.
As of FY 2020, 14 states have no state property tax collections whatsoever, while local governments in all states include levies on property in their tax mix. Property taxes comprise more than 90 percent of local government tax collections in 13 states, led by Maine at 99.0 percent of local revenue, and under half of local revenue in only four states.[10] In New Hampshire, where property taxes are responsible for 14.3 percent of state and 97.7 percent of local tax collections, 64.0 percent of all state and local tax revenue comes from property taxes. At the other end of the spectrum, only 16.8 percent of Alabama’s state and local collections are derived from property taxes.
The Southwest and New England states rely the most heavily on property taxes (40.3 percent and 40.2 percent of state and local tax revenues, respectively), while the Far West has the lowest property tax reliance at 28.1 percent.[11]
| Region | State | Local | Combined |
|---|---|---|---|
| New England | 2.5% | 97.1% | 40.2% |
| Mideast | 0.5% | 65.2% | 32.8% |
| Great Lakes | 1.7% | 78.7% | 32.7% |
| Plains | 3.0% | 83.9% | 31.0% |
| Southeast | 1.4% | 68.4% | 29.4% |
| Southwest | 1.2% | 78.1% | 40.3% |
| Rocky Mountain | 1.0% | 67.8% | 32.1% |
| Far West | 3.1% | 68.6% | 28.1% |
| Source: U.S. Census Bureau; Tax Foundation calculations. | |||
General Sales and Gross Receipts Taxes
Sales taxes are a significant source of both state and local government tax revenue. While economists generally draw sharp delineations among general sales taxes, excise taxes, and gross receipts taxes, the U.S. Census Bureau does not distinguish between taxes levied on sales and those imposed on gross receipts. Due to these data limitations, this category includes both general sales taxes and certain gross receipts taxes, though excise taxes are considered separately in the “Other Taxes” section.
General sales taxes are levied on goods and services generally (subject to a range of exemptions). They are paid by consumers but are generally collected and remitted by retailers. In cases in which the retailer is not legally obligated to collect and remit the sales tax, the consumer may be obligated to remit directly to the government a compensating use tax.
Unlike general sales taxes, selective sales taxes—often called excise taxes—are special taxes or rates on the sale of particular goods or services.[12] They tend to be collected on motor fuels, alcoholic beverages, amusements, insurance, tobacco products, pari-mutuels, and public utilities.
Finally, a few states impose, or permit localities to impose, gross receipts taxes. These are business taxes that are often levied in lieu of corporate income taxes, but unlike corporate income taxes—which allow deductions for compensation, costs of goods sold, and other expenses—gross receipts taxes are levied on the entire receipts of a firm with few, if any, deductions. Gross receipts taxes tend to be disfavored by economists because they fall on all stages of production, yielding “tax pyramidingTax pyramiding occurs when the same final good or service is taxed multiple times along the production process. This yields vastly different effective tax rates depending on the length of the supply chain and disproportionately harms low-margin firms. Gross receipts taxes are a prime example of tax pyramiding in action. ,” whereby the same final transaction is exposed to taxes several times over. Imposed on gross incomeFor individuals, gross income is the total pre-tax earnings from wages, tips, investments, interest, and other forms of income and is also referred to as “gross pay.” For businesses, gross income is total revenue minus cost of goods sold and is also known as “gross profit” or “gross margin.” rather than net income (profit), such taxes also bear no relationship to a firm’s ability to pay.[13] For a list of statewide gross receipts taxes and the revenue generated from statewide gross receipts taxes in FY 2020, see Table 12.
Washington State, Tennessee, New Mexico, and Nevada derive the highest proportions of state and local tax revenues from sales and gross receipts taxes, at 47.1, 45.9, 43.0, and 42.1 percent, respectively. Tennessee, Nevada, and Washington each have a statewide gross receipts taxA gross receipts tax, also known as a turnover tax, is applied to a company’s gross sales, without deductions for a firm’s business expenses, like costs of goods sold and compensation. Unlike a sales tax, a gross receipts tax is assessed on businesses and apply to business-to-business transactions in addition to final consumer purchases, leading to tax pyramiding. —the Commerce Tax in Nevada, the business tax in Tennessee, and the Business & Occupation (B&O) tax in Washington. All three of these states forgo individual income taxes on wage income.[14] (Washington does, however, impose a tax on the capital gains income of high earners.) Both Nevada and Washington also forgo corporate income taxes.[15] New Mexico’s sales tax, which is known as the “gross receipts tax,” has a very broad base that captures many business inputs.
General sales and gross receipts taxes were responsible for 23.8 percent of state and local tax revenue in fiscal year 2020, and tend to feature more prominently in state than in local tax collections, yielding 32.2 percent of state and 12.8 percent of local tax revenue. Forty-five states impose state sales taxes, while local sales taxes are collected in 38 states, typically through local option but occasionally as mandatory local taxes administered by the state. Alaska is unique in forgoing a state sales tax but permitting local option sales taxes.[16]
States which choose not to impose an individual income taxAn individual income tax (or personal income tax) is levied on the wages, salaries, investments, or other forms of income an individual or household earns. The U.S. imposes a progressive income tax where rates increase with income. The Federal Income Tax was established in 1913 with the ratification of the 16th Amendment. Though barely 100 years old, individual income taxes are the largest source of tax revenue in the U.S. tend to increase reliance on the sales tax, while the states without a sales tax are more likely to look to severance taxes or miscellaneous business taxes for an outsized share of revenue rather than leaning more heavily on income taxes. The six states with the highest reliance on state sales taxes all forgo an individual income tax on wage income. Similarly, four of the five states with the highest total combined reliance on state and local sales taxes do not levy an individual income tax on wage income. Consumption taxes are less harmful to growth than income taxes because they do not fall on savings, investment, or future consumption.[17]
Local governments in four states—Alabama, Arkansas, Louisiana, and New Mexico—derive more than 40 percent of their tax revenue from sales taxes. At the state level, seven states rely on sales taxes for more than half their tax revenue, led by Texas at 63.0 percent. The state forgoes both individual and corporate income taxes but does impose both a sales tax and the Margin Tax, a gross receipts tax. Of the 45 states with a state sales tax, Vermont has the lowest reliance at 12.6 percent.
The Southwest leans the most on sales taxes, with 35.8 percent of revenue derived from these sources, while New England turns to sales taxes the least, at 13.6 percent reliance. Local option sales tax collections are a significant source of revenue in the Rocky Mountain region but play a negligible role in New England’s revenue picture.
| Region | State | Local | Combined |
|---|---|---|---|
| New England | 22.7% | 0.04% | 13.6% |
| Mideast | 21.8% | 10.1% | 16.0% |
| Great Lakes | 32.8% | 5.9% | 22.0% |
| Plains | 28.5% | 8.7% | 21.7% |
| Southeast | 37.4% | 17.5% | 29.1% |
| Southwest | 55.6% | 16.7% | 35.8% |
| Rocky Mountain | 30.2% | 25.1% | 27.8% |
| Far West | 30.0% | 15.6% | 24.5% |
| Source: U.S. Census Bureau; Tax Foundation calculations. | |||
Individual Income Taxes
Individual income taxes are the second largest source of state tax revenue, accounting for 36.5 percent of state tax collections in fiscal year 2020, but their modest role in local tax collections (4.9 percent) yields a 22.8 percent share of total state and local tax revenue, making individual income taxes the third largest source of state and local tax collections nationwide.
Forty-three states tax some forms of individual income, but only 41 tax wage income. (New Hampshire taxes only interest and dividend income, while Washington taxes the capital gains income of high earners.) At the local level, however, individual income taxes are significantly less common. Local individual income taxes are present in only 17 states and the District of Columbia.[18]
The U.S. Census Bureau reports individual income tax collections by local governments in 13 states and the District of Columbia. Several other states can be argued to feature local income taxes or a near equivalent—for instance, four West Virginia municipalities impose wage taxes of $2 to $5 per week[19]—but this analysis is concerned only with those states where localities report individual income tax collections to the Census Bureau.
Of these, localities in three states and the District of Columbia rely on income taxes for more than 20 percent of their revenue, led by Maryland’s local governments at 34.9 percent,[20] while municipal governments in six states with local income taxes generate less than 4 percent of their revenue that way. Most states do not permit localities to levy their own income taxes.
Oregon, which forgoes a sales tax, relies the most heavily on state individual income tax collections (67.6 percent), while among states which tax wage income, North Dakota has the lowest income tax reliance at 8.7 percent. Of states imposing all the major tax types, New York has the highest individual income tax reliance at 57.9 percent. Total combined state and local reliance in states that tax wage income ranges from 6.4 percent in North Dakota to 40.5 percent in Maryland.
Income taxes discourage growth more per unit of tax revenue than do consumption taxes because they discourage savings and labor force participation.[21] In 2020, states which forwent an individual income tax on wage income saw a net gain of nearly 200,000 taxpayers and $38.3 billion in adjusted gross income (AGI) inflow, while states which imposed all major taxes experienced a net out-migration of nearly 212,000 taxpayers and an outflow of $39.2 billion.[22] Five of the seven states without any form of income tax during the previous decade grew faster than the national average over the decade—four at more than twice the national average and all ranking within the top seven states for growth—with Alaska and Wyoming (which are very reliant on extractive industries) the outliers. Traditional arguments in favor of individual income taxation tend to focus less on state product and more on progressivity and revenue diversification, though consumption taxA consumption tax is typically levied on the purchase of goods or services and is paid directly or indirectly by the consumer in the form of retail sales taxes, excise taxes, tariffs, value-added taxes (VAT), or an income tax where all savings is tax-deductible. es are less volatile than taxes on income.
The Mideast and New England states turn most strongly to individual income taxes, with combined state and local reliance of 30.8 and 27.5 percent respectively, while the Southwest, where income taxes are only responsible for 4.7 percent of revenue, looks to them the least.
| Region | State | Local | Combined |
|---|---|---|---|
| New England | 45.7% | 0.0% | 27.5% |
| Mideast | 47.0% | 14.5% | 30.8% |
| Great Lakes | 35.6% | 8.0% | 24.5% |
| Plains | 35.9% | 0.4% | 23.6% |
| Southeast | 31.2% | 1.3% | 18.7% |
| Southwest | 9.5% | 0.0% | 4.7% |
| Rocky Mountain | 42.5% | 0.0% | 22.7% |
| Far West | 41.1% | 0.0% | 25.4% |
| Source: U.S. Census Bureau; Tax Foundation calculations. | |||
Corporate Income Taxes
Although they garner a good deal of attention, corporate income taxes contribute relatively little to state and local government coffers, and their revenue tends to be highly volatile. Corporate income taxes are responsible for a mere 3.3 percent of combined state and local tax collections, including 4.9 percent of state revenue and 1.1 percent of local revenue.
Forty-four states tax corporate income. Of the six which forgo a corporate income tax, all but two (South Dakota and Wyoming) impose a gross receipts tax. New Hampshire has the highest reliance on corporate income taxation, at 27.3 percent, though this category includes not only the state’s corporate income tax but also its unique value-added tax, which is essentially a consumption tax. Alaska follows at 12.3 percent, and state reliance is under 10 percent in all but three states.
Localities in nine states impose municipal corporate income taxes, led by New York, where corporate income taxes account for 6.0 percent of local revenue. New York is a significant outlier, both in that—alone among states—localities (chiefly New York City) rely more heavily on the corporate income tax than the state itself does and in that no other state’s localities lean on the corporate income tax for more than 3 percent of revenue.
Corporate income taxes are among the most economically disadvantageous revenue options, as they discourage the sort of activities which are most significant for growth, like investment in capital and productivity improvements.[23] States also tend to carve out their corporate income tax baseThe tax base is the total amount of income, property, assets, consumption, transactions, or other economic activity subject to taxation by a tax authority. A narrow tax base is non-neutral and inefficient. A broad tax base reduces tax administration costs and allows more revenue to be raised at lower rates. with tax incentives, undermining tax neutrality and raising tax costs for unincentivized businesses.[24]
Corporate income taxes are the most prominent in New England, where they account for 5.5 percent of combined state and local collections and 9.2 percent of state revenue. Local governments in the region do not have the power to impose corporate income taxes. The Southwest demonstrates the lowest reliance, at 0.5 percent of combined state and local tax revenue.
| Region | State | Local | Combined |
|---|---|---|---|
| New England | 9.2% | 0.0% | 5.5% |
| Mideast | 6.2% | 3.9% | 5.1% |
| Great Lakes | 4.4% | 0.3% | 2.8% |
| Plains | 5.4% | 0.0% | 3.5% |
| Southeast | 4.8% | 0.2% | 2.9% |
| Southwest | 1.0% | 0.0% | 0.5% |
| Rocky Mountain | 4.2% | 0.0% | 2.2% |
| Far West | 4.7% | 0.1% | 2.9% |
| Source: U.S. Census Bureau; Tax Foundation calculations. | |||
Other Taxes
Although income (corporate and individual), property, and sales (including some gross receipts) taxes are responsible for over 80 percent of state and local tax revenue, a wide variety of other taxes fill out the remainder. Excise taxes on motor fuel, tobacco, alcohol, and other products are responsible for more than half of the 17.9 percent of state and local tax revenue not accounted for by individual income, corporate income, sales, and property taxes, and are levied (to varying degrees) in all states. Unlike a general sales tax, these “selective sales taxes,” as they are sometimes called, discriminate among different kinds of transactions.
Some of the remaining sources of taxation, like severance taxes, can be highly significant sources of revenue for a select few states. In Alaska, for instance, 78.1 percent of state tax revenue (and 37.4 percent of combined state and local tax revenue) comes from other taxes, chiefly the state’s Oil and Gas Production Tax. Other tax revenue sources, like motor vehicle license fees, business licenses, inheritance and estate taxes, recordation fees, and transfer taxes, have more modest revenue implications but are relied upon by states in varying degrees.
North Dakota, another resource-rich state, also has a strong reliance on other forms of taxation, at 64.7 percent of state tax revenue and 48.9 percent of combined state and local tax revenue. Delaware, which has an extensive business licensing apparatus, also comes in high at 57.6 percent of state tax revenue and 47.7 percent of combined tax revenue. New Jersey, Arizona, and Massachusetts have the least reliance, at 12.0, 11.7, and 11.2 percent, respectively. Nationally, other taxes account for 24.6 percent of state tax revenue and 9.1 percent of local tax revenue. Regionally, the highest reliance is in the Plains and the Southeast, while the lowest reliance is found in New England.
| Region | State | Local | Combined |
|---|---|---|---|
| New England | 20.0% | 2.9% | 13.2% |
| Mideast | 24.5% | 6.3% | 15.4% |
| Great Lakes | 25.4% | 7.1% | 18.1% |
| Plains | 27.2% | 7.1% | 20.2% |
| Southeast | 25.2% | 12.6% | 20.0% |
| Southwest | 32.7% | 5.2% | 18.7% |
| Rocky Mountain | 22.2% | 7.1% | 15.2% |
| Far West | 21.0% | 15.7% | 19.0% |
| Source: U.S. Census Bureau; Tax Foundation calculations. | |||
Competition in State Tax Structure
State tax structures vary widely. The highest-income states rely more heavily on property taxes, while the lowest-income states lean on sales and gross receipts taxes. This is significantly a product of the sales tax-heavier Southern states disproportionately falling in the bottom quintile while property tax-centric New England states can be found in the top quintile, though the effect persists even neglecting these states. Reliance on individual income taxes does not correlate strongly with a state’s average household income.
| State’s Quintile | Property | Sales | PIT | CIT | Other |
|---|---|---|---|---|---|
| Bottom Quintile | 30.7% | 33.0% | 13.7% | 2.9% | 19.7% |
| Second Quintile | 28.0% | 26.4% | 24.3% | 2.3% | 18.9% |
| Third Quintile | 37.2% | 28.1% | 13.8% | 1.4% | 19.4% |
| Fourth Quintile | 32.6% | 22.7% | 21.1% | 3.1% | 20.5% |
| Top Quintile | 31.4% | 18.2% | 30.8% | 4.5% | 15.1% |
| Source: U.S. Census Bureau; Tax Foundation calculations. | |||||
Over the years, income taxes have gained ground as a source of state and local government tax collections, sales tax collections have mostly been flat, and property tax reliance has declined precipitously. Property taxes continue to be the predominant source of revenue for local governments, but they long ago lost their cachet at the state level. Until the 1920s, property taxes yielded over 80 percent of all state and local tax revenue; today, property taxes account for less than one-third of collections (see Table 10).
These shifts have economic consequences. Some states elect to forgo certain taxes, often with the intent of spurring greater economic activity. Other states impose all the major taxes, frequently with the aim of diversifying their sources of revenue. Taxes differ on revenue stability, with corporate income taxes typically among the most volatile. They differ, too, in their distributional effects, with income taxes generally seen as more progressive than sales taxes. State and local governments must weigh competing policy goals in creating their tax structures, making important decisions about neutrality, equity, and economic implications.
Each state’s tax mix encompasses both the legacies of the past and the ambitions of the present. But this means that each state’s tax code also reflects a patchwork of choices made over many decades, often yielding an overall design which is a poor reflection of policymakers’ purposes. It may be too much to ask states to adopt tax systems which look like someone designed them on purpose,[25] but a state’s tax mix reflects its underlying policy assumptions, a mirror on the implicit aims the code has taken on over the years. Sometimes it pays to have a look in the mirror.
Appendix
| State | Property Tax | General Sales and Gross Receipts Taxes | Individual Income Tax | Corporate Income Tax | Other Taxes |
|---|---|---|---|---|---|
| U.S. Avg. | 1.8% | 32.2% | 36.5% | 4.9% | 24.6% |
| Ala. | 3.7% | 24.7% | 35.5% | 6.3% | 29.8% |
| Alaska | 9.5% | 0.0% | 0.0% | 12.3% | 78.1% |
| Ariz. | 6.2% | 50.2% | 25.7% | 3.0% | 15.0% |
| Ark. | 11.8% | 36.0% | 28.4% | 4.6% | 19.2% |
| Calif. | 1.8% | 25.4% | 49.1% | 5.7% | 18.0% |
| Colo. | 0.0% | 22.6% | 50.0% | 4.6% | 22.8% |
| Conn. | 0.0% | 24.9% | 44.4% | 11.2% | 19.5% |
| Del. | 0.0% | 0.0% | 37.0% | 5.4% | 57.6% |
| Fla. | 0.0% | 62.5% | 0.0% | 5.8% | 31.7% |
| Ga. | 2.8% | 26.1% | 49.6% | 4.2% | 17.3% |
| Hawaii | 0.0% | 48.0% | 30.6% | 0.6% | 20.9% |
| Idaho | 0.0% | 39.8% | 36.2% | 4.7% | 19.3% |
| Ill. | 0.1% | 26.2% | 39.7% | 7.7% | 26.3% |
| Ind. | 0.1% | 36.8% | 37.1% | 3.4% | 22.6% |
| Iowa | 0.0% | 33.3% | 37.1% | 5.8% | 23.8% |
| Kans. | 8.1% | 35.3% | 35.0% | 4.5% | 17.1% |
| Ky. | 4.9% | 31.3% | 36.1% | 4.8% | 22.8% |
| La. | 0.8% | 31.4% | 34.4% | 4.0% | 29.5% |
| Maine | 0.9% | 34.4% | 38.0% | 4.5% | 22.3% |
| Md. | 3.6% | 20.7% | 44.8% | 5.5% | 25.4% |
| Mass. | 0.0% | 21.5% | 55.1% | 8.0% | 15.4% |
| Mich. | 8.5% | 32.9% | 32.2% | 2.9% | 23.6% |
| Minn. | 2.8% | 24.0% | 40.8% | 6.0% | 26.4% |
| Miss. | 0.4% | 47.0% | 23.0% | 5.2% | 24.4% |
| Mo. | 0.3% | 30.6% | 47.6% | 2.9% | 18.6% |
| Mont. | 10.5% | 0.0% | 42.3% | 5.9% | 41.4% |
| Nebr. | 0.0% | 37.0% | 41.8% | 6.7% | 14.5% |
| Nev. | 3.7% | 58.0% | 0.0% | 0.0% | 38.4% |
| N.H. | 14.3% | 0.0% | 4.3% | 27.3% | 54.1% |
| N.J. | 0.0% | 29.2% | 40.6% | 9.4% | 20.8% |
| N.M. | 1.2% | 43.4% | 17.2% | 1.3% | 36.8% |
| N.Y. | 0.0% | 17.2% | 57.9% | 5.2% | 19.7% |
| N.C. | 0.0% | 29.9% | 44.2% | 2.3% | 23.5% |
| N.D. | 0.1% | 24.6% | 8.7% | 1.9% | 64.7% |
| Ohio | 0.0% | 42.1% | 27.1% | 0.0% | 30.8% |
| Okla. | 0.0% | 29.1% | 33.1% | 3.0% | 34.9% |
| Ore. | 0.2% | 0.0% | 67.6% | 7.0% | 25.2% |
| Pa. | 0.1% | 28.6% | 30.4% | 6.2% | 34.7% |
| R.I. | 0.1% | 32.8% | 35.2% | 6.0% | 25.8% |
| S.C. | 0.4% | 30.2% | 43.2% | 4.3% | 21.9% |
| S.D. | 0.0% | 59.7% | 0.0% | 1.9% | 38.5% |
| Tenn. | 0.0% | 57.9% | 0.3% | 9.0% | 32.8% |
| Tex. | 0.0% | 63.0% | 0.0% | 0.0% | 37.0% |
| Utah | 0.0% | 35.6% | 42.8% | 4.1% | 17.5% |
| Vt. | 33.6% | 12.6% | 22.3% | 4.1% | 27.3% |
| Va. | 0.1% | 20.4% | 53.4% | 4.9% | 21.2% |
| Wash. | 12.9% | 58.4% | 0.0% | 0.0% | 28.8% |
| W.Va. | 0.1% | 25.4% | 35.7% | 2.8% | 36.0% |
| Wis. | 0.5% | 29.0% | 42.3% | 7.2% | 21.0% |
| Wyo. | 15.1% | 39.0% | 0.0% | 0.0% | 46.0% |
| D.C. | 0.0% | 0.0% | 0.0% | 0.0% | 0.0% |
| Note: Collections for the District of Columbia are included under local tax collections.
While most states’ gross receipts taxes are reported in Census’s “general sales” tax category, Delaware’s GRT revenue is categorized as “other selective sales” tax revenue and included in our “Other Taxes” category. Oregon’s Corporate Activity Tax (CAT), a gross receipts tax, took effect January 1, 2020. CAT revenue is sent to the Fund for Student Success rather than the General Fund. FY 2020 included six months of CAT collections, but CAT collections do not appear to show up in the FY 2020 Census data for “general revenue from own sources.” Source: U.S. Census Bureau; Tax Foundation calculations. |
|||||
| State | Property Tax | General Sales and Gross Receipts Taxes | Individual Income Tax | Corporate Income Tax | Other Taxes |
|---|---|---|---|---|---|
| U.S. Avg. | 72.2% | 12.8% | 4.9% | 1.1% | 9.1% |
| Ala. | 40.0% | 41.4% | 2.0% | 0.0% | 16.6% |
| Alaska | 77.3% | 12.3% | 0.0% | 0.0% | 10.4% |
| Ariz. | 62.8% | 30.2% | 0.0% | 0.0% | 6.9% |
| Ark. | 42.7% | 47.5% | 0.0% | 0.0% | 9.9% |
| Calif. | 70.9% | 14.8% | 0.0% | 0.0% | 14.3% |
| Colo. | 63.9% | 30.1% | 0.0% | 0.0% | 6.0% |
| Conn. | 98.7% | 0.0% | 0.0% | 0.0% | 1.3% |
| Del. | 82.9% | 0.0% | 4.7% | 0.6% | 11.9% |
| Fla. | 75.2% | 8.6% | 0.0% | 0.0% | 16.2% |
| Ga. | 68.0% | 21.6% | 0.0% | 0.0% | 10.4% |
| Hawaii | 71.6% | 10.1% | 0.0% | 0.0% | 18.3% |
| Idaho | 92.9% | 0.9% | 0.0% | 0.0% | 6.1% |
| Ill. | 79.2% | 8.2% | 0.0% | 0.0% | 12.6% |
| Ind. | 81.1% | 0.0% | 13.5% | 0.0% | 5.4% |
| Iowa | 86.4% | 6.3% | 1.7% | 0.0% | 5.6% |
| Kans. | 75.3% | 18.1% | 0.0% | 0.0% | 6.6% |
| Ky. | 56.1% | 0.0% | 26.2% | 2.7% | 15.0% |
| La. | 45.6% | 49.0% | 0.0% | 0.0% | 5.4% |
| Maine | 99.0% | 0.0% | 0.0% | 0.0% | 1.0% |
| Md. | 54.5% | 0.0% | 34.9% | 0.0% | 10.6% |
| Mass. | 95.5% | 0.0% | 0.0% | 0.0% | 4.5% |
| Mich. | 92.0% | 0.0% | 3.8% | 0.0% | 4.1% |
| Minn. | 90.7% | 3.3% | 0.0% | 0.0% | 6.0% |
| Miss. | 94.1% | 0.0% | 0.0% | 0.0% | 5.9% |
| Mo. | 56.8% | 28.0% | 3.5% | 0.7% | 10.9% |
| Mont. | 96.5% | 0.0% | 0.0% | 0.0% | 3.5% |
| Nebr. | 78.3% | 8.1% | 0.0% | 0.0% | 13.6% |
| Nev. | 59.0% | 14.9% | 0.0% | 0.0% | 26.1% |
| N.H. | 97.7% | 0.0% | 0.0% | 0.0% | 2.3% |
| N.J. | 98.3% | 0.0% | 0.0% | 0.0% | 1.7% |
| N.M. | 52.9% | 42.0% | 0.0% | 0.0% | 5.1% |
| N.Y. | 58.3% | 16.6% | 13.3% | 6.0% | 5.7% |
| N.C. | 72.0% | 21.6% | 0.0% | 0.0% | 6.4% |
| N.D. | 77.4% | 18.2% | 0.0% | 0.0% | 4.4% |
| Ohio | 64.4% | 8.9% | 22.5% | 1.0% | 3.1% |
| Okla. | 55.3% | 39.9% | 0.0% | 0.0% | 4.9% |
| Ore. | 78.8% | 0.0% | 0.0% | 1.1% | 20.1% |
| Pa. | 67.8% | 3.1% | 18.8% | 1.9% | 8.4% |
| R.I. | 97.3% | 0.0% | 0.0% | 0.0% | 2.7% |
| S.C. | 74.2% | 11.6% | 0.0% | 0.0% | 14.2% |
| S.D. | 73.3% | 19.7% | 0.0% | 0.0% | 7.1% |
| Tenn. | 65.3% | 23.6% | 0.0% | 0.0% | 11.1% |
| Tex. | 83.4% | 11.6% | 0.0% | 0.0% | 4.9% |
| Utah | 66.9% | 22.4% | 0.0% | 0.0% | 10.7% |
| Vt. | 94.9% | 2.3% | 0.0% | 0.0% | 2.9% |
| Va. | 77.9% | 7.3% | 0.0% | 0.0% | 14.8% |
| Wash. | 51.9% | 29.4% | 0.0% | 0.0% | 18.7% |
| W.Va. | 81.4% | 2.9% | 0.0% | 0.0% | 15.7% |
| Wis. | 91.6% | 4.3% | 0.0% | 0.0% | 4.0% |
| Wyo. | 84.6% | 7.3% | 0.0% | 0.0% | 8.2% |
| D.C. | 35.1% | 14.8% | 28.5% | 8.7% | 12.8% |
| Source: U.S. Census Bureau; Tax Foundation calculations. | |||||
| Year | Property Tax | Sales, Excise, and Gross Receipts Taxes | Individual Income Tax | Corporate Income Tax | Other Taxes |
|---|---|---|---|---|---|
| 1902 | 82.1% | 3.3% | 0.0% | 0.0% | 14.7% |
| 1913 | 82.8% | 3.6% | 0.0% | 0.0% | 13.6% |
| 1922 | 82.7% | 3.8% | 1.1% | 1.4% | 11.0% |
| 1927 | 77.7% | 7.7% | 1.1% | 1.5% | 11.9% |
| 1932 | 72.8% | 12.2% | 1.2% | 1.3% | 12.5% |
| 1934 | 68.9% | 17.1% | 1.4% | 0.8% | 11.8% |
| 1936 | 61.1% | 22.1% | 2.3% | 1.7% | 12.8% |
| 1938 | 58.4% | 23.6% | 2.9% | 2.2% | 13.0% |
| 1940 | 56.7% | 25.4% | 2.9% | 2.0% | 13.0% |
| 1944 | 52.5% | 26.1% | 3.9% | 5.1% | 12.4% |
| 1946 | 49.4% | 29.6% | 4.2% | 4.4% | 12.4% |
| 1948 | 45.9% | 33.3% | 4.1% | 4.4% | 12.3% |
| 1950 | 46.2% | 32.4% | 5.0% | 3.7% | 12.8% |
| 1952 | 44.8% | 32.9% | 5.2% | 4.4% | 12.8% |
| 1954 | 45.2% | 33.0% | 5.1% | 3.5% | 13.2% |
| 1955 | 45.7% | 32.5% | 5.3% | 3.2% | 13.3% |
| 1956 | 44.6% | 33.0% | 5.8% | 3.4% | 13.3% |
| 1957 | 44.6% | 32.9% | 6.1% | 3.4% | 13.0% |
| 1962 | 45.9% | 32.5% | 7.3% | 3.1% | 11.2% |
| 1967 | 42.7% | 33.7% | 9.6% | 3.7% | 10.4% |
| 1972 | 39.1% | 34.2% | 13.9% | 4.0% | 8.7% |
| 1977 | 35.5% | 34.5% | 16.6% | 5.2% | 8.2% |
| 1978 | 34.3% | 34.9% | 17.1% | 5.5% | 8.1% |
| 1979 | 31.6% | 36.1% | 18.0% | 5.9% | 8.4% |
| 1980 | 30.7% | 35.8% | 18.8% | 6.0% | 8.8% |
| 1981 | 30.7% | 35.2% | 19.0% | 5.8% | 9.4% |
| 1982 | 30.8% | 35.1% | 19.0% | 5.6% | 9.4% |
| 1983 | 31.3% | 35.2% | 19.4% | 5.0% | 9.0% |
| 1984 | 30.1% | 35.6% | 20.3% | 5.2% | 8.7% |
| 1985 | 29.6% | 36.1% | 20.1% | 5.5% | 8.8% |
| 1986 | 29.9% | 36.2% | 19.9% | 5.4% | 8.6% |
| 1987 | 29.9% | 35.6% | 20.7% | 5.5% | 8.2% |
| 1988 | 30.3% | 35.9% | 20.3% | 5.4% | 8.0% |
| 1989 | 30.4% | 35.5% | 20.9% | 5.5% | 7.8% |
| 1990 | 31.0% | 35.5% | 21.1% | 4.7% | 7.8% |
| 1991 | 32.0% | 35.3% | 20.8% | 4.2% | 7.7% |
| 1992 | 32.2% | 35.3% | 20.7% | 4.3% | 7.6% |
| 1993 | 31.9% | 35.3% | 20.7% | 4.4% | 7.6% |
| 1994 | 31.5% | 35.8% | 20.6% | 4.5% | 7.6% |
| 1995 | 30.8% | 35.9% | 20.9% | 4.8% | 7.6% |
| 1996 | 30.4% | 36.1% | 21.3% | 4.6% | 7.5% |
| 1997 | 30.0% | 35.9% | 21.8% | 4.6% | 7.6% |
| 1998 | 29.7% | 35.5% | 22.7% | 4.4% | 7.6% |
| 1999 | 29.4% | 35.7% | 23.2% | 4.2% | 7.5% |
| 2000 | 28.6% | 35.5% | 24.3% | 4.1% | 7.6% |
| 2001 | 28.8% | 35.0% | 24.8% | 3.9% | 7.5% |
| 2002 | 30.8% | 35.8% | 22.4% | 3.1% | 7.8% |
| 2003 | 31.6% | 36.0% | 21.2% | 3.3% | 7.9% |
| 2004 | 31.5% | 35.7% | 21.3% | 3.3% | 8.2% |
| 2005 | 30.6% | 35.0% | 22.1% | 3.9% | 8.5% |
| 2006 | 30.2% | 34.6% | 22.3% | 4.4% | 8.4% |
| 2007 | 30.3% | 34.3% | 22.6% | 4.7% | 8.1% |
| 2008 | 30.8% | 33.8% | 22.9% | 4.3% | 8.1% |
| 2009 | 33.8% | 33.9% | 21.2% | 3.6% | 7.5% |
| 2010 | 34.8% | 34.0% | 20.5% | 3.4% | 7.4% |
| 2011 | 33.2% | 34.5% | 21.2% | 3.6% | 7.5% |
| 2012 | 32.2% | 34.4% | 22.2% | 3.5% | 7.8% |
| 2013 | 31.2% | 34.1% | 23.3% | 3.6% | 7.7% |
| 2014 | 31.3% | 34.7% | 22.9% | 3.7% | 7.5% |
| 2015 | 31.0% | 34.8% | 23.6% | 3.7% | 7.0% |
| 2016 | 31.5% | 34.9% | 23.4% | 3.3% | 6.8% |
| 2017 | 31.7% | 35.1% | 23.2% | 3.2% | 6.9% |
| 2018 | 30.9% | 34.8% | 24.2% | 3.2% | 6.8% |
| 2019 | 31.0% | 34.5% | 24.0% | 3.6% | 6.9% |
| 2020 | 32.2% | 35.0% | 22.8% | 3.3% | 6.7% |
| Note: Due to historical data limitations, sales, excise, and gross receipts taxes are combined in this table. Excise taxes are classified as “other taxes” elsewhere in this paper.
Source: U.S. Census Bureau; Tax Foundation calculations. |
|||||
| Region | States |
|---|---|
| New England | Conn., Maine, Mass., N.H., R.I., Vt. |
| Mideast | D.C., Del., Md., N.J., N.Y., Pa. |
| Great Lakes | Ill., Ind., Mich., Ohio, Wis. |
| Plains | Iowa, Kans., Minn., Mo., N.D., Nebr., S.D. |
| Southeast | Ala., Ark., Fla., Ga., Ky., La., Miss., N.C., S.C., Tenn., Va., W.Va. |
| Southwest | Ariz., N.M., Okla., Tex. |
| Rocky Mountain | Colo., Idaho, Mont., Utah, Wyo. |
| Far West | Alaska, Calif., Hawaii, Nev., Ore., Wash. |
| Source: Bureau of Economic Analysis. | |
| State | Name of GRT | GRT Revenue Generated (FY 2020) |
|---|---|---|
| Delaware | Gross Receipts Tax | $253,800,000 |
| Nevada | Commerce Tax | $206,609,000 |
| Ohio | Commercial Activity Tax (CAT) | $1,671,700,000 |
| Oregon | Corporate Activity Tax (CAT) | $419,200,000 |
| Tennessee | Business Tax | $387,246,000 |
| Texas | Margin Tax | $3,055,377,000 |
| Washington | Business and Occupation (B&O) Tax | $4,633,201,000 |
| Source: State revenue departments. | ||
[1] 36 M.R.S.A. § 4303, imposed at a rate of 1.5 cents per pound of wild blueberries processed in the state or shipped out of state.
[2] Ala. Const., amend. 351, to be optionally levied at a rate of one mill, with revenues dedicated to the control of “mosquitoes, rodents and other vectors of public health and welfare significance.” At 310,296 words, the Alabama State Constitution is 44 times longer than the U.S. Constitution.
[3] U.S. Census Bureau, State and Local Government Finances (FY 2020), https://www.census.gov/data/datasets/2020/econ/local/public-use-datasets.html, and Tax Foundation calculations. All reliance statistics in this paper are Tax Foundation calculations from fiscal year 2020 Census data.
[4] The first year for which data are available. By 1922, property taxes had slipped to 36.7 percent of total state collections, and they accounted for less than 6 percent by the end of World War II.
[5] Garrett Watson, “States Should Continue to Reform Taxes on Tangible Personal Property,” Tax Foundation, Aug. 6, 2019, https://www.taxfoundation.org/tangible-personal-property-tax/.
[6] Joan Youngman, A Good Tax: Legal and Policy Issues for the Property Tax in the United States (Cambridge, MA: Lincoln Institute of Land Policy) 2016, 13-15.
[7] Jens Arnold, Bert Brys, Christopher Heady, Åsa Johansson, Cyrille Schwellnus, & Laura Vartia, “Tax Policy For Economic Recovery and Growth,” 121 Economic Journal F59-F80, 2011.
[8] Id., 91 et. seq. and 193 et seq.
[9] See generally, Jared Walczak, Katherine Loughead, Ulrik Boesen, and Janelle Fritts, Location Matters 2021: The State Tax Costs of Doing Business. Tax Foundation, 2021, https://www.taxfoundation.org/publications/location-matters/.
[10] Less than half of collections in the District of Columbia come from property tax collections as well, but as the federal district, its tax revenues represent a hybrid of state and local taxation.
[11] Regional classifications of states follow the Bureau of Economic Analysis’s classification system. See Table 11.
[12] See, e.g., Thomas Stratmann and William Bruntrager, “Excise Taxes in the States,” Mercatus Center Working Paper No. 11-27, June 2011, https://www.mercatus.org/system/files/ExciseTaxesintheStates.Stratmann.Bruntrager_0.pdf.
[13] See generally, Justin Ross, “Gross Receipts Taxes: Theory and Recent Evidence,” Tax Foundation Fiscal Fact No. 529, Oct. 6, 2016, https://www.taxfoundation.org/gross-receipts-taxes-theory-and-recent-evidence/.
[14] Timothy Vermeer and Katherine Loughead, “State Individual Income Tax Rates and Brackets for 2022,” Tax foundation, Feb. 15, 2022, https://www.taxfoundation.org/publications/state-individual-income-tax-rates-and-brackets/.
[15] Janelle Fritts, “State Corporate Income Tax Rates and Brackets for 2022,” Tax Foundation, Jan. 18, 2022, https://www.taxfoundation.org/publications/state-corporate-income-tax-rates-and-brackets/.
[16] Janelle Fritts, “State and Local Sales Tax Rates, Midyear 2022,” Tax Foundation, July 19, 2022, https://www.taxfoundation.org/publications/state-and-local-sales-tax-rates/.
[17] William McBride, “What Is the Evidence on Taxes and Growth?” Tax Foundation Special Report No. 207, Dec. 18, 2012, https://taxfoundation.org/what-evidence-taxes-and-growth/, 4.
[18] Jared Walczak, “Local Income Taxes in 2019,” Tax Foundation, July 30, 2019, https://www.taxfoundation.org/local-income-taxes-2019/.
[19] Id.
[20] Localities in Kentucky generate 26.2 percent of their local tax revenue from individual income taxes, and Ohio municipalities collect 22.1 percent that way. The District of Columbia’s tax system, which includes many of the standard features of both state and local systems, derives 28.5 percent of its tax revenue from individual income taxation.
[21] William McBride, “What Is the Evidence on Taxes and Growth?” 4.
[22] Internal Revenue Service, “Migration Data 2011-2020,” https://www.irs.gov/statistics/soi-tax-stats-migration-data.
[23] William McBride, “What Is the Evidence on Taxes and Growth?” 5.
[24] Jared Walczak, Katherine Loughead, Ulrik Boesen, and Janelle Fritts, Location Matters 2021: The State Tax Costs of Doing Business.
[25] Former Secretary of the Treasury William E. Simon, qtd., Blueprints for Basic Tax Reform, Department of the Treasury, Jan. 17, 1977, https://www.treasury.gov/resource-center/tax-policy/Documents/Report-Blueprints-1977.pdf, 2.
Share