Note: The following was written testimony presented before the Indiana State and Local Tax Review Task Force. Download the full testimony and presentation slides above.
Chairman Holdman and Members of the State and Local TaxA tax is a mandatory payment or charge collected by local, state, and national governments from individuals or businesses to cover the costs of general government services, goods, and activities. Review Task Force:
Thank you for the opportunity to present before the Task Force today to discuss various aspects of Indiana’s tax structure and opportunities to further improve the state’s tax competitiveness. We are Andrey Yushkov and Katherine Loughead, Senior Policy Analysts at the Tax Foundation, where we specialize in state tax policy.
The Tax Foundation is a nonprofit, nonpartisan tax policy research organization that has advanced sound tax policy at the state, federal, and international levels for over 85 years. Our team engages with tax policy issues in all 50 states, and you may be familiar with two of our most popular annual publications, Facts and Figures and the State Business Tax Climate Index.
To provide a bit of background about us personally, Andrey recently earned his PhD in public policy from Indiana University, and Katherine earned her undergraduate degree at Indiana Wesleyan University. We greatly appreciate this opportunity to come back to Indianapolis to participate in this important conversation about Indiana’s tax structure and further opportunities for improvement, especially given Indiana’s strong track record as a leader in pro-growth tax reform over the past couple of decades.
Today, we will walk through each of Indiana’s major tax revenue sources, identifying where the state is highly competitive and where there is room for further improvement.
We believe state tax codes should be simple, transparent, and neutral while generating a stable source of revenue; the recommendations we offer today will be in line with those four key principles of sound tax policy.
Indiana’s Current Tax Landscape
We would like to begin our presentation today with an overview of Indiana’s current tax landscape. Indiana’s tax system is already highly competitive nationally. On our 2023 State Business Tax Climate Index, a study that evaluates the competitiveness of states’ tax structures across more than 120 tax policy variables, Indiana ranks 9th overall and has the highest ranking among its geographic neighbors. Notably, Indiana has maintained a competitive ranking of either 9th or 10th on the Index for the past 10 years.[1] The Hoosier State performs well on the Index because it has one of the most efficient property taxA property tax is primarily levied on immovable property like land and buildings, as well as on tangible personal property that is movable, like vehicles and equipment. Property taxes are the single largest source of state and local revenue in the U.S. and help fund schools, roads, police, and other services. systems in the nation and also has relatively well-structured individual and corporate income taxes, with rates lower than any of its neighboring states.[2] Among Indiana’s neighbors, Michigan and Kentucky are its closest competitors on the Index, ranking 12th and 18th, respectively.
Sources of State and Local Tax Revenue
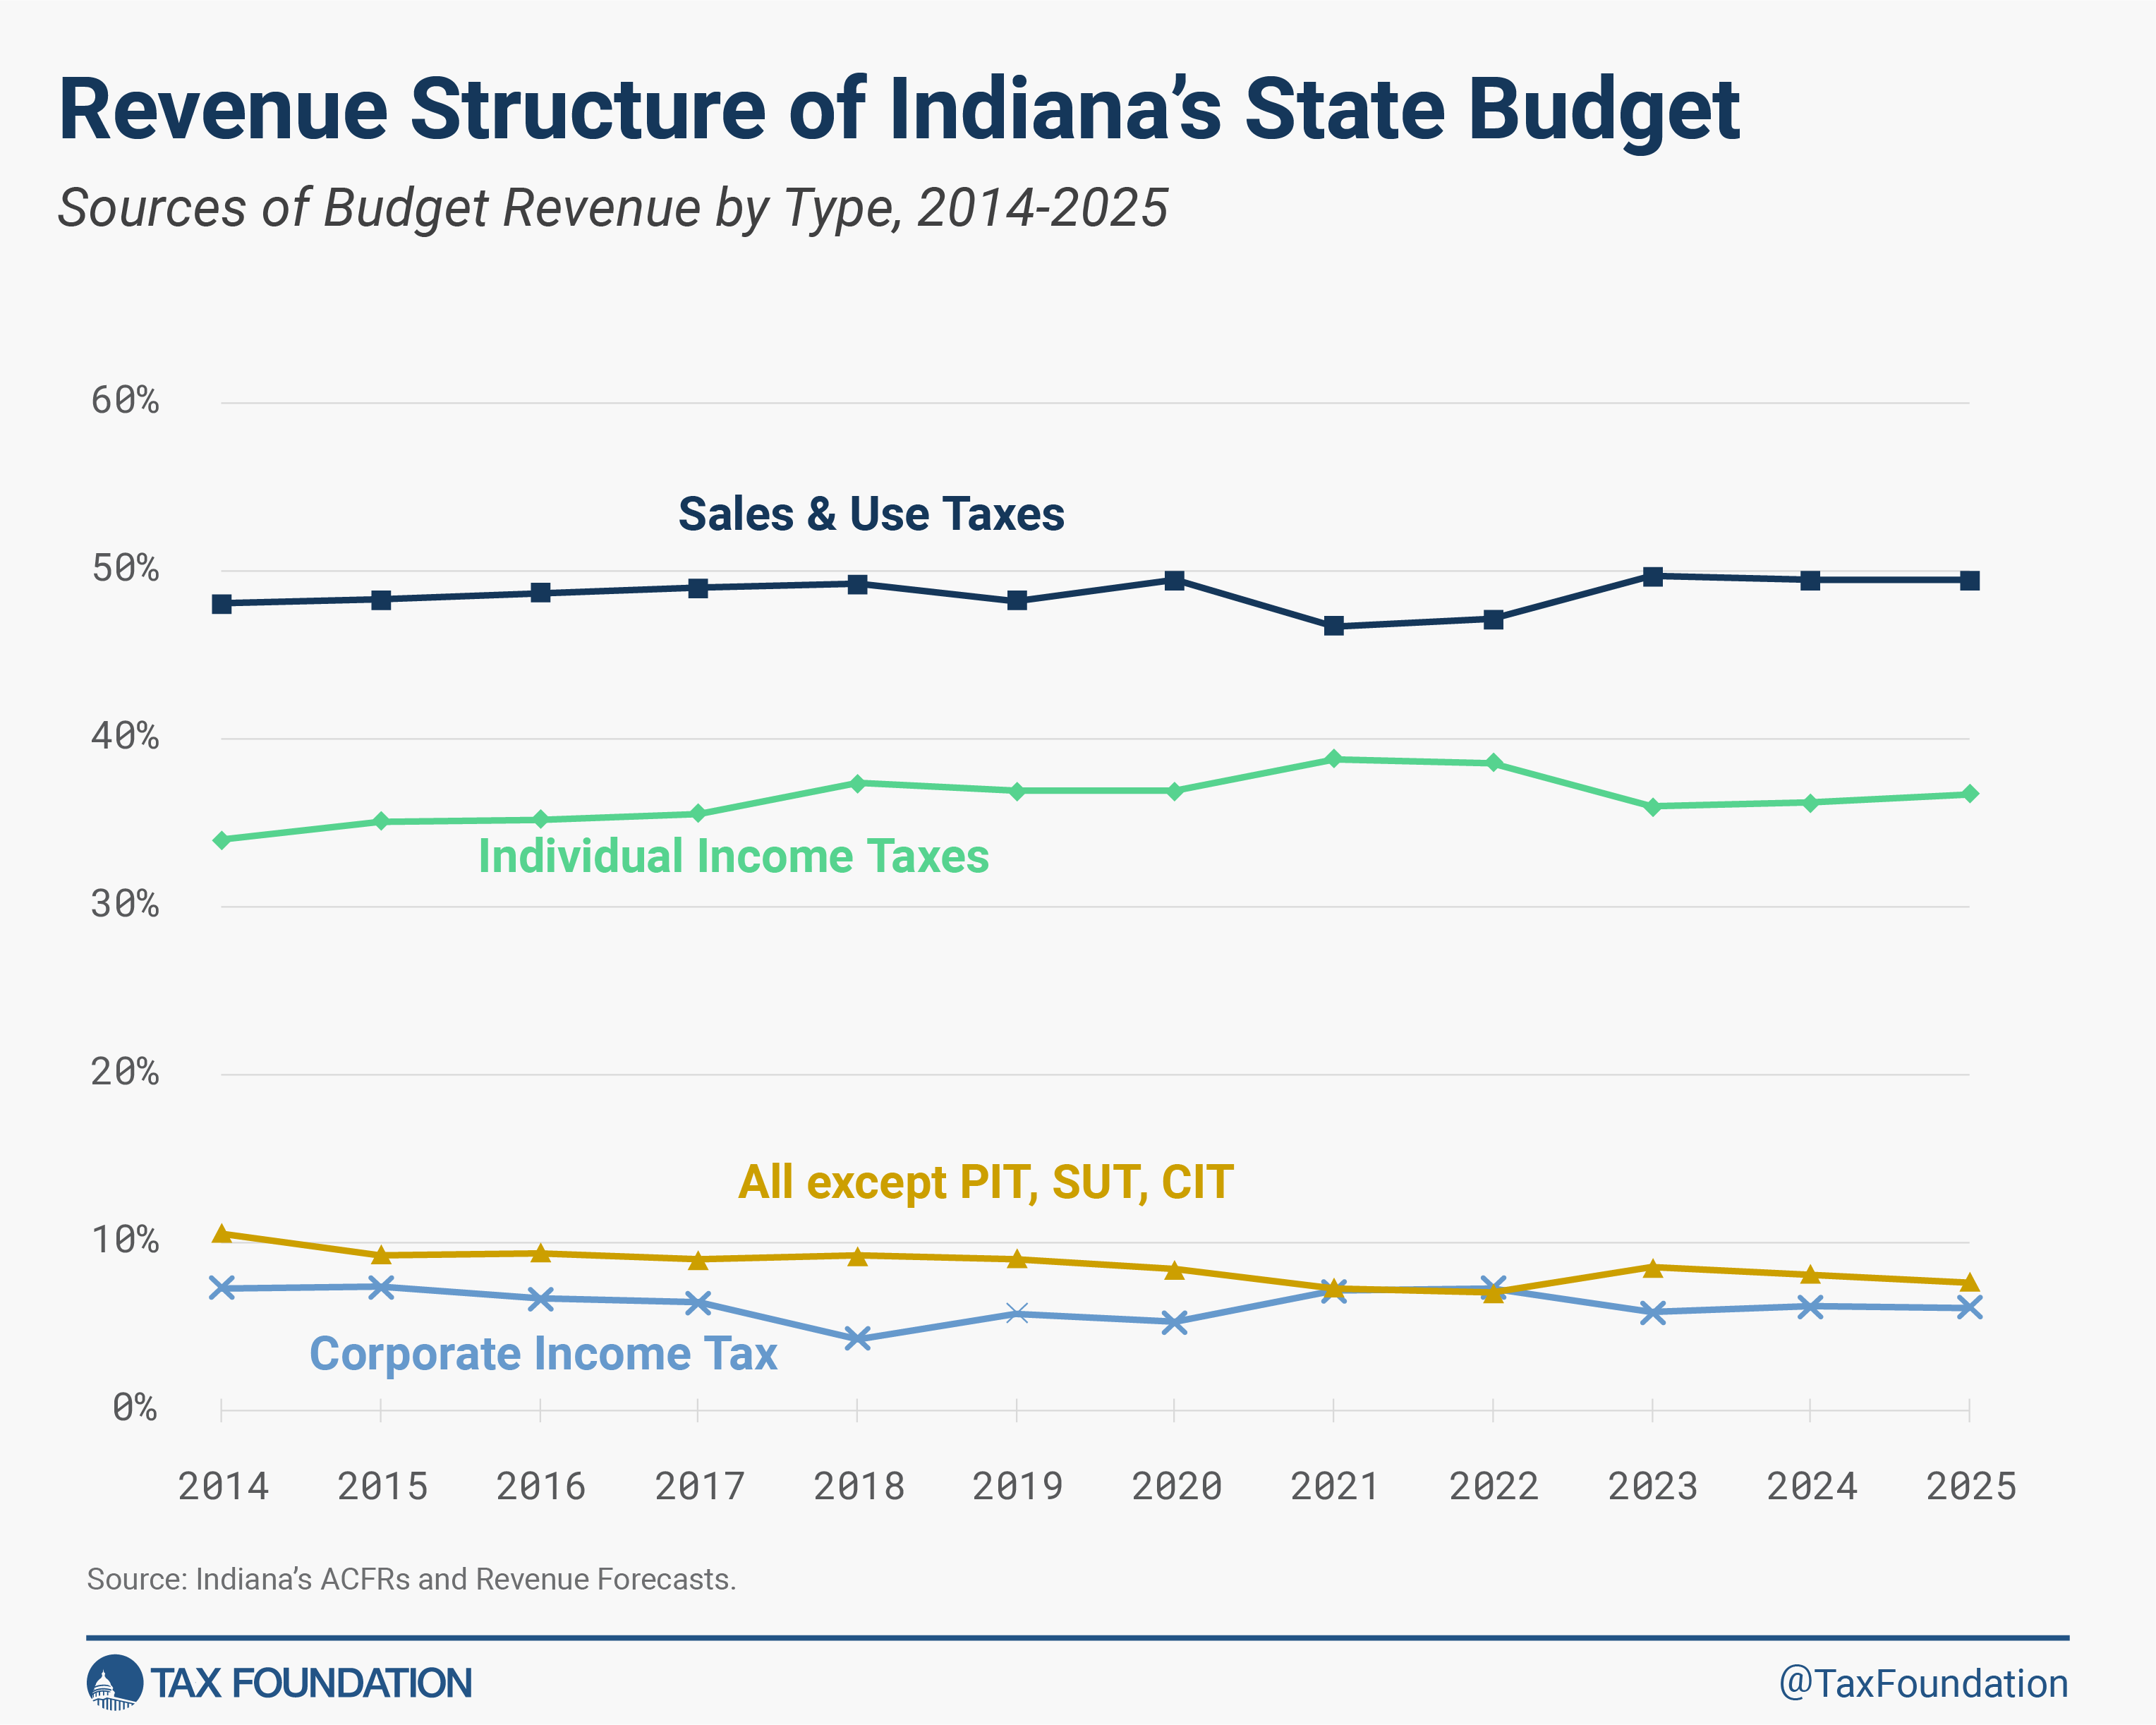
American federalism allows states to structure their tax codes in a variety of ways. Some states depend almost exclusively on income taxes, while others rely more on sales and use taxes. Indiana’s revenue structure has been stable during the last decade. From 2014 to 2023, the sales and use tax accounted for about 50 percent of general fund revenues, while the share of the individual income taxAn individual income tax (or personal income tax) is levied on the wages, salaries, investments, or other forms of income an individual or household earns. The U.S. imposes a progressive income tax where rates increase with income. The Federal Income Tax was established in 1913 with the ratification of the 16th Amendment. Though barely 100 years old, individual income taxes are the largest source of tax revenue in the U.S. fluctuated between 34 and 38 percent. All other sources of revenue were relatively insignificant compared to these two major taxes. The corporate income taxA corporate income tax (CIT) is levied by federal and state governments on business profits. Many companies are not subject to the CIT because they are taxed as pass-through businesses, with income reportable under the individual income tax. was the most volatile source of revenue, fluctuating between 5 and 7 percent of general fund revenues. The share of all other taxes, including wagering taxes and excise taxes on gasoline and cigarettes, accounted for less than 10 percent of the general fund.
While a comprehensive discussion of the merits of different sources of tax revenue is beyond the scope of this testimony, we would like to highlight the major advantages and disadvantages of income taxes and sales and use taxes. Some economists argue that income taxes (when only wages are taxed) and consumption taxes are theoretically equivalent.[3] However, there is little disagreement that the practical implications of income and consumption taxes differ considerably.
Both individual income taxes and sales taxes have broad and easily defined tax bases and represent major sources of state and local revenue. However, individual income taxes are typically not limited to wages, which implies that they can disincentivize saving and investing. While income taxes are easily adjustable to various individual and family characteristics (e.g., number of dependents, total family earnings, etc.), these adjustments in the form of exemptions and tax credits typically add to the complexity of the tax system and may lead to the problem of horizontal inequity. Thus, individual income taxes in practice often violate the principles of simplicity and neutrality.
Corporate income taxes are even more problematic since they are typically volatile (with tax revenues declining during periods of economic shock), nonneutral and harmful for businesses, and, in a competitive federalist context, lead to ubiquitous tax avoidance and evasion. Sales and use taxes, when designed correctly, are less distortive than income taxes.[4] In most cases, they only tax current consumption and thus incentivize labor, savings, and future consumption. However, the design of sales and use taxes is critically important. For instance, if business inputs are included in the sales taxA sales tax is levied on retail sales of goods and services and, ideally, should apply to all final consumption with few exemptions. Many governments exempt goods like groceries; base broadening, such as including groceries, could keep rates lower. A sales tax should exempt business-to-business transactions which, when taxed, cause tax pyramiding. base, this may lead to tax pyramidingTax pyramiding occurs when the same final good or service is taxed multiple times along the production process. This yields vastly different effective tax rates depending on the length of the supply chain and disproportionately harms low-margin firms. Gross receipts taxes are a prime example of tax pyramiding in action. . Also, if only goods are taxed, while services are tax-exempt, this leads to the erosion of the sales tax baseThe tax base is the total amount of income, property, assets, consumption, transactions, or other economic activity subject to taxation by a tax authority. A narrow tax base is non-neutral and inefficient. A broad tax base reduces tax administration costs and allows more revenue to be raised at lower rates. and the need to increase tax rates in the long run.
Why Tax Reform?
As Indiana already scores high in national rankings, the natural question for Hoosiers may be: “Why do we need to change our tax system at all?” There are several reasons, but the first and most important is that the state and local tax landscape is rapidly changing and becoming increasingly competitive, and states that stand still risk falling behind.
The Tax Reform Landscape Has Grown Highly Competitive
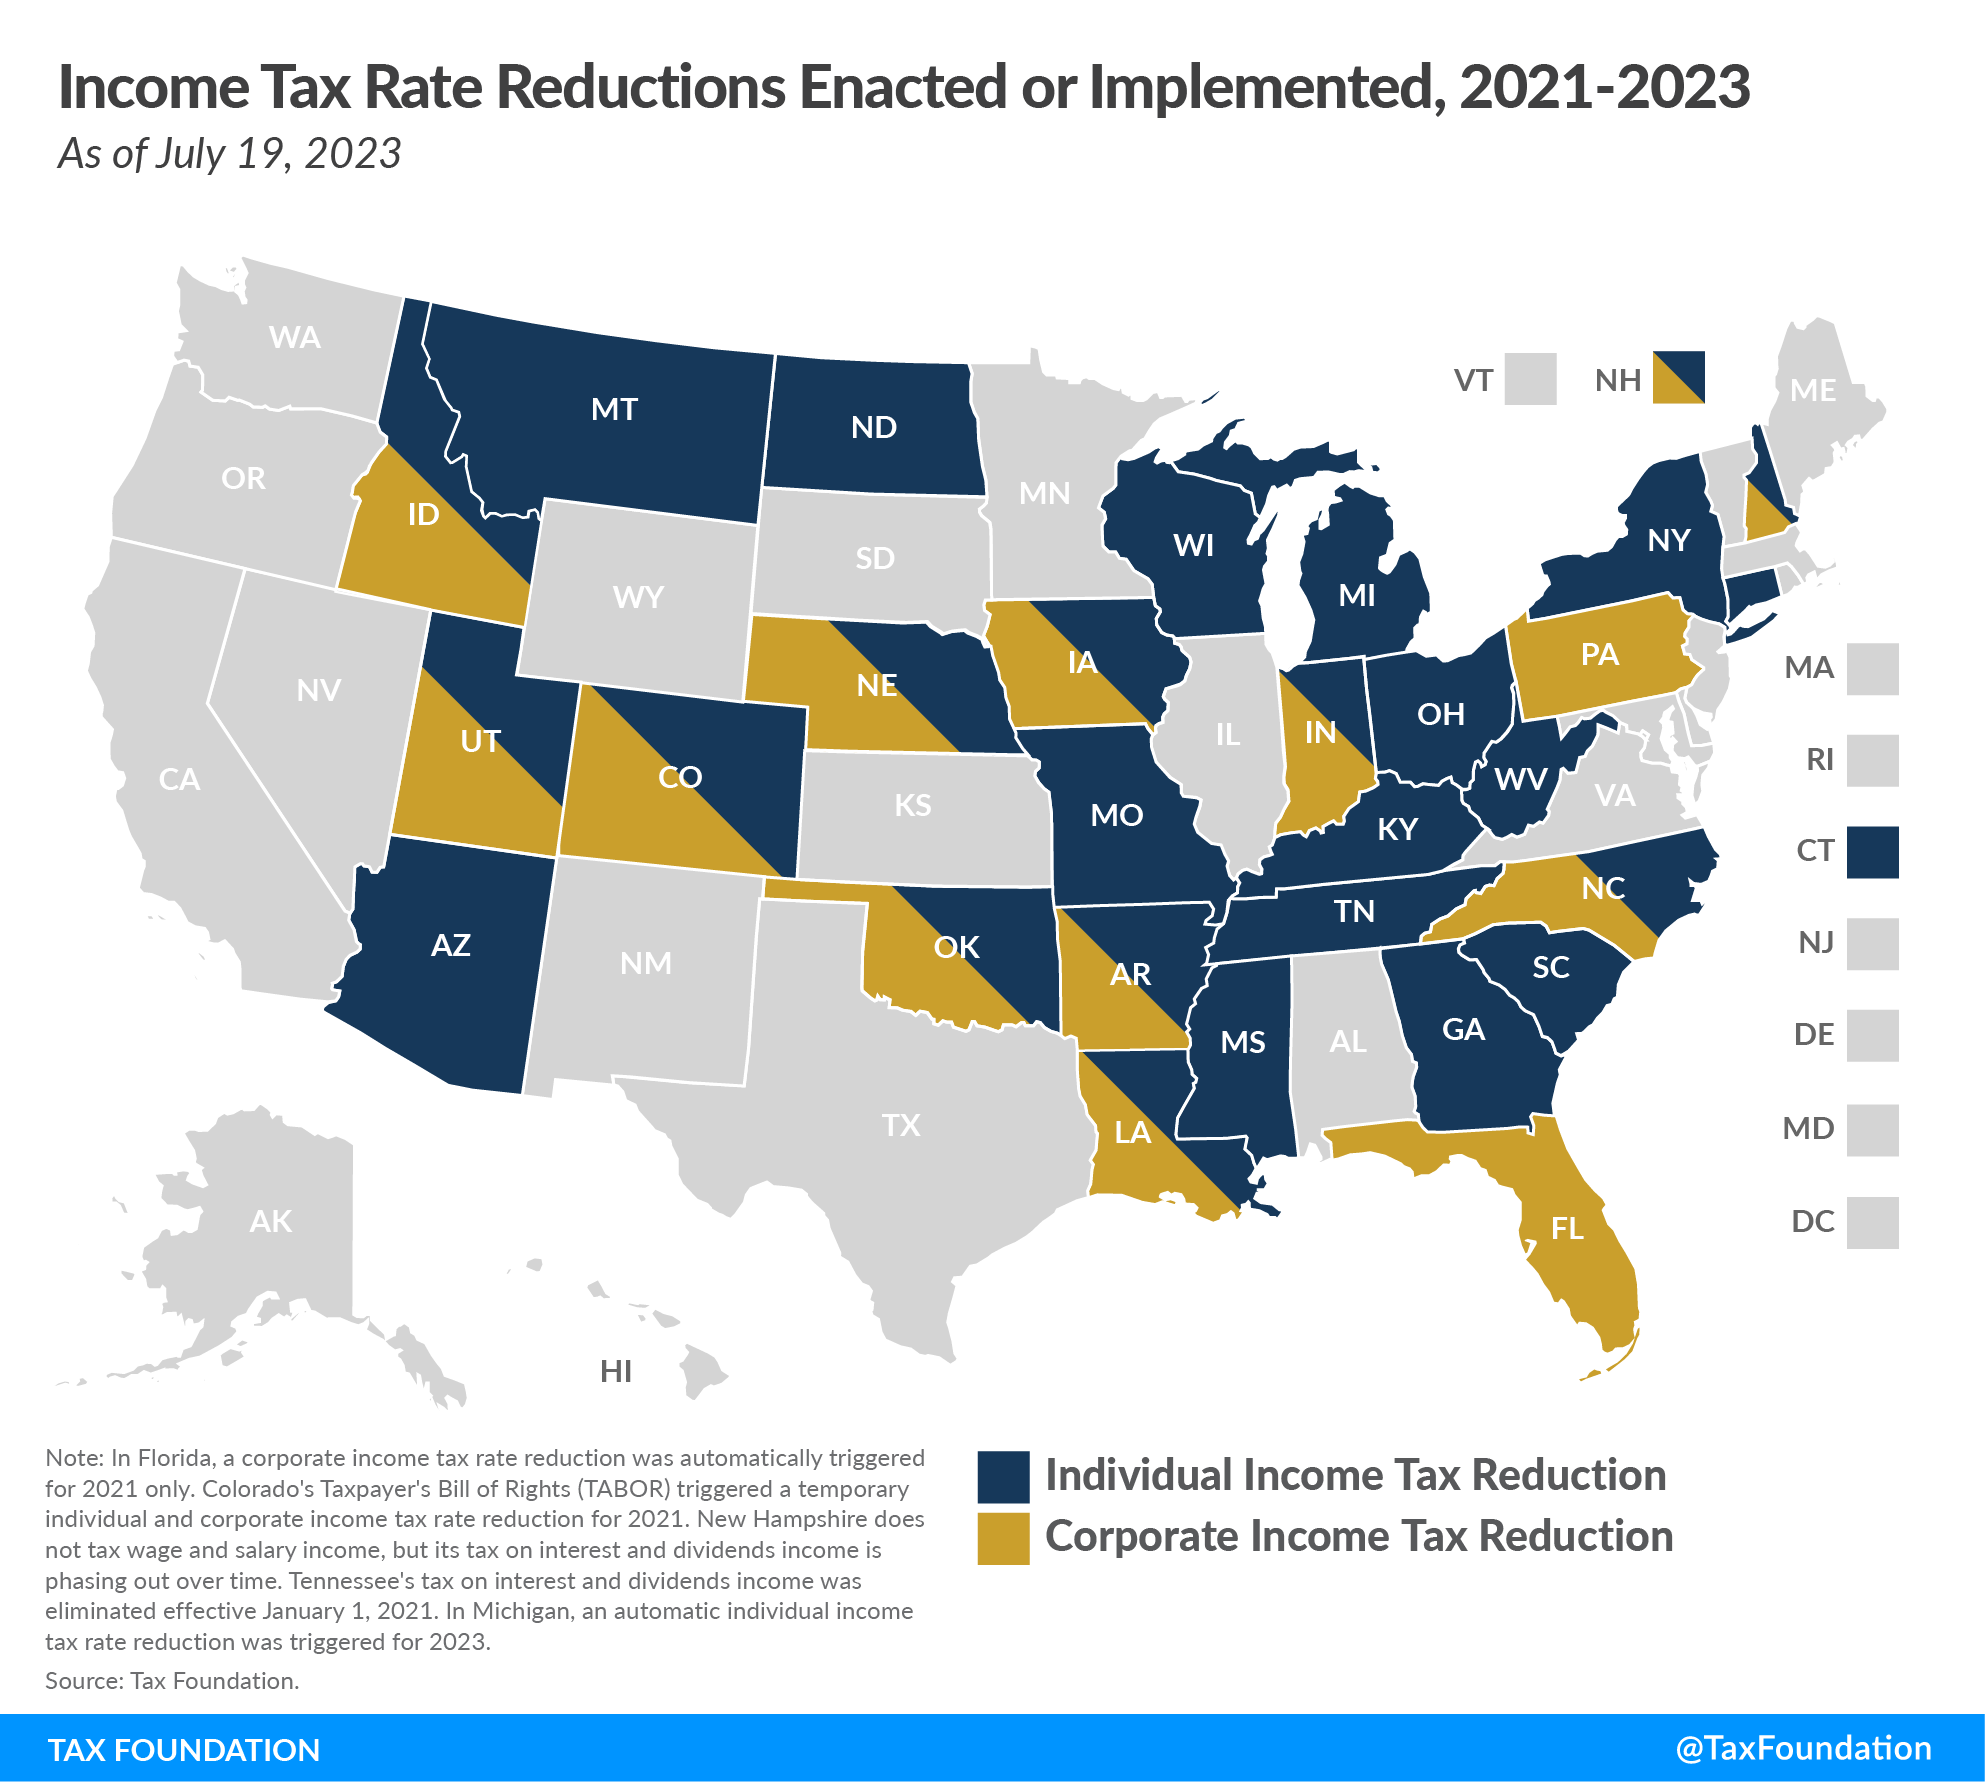
Between 2021 and 2023, 26 states reduced their individual income tax rates, with many of these states reducing their rates more than once, including Indiana, which enacted income tax cuts both in 2022 and earlier this year. Two of the other tax-cutting states, Arizona and North Dakota, have rates lower than Indiana’s, with Arizona at a flat rate of 2.5 percent and North Dakota with a top marginal rate of 2.9 percent that is scheduled to drop to 2.5 percent in 2024. Many of these states are on their way to reducing tax rates even further, sometimes unconditionally, and sometimes subject to tax triggers that are contingent upon revenue availability. Indiana’s recent progress to make its individual income tax rate more competitive is laudable, but each of Indiana’s regional competitors besides Illinois has also reduced income tax rates in the past few years, so this is no time for Indiana to rest on its laurels.
In addition to the 26 states that reduced individual income tax rates between 2021 and 2023, 13 states cut corporate income tax rates, and two states (New Mexico and South Dakota) reduced their sales and use tax rates. Many other states have made structural improvements to their tax codes, including newly offering full expensingFull expensing allows businesses to immediately deduct the full cost of certain investments in new or improved technology, equipment, or buildings. It alleviates a bias in the tax code and incentivizes companies to invest more, which, in the long run, raises worker productivity, boosts wages, and creates more jobs. for machinery and equipment investments, eliminating throwback and throwout rules from their corporate income tax systems, raising nonresident income tax filing and withholdingWithholding is the income an employer takes out of an employee’s paycheck and remits to the federal, state, and/or local government. It is calculated based on the amount of income earned, the taxpayer’s filing status, the number of allowances claimed, and any additional amount of the employee requests. thresholds to adapt to an increasingly mobile economy, reducing reliance on capital stock taxes and tangible personal property taxes, and broadening the sales tax to apply to historically untaxed consumer services—which enhances neutrality and can help pay down more pro-growth reforms elsewhere.
Americans Are Moving from High- to Low-Tax States
Additionally, there is an important recent migration trend that carries implications for tax reform: Americans are increasingly moving from high- to low-tax states, especially states with low income taxes (or that forgo an individual income tax entirely).[5] Florida and Texas, states that do not tax wage income, consistently rank among the top states in terms of GDP growth, population growth, and adjusted gross incomeFor individuals, gross income is the total pre-tax earnings from wages, tips, investments, interest, and other forms of income and is also referred to as “gross pay.” For businesses, gross income is total revenue minus cost of goods sold and is also known as “gross profit” or “gross margin.” (AGI) growth. Additionally, states with high top marginal rates consistently lose residents, on net, to states with low top marginal individual income tax rates, a flat taxAn income tax is referred to as a “flat tax” when all taxable income is subject to the same tax rate, regardless of income level or assets. , or no income tax.
Notably, this trend has implications for Indiana as well. As demonstrated in Table 1, Indiana has positive net migration (meaning inbound migration is greater than outbound migration) with Illinois, Kentucky, Ohio, and California, but Indiana has negative net migration with Florida, Arizona, Texas, and Michigan, states that all either have no individual income tax or levy a flat income tax at a low rate. Although many factors affect relocation decisions (e.g., job market, weather, housing availability, cost of living), taxes clearly play an important role: the average all-inclusive tax burden in the former states is 11.50 percent, while the average tax burden in the latter states is 8.95 percent, more than 2.5 percentage points lower.[6] As of 2022, Indiana’s tax burden was 9.3 percent, slightly higher than in Florida, Michigan, and Texas, but still allowing Indiana to have the 14th-lowest state and local effective tax rate in the nation.
Table 1. Interstate Migration into and out of Indiana, 2021
| State | Inbound Migration to Indiana | Outbound Migration from Indiana | Net Migration |
|---|---|---|---|
| Illinois | 37,764 | 18,681 | 19,083 |
| Kentucky | 13,369 | 11,437 | 1,932 |
| Ohio | 12,606 | 8,028 | 4,578 |
| Michigan | 10,586 | 11,998 | -1,412 |
| Florida | 10,336 | 17,980 | -7,644 |
| Texas | 6,591 | 10,573 | -3,982 |
| California | 5,705 | 3,889 | 1,816 |
| Arizona | 1,433 | 6,093 | -4,660 |
| Total (from all states) | 156,417 | 145,489 | 10,928 |
Source: State-to-State Migration Flows, 2021 American Community Survey, https://www.census.gov/data/tables/time-series/demo/geographic-mobility/state-to-state-migration.html.
To remain competitive in an increasingly mobile economy, states should consider how various provisions in their tax code either attract or deter individuals and businesses. In the time we have remaining, we will discuss Indiana’s individual income, corporate income, sales, and property tax structures, highlighting both what Indiana is doing well and where there is room for improvement. If Indiana wants to maintain its efficient tax system and continue to improve its tax competitiveness both nationally and internationally, several additional pro-growth reforms are worth considering.
Indiana’s Individual Income Tax Structure
Indiana is currently one of 11 states with a single-rate individual income tax structure, commonly known as a “flat tax.” With a flat rate of 3.15 percent, Indiana has one of the lowest rates among the states that tax wage and salary income. However, other states are growing increasingly competitive by lowering rates and consolidating brackets. In fact, more states enacted laws to convert from a graduated-rate tax structure to a flat individual income tax structure in 2021 and 2022 alone than did so in the entire 109-year history of state income taxation up until that point. Specifically, Arizona, Idaho, and Mississippi implemented flat taxes this year, and Georgia is on track to do so in 2024, followed by Iowa in 2026. The idea of moving to a flat tax has also been a topic of serious deliberation in Kansas, North Dakota, Missouri, Ohio, and Oklahoma.
States with individual income tax rates more competitive than Indiana’s include Arizona, North Dakota, and Pennsylvania. Arizona enacted sweeping tax reforms in 2021 that converted a graduated-rate tax structure into a flat tax rate of 2.5 percent, and reforms enacted in North Dakota this year will bring the 2.9 percent top marginal rate to 2.5 percent in 2024. Additionally, Pennsylvania’s flat tax rate has remained at 3.07 percent for quite some time. It is also important to keep in mind that nine states, including Florida, Texas, and Tennessee, are more competitive than Indiana since they do not tax wage or salary income at all.
Despite having a low, flat rate, Indiana’s individual income tax has some structural shortcomings that impede competitiveness and prevent the state from ranking higher on our Index. Most notably, Indiana allows local governments to impose their own income taxes and is among the six states where local income taxes are a significant source of local tax revenue.[7]
Compared to alternative revenue sources, like real property taxes and sales taxes, local income taxes are generally more complex to administer and comply with, more economically harmful, and generate a less stable source of revenue. While Indiana’s local income taxes are more streamlined than in many other states since they are administered at the state level, the lack of rate uniformity creates complexity and can lead to economic distortions when individuals and businesses move or adjust their decision-making to avoid higher taxes in certain counties. Local income taxes also present an additional administrative burden for nonresidents who earn income in Indiana and therefore have to pay taxes to both the state and county.
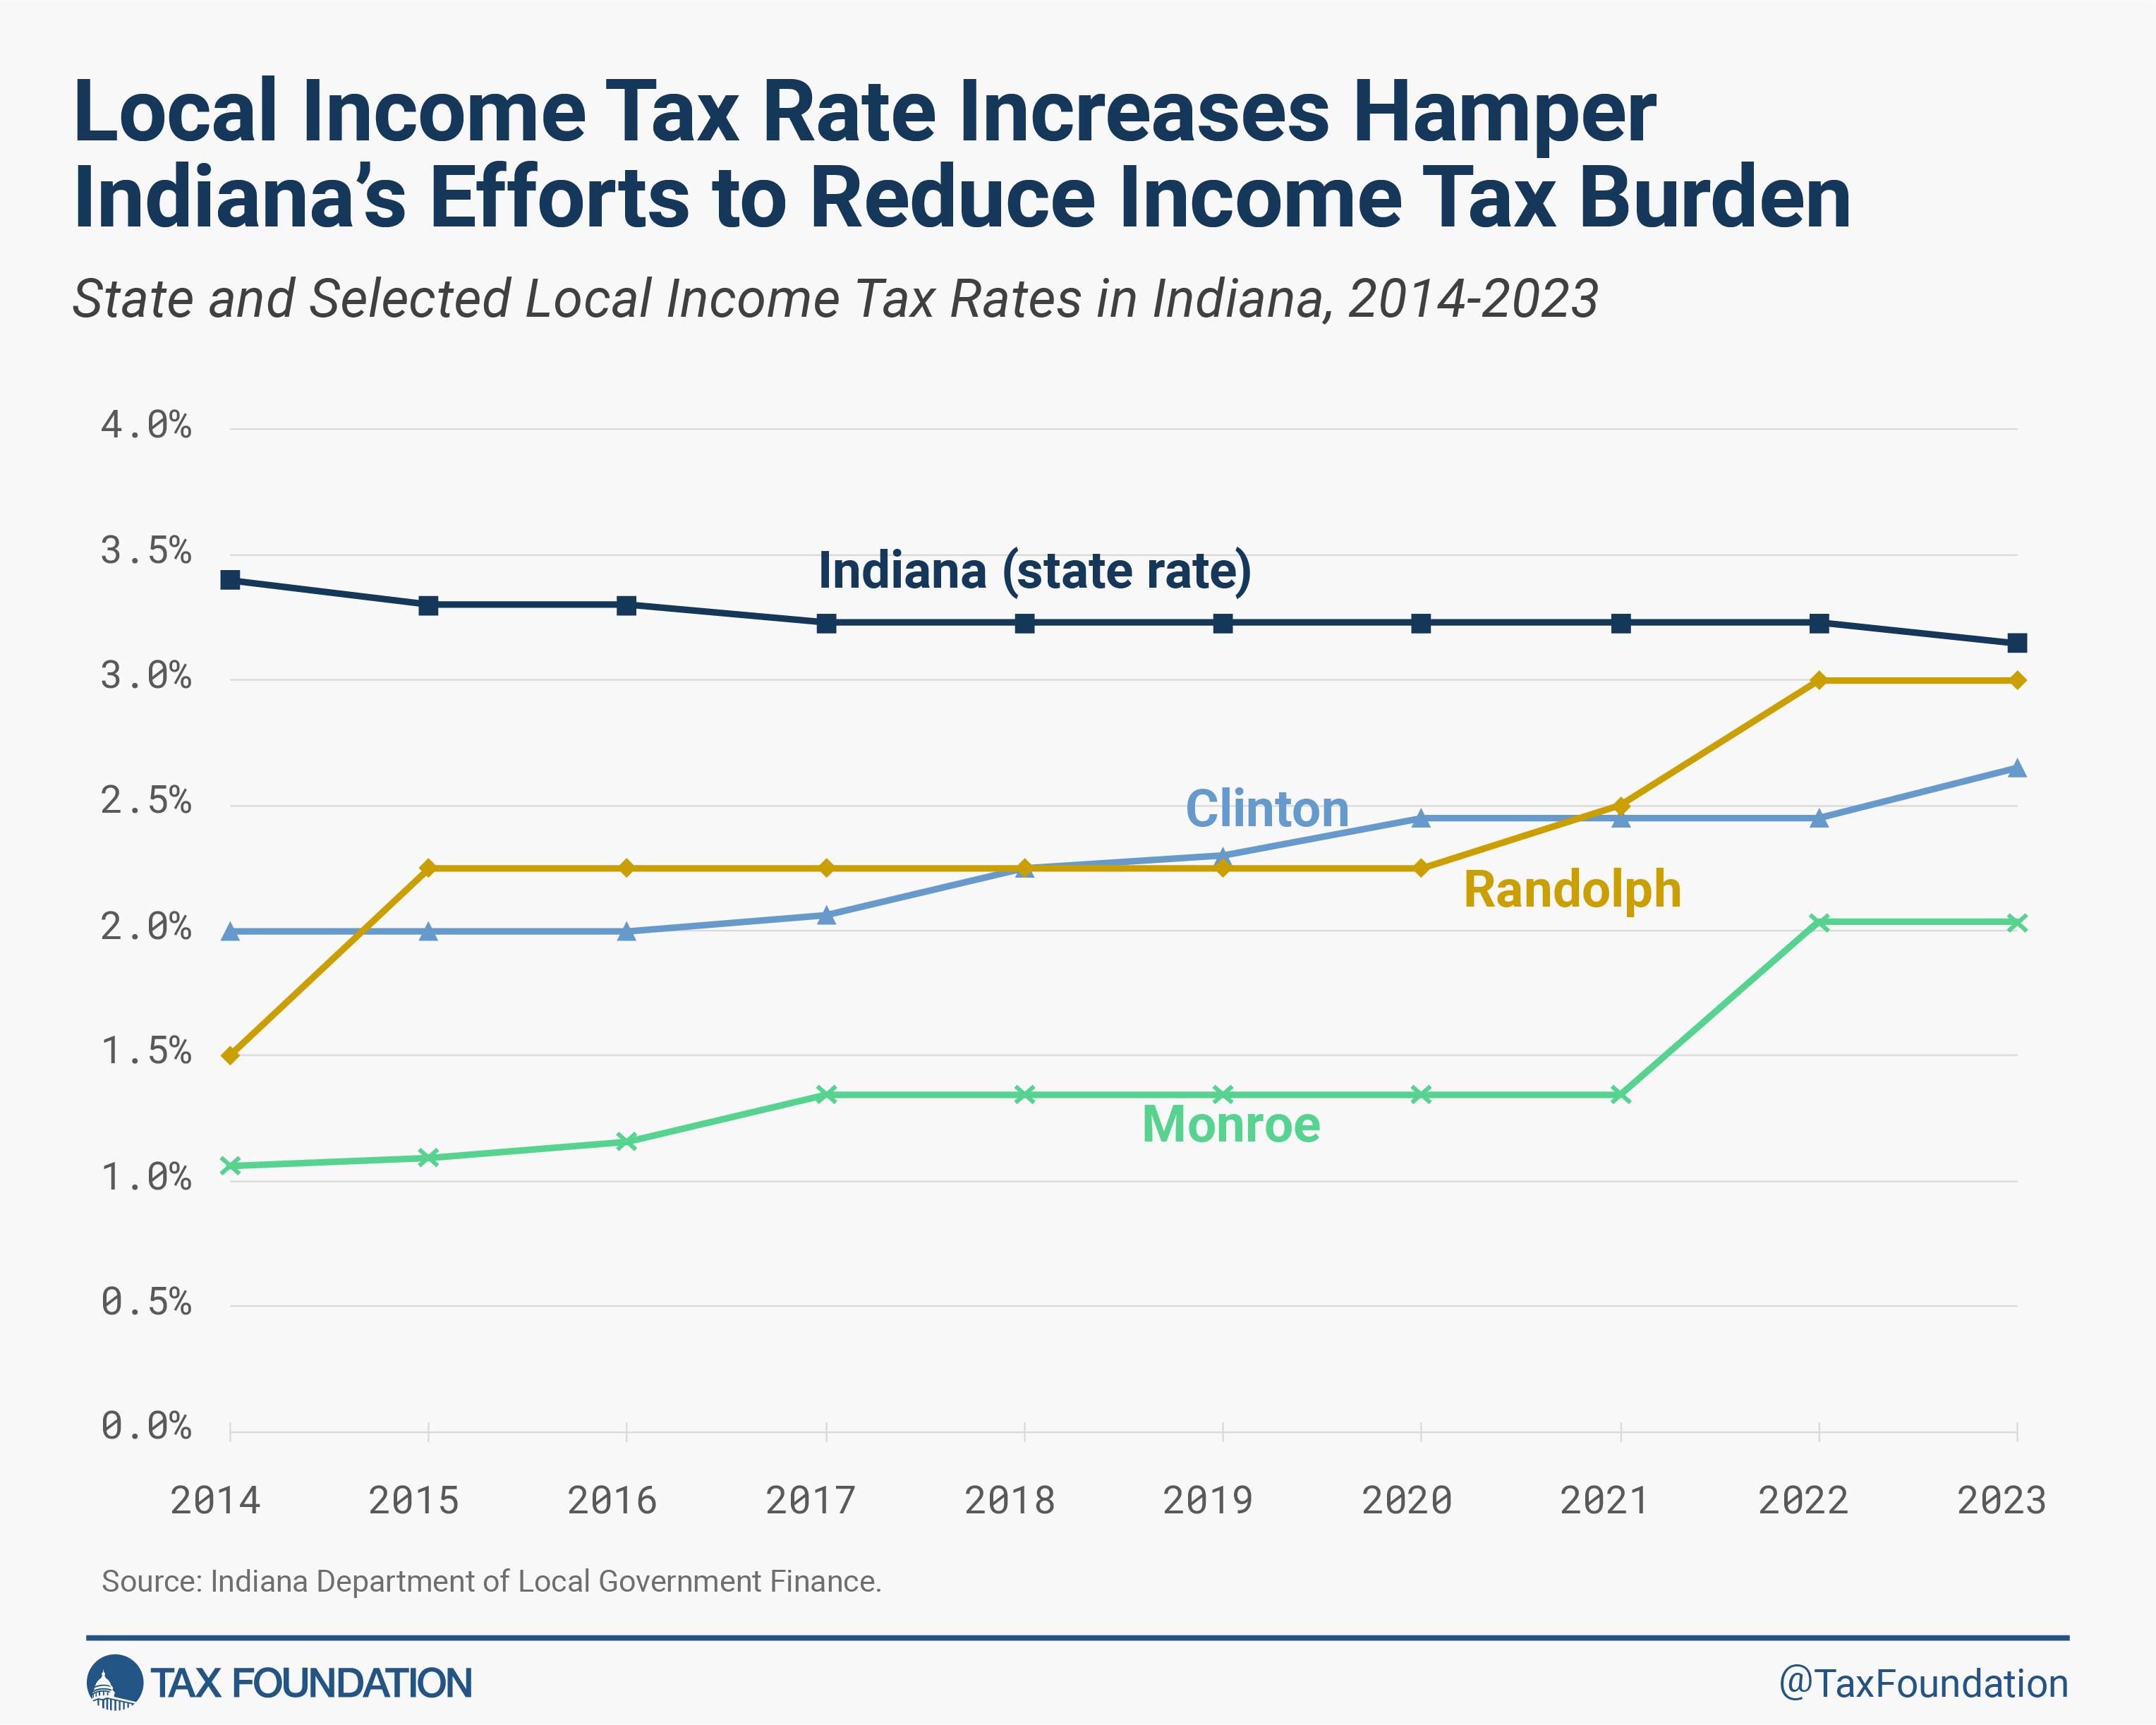
Currently, local income tax rates in Indiana range from 0.5 percent in Porter County to 3 percent in Randolph County.[8] In recent years, offsetting a steady decline in the state’s individual income tax rate, several counties have dramatically increased their local income tax rates. In particular, between 2014 and 2023, local tax rates increased from 1.5 to 3 percent in Randolph County, from 2 to 2.65 percent in Clinton County, and from 1.06 to 2.04 percent in Monroe County. As a result, in most counties, the combined state and local individual income tax burden has not decreased despite Indiana’s recent and ongoing state income tax rate reductions.
In fact, a median-income household in Randolph County faces a higher effective state and local income tax rate than its counterparts in Georgia or North Carolina where state income tax rates are much higher than in Indiana. Local governments should be wary of high local income taxes: the economic literature provides some evidence that high-income individuals are sensitive to changes in local income tax rates and are more likely to relocate to another locality when their tax burden increases.
Second, Indiana has a relatively low personal exemption of $1,000 per taxpayer, spouse, and dependent, and this personal exemption is not indexed to inflationInflation is when the general price of goods and services increases across the economy, reducing the purchasing power of a currency and the value of certain assets. The same paycheck covers less goods, services, and bills. It is sometimes referred to as a “hidden tax,” as it leaves taxpayers less well-off due to higher costs and “bracket creep,” while increasing the government’s spending power. . While keeping deductions, exemptions, and tax credits at low levels (or avoiding them altogether) helps promote simplicity and neutrality, Indiana’s personal exemption is lower than the combined standard deductionThe standard deduction reduces a taxpayer’s taxable income by a set amount determined by the government. It was nearly doubled for all classes of filers by the 2017 Tax Cuts and Jobs Act (TCJA) as an incentive for taxpayers not to itemize deductions when filing their federal income taxes. and personal exemption in all neighboring and most comparable states (slightly lower than in Illinois and Kentucky, and significantly lower than in Michigan, Georgia, and Arizona).[10] If Indiana policymakers decide to gradually reduce reliance on income taxes while increasing reliance on consumption taxes, modestly increasing the personal exemption is one way to do so without increasing the tax burden on lower-income individuals.
Individual Income Tax Reform Solutions
Indiana is currently on track to further reduce its individual income tax rate to 3.05 percent in 2024, 3 percent in 2025, 2.95 percent in 2026, and 2.9 percent in 2027 and beyond. This is a reasonable path forward to continue improving Indiana’s income tax competitiveness. However, if Indiana policymakers wish to continue reducing the individual income tax rate in the future, offsetting reforms elsewhere in the tax code may become necessary, such as applying the sales tax to certain consumer goods and services that are currently exempt. Alternatively, well-designed tax triggers could be used to reduce income tax rates further over time whenever actual tax collections exceed certain specific inflation-adjusted targets.[11]
While phasing out the state individual income tax over many years may be a worthwhile goal for policymakers to set their sights on, such a change is highly unlikely to occur successfully in the near term. Many states have significantly lowered income tax rates or transitioned to a flat income tax in recent years, but most of these changes have been incremental, not abrupt. In fact, no state has ever phased out a broad-based tax on wage and salary income. Alaska is the only state to have ever repealed its individual income tax, doing so in 1980 during the oil boom that enabled the state to substantially increase reliance on severance taxes to offset the elimination of the individual income tax.
Additionally, Alaska relied less on individual income taxes as a source of state government revenue than Indiana currently does. Before its repeal, Alaska’s individual income tax generated approximately one-quarter of the state’s tax collections. By contrast, in fiscal year 2021, individual income taxes generated approximately 39.7 percent of Indiana’s state tax collections and 12.2 percent of Indiana’s local tax collections. The share of Indiana’s general fund revenue generated by the state individual income tax has not fallen below 35 percent since 2015.
Without a major reform of the sales tax (e.g., sales tax base broadeningBase broadening is the expansion of the amount of economic activity subject to tax, usually by eliminating exemptions, exclusions, deductions, credits, and other preferences. Narrow tax bases are non-neutral, favoring one product or industry over another, and can undermine revenue stability. ), replacing this significant revenue source would be nearly impossible to do in a short period of time without increasing reliance on even more economically harmful taxes, which would defeat the purpose of eliminating the individual income tax in the first place. Most states that forgo individual income taxes have higher sales tax rates and broader sales tax bases than Indiana.[12]
Another policy solution that could make Indiana’s income tax system more competitive nationally is to reform local income taxes by imposing a tighter limit on maximum statutory income tax rates. Under current law, counties may enact a general local income tax rate up to 2.5 percent (2.75 percent in Marion County), and counties may additionally enact a rate of 1.25 percent for property tax relief purposes, for a combined maximum local rate of 3.75 percent.[13] Additionally, certain counties may levy a special purpose local income tax for certain specified purposes.
A maximum local rate of 3.75 percent is notably permissive, especially given that the maximum rate is substantially higher than the rates most counties currently levy, and higher than the state rate. Policymakers should consider tightening this cap to prevent local governments from simply offsetting any state income tax rate reductions with corresponding increases in local income tax rates. For taxpayers, continued local income tax rate increases could mean no real reduction in their state and local income tax liability. For the state, this would mean its efforts to increase competitiveness through state income tax rate reductions could be thwarted.
A second option is to consider replacing local income taxes with a local option sales tax. This option requires further detailed discussion beyond the scope of this testimony, but localities in many comparable states, including Illinois, Tennessee, Georgia, Arizona, North Carolina, Oklahoma, and Nebraska, rely on local option sales taxes but forgo local income taxes. Generally, well-designed consumption taxes generate fewer economic distortions than income taxes since they do not affect saving and investment decisions and only tax current consumption. They are also easier to administer and less likely to affect individuals’ and businesses’ location decisions.
Indiana’s Corporate Income Tax Structure
Indiana’s flat 4.9 percent corporate income tax is already one of the lowest in the nation. The state is highly competitive among its Midwestern neighbors: Illinois, Michigan, and Kentucky have higher corporate income tax rates than Indiana (9.5 percent, 6 percent, and 5 percent, respectively), while Ohio imposes a harmful gross receipts taxA gross receipts tax, also known as a turnover tax, is applied to a company’s gross sales, without deductions for a firm’s business expenses, like costs of goods sold and compensation. Unlike a sales tax, a gross receipts tax is assessed on businesses and apply to business-to-business transactions in addition to final consumer purchases, leading to tax pyramiding. that is burdensome to businesses with high revenues but low profit margins.
Indiana also uses a single sales factor apportionmentApportionment is the determination of the percentage of a business’ profits subject to a given jurisdiction’s corporate income or other business taxes. U.S. states apportion business profits based on some combination of the percentage of company property, payroll, and sales located within their borders. formula and, unlike Illinois, Wisconsin, and Kansas, does not impose an economically inefficient throwback rule. Throwback rules overtax corporate income and make states less attractive to in-state businesses.
Corporate Income Tax Reform Solutions
Although Indiana has the lowest corporate income tax rate among its neighbors following a decade of rate reductions between 2012 and 2021, several competing states have implemented major corporate tax reforms in recent years and have lower rates than Indiana, including North Carolina (2.5 percent), Oklahoma (4 percent), and Utah (4.65 percent). In order to remain competitive nationally and attract new businesses to the state, Indiana policymakers should consider incrementally reducing the corporate income tax rate further.
Another highly worthwhile reform to consider is to adopt a bonus depreciationBonus depreciation allows firms to deduct a larger portion of certain “short-lived” investments in new or improved technology, equipment, or buildings in the first year. Allowing businesses to write off more investments partially alleviates a bias in the tax code and incentivizes companies to invest more, which, in the long run, raises worker productivity, boosts wages, and creates more jobs. allowance for businesses’ machinery and equipment investments, allowing businesses to deduct most or all of the costs of those investments in the year those expenses are incurred. Currently, Indiana is an outlier in that the state does not offer any sort of bonus depreciationDepreciation is a measurement of the “useful life” of a business asset, such as machinery or a factory, to determine the multiyear period over which the cost of that asset can be deducted from taxable income. Instead of allowing businesses to deduct the cost of investments immediately (i.e., full expensing), depreciation requires deductions to be taken over time, reducing their value and discouraging investment. allowance similar to the federal bonus depreciation allowance offered under IRC Section 168(k).
Under the 2017 federal tax reform law, until 2023, businesses could deduct 100 percent of the costs of qualifying investments in the year those expenses were incurred. However, this provision is now phasing out, with only 80 percent bonus depreciation allowed in 2023, 60 percent in 2024, and so on, until bonus depreciation ends entirely in 2027. Given the ongoing phaseout of the federal provision, Oklahoma and Mississippi are now offering a permanent full expensing allowance of their own, and other states are likely to follow suit. Adopting such a measure would make Indiana more attractive as a destination for business investment and boost productivity and the state’s future economic growth prospects. While Indiana does offer a limited expensing provision for small businesses in partial conformity with IRC Section 179, Indiana’s $25,000 expensing allowance is substantially lower than the $1 million federal allowance that most other states conform to, so Indiana’s Section 179 allowance is another area for potential improvement.
Indiana’s Sales and Use Tax Structure
When discussing sales and use taxes, it is important to consider both rates and bases as well as both the state and local levies. When only state sales tax rates are compared, Indiana is tied with Mississippi, Rhode Island, and Tennessee for the second-highest sales tax rate in the nation (7 percent), lower only than California (7.25 percent). However, since Indiana currently does not authorize its localities to impose local option sales taxes, Indiana’s combined state and average local sales tax rate is much more competitive, with Indiana tied with Mississippi for the 25th-highest combined state and average local sales tax rate in the nation.
As of fiscal year 2021, Indiana’s sales tax breadth[14] was 38 percent,[15] with a base broader than many neighboring states but significantly narrower than an ideal sales tax system where all final personal consumption is taxed.
In Indiana, groceries and many personal services are exempt from the sales tax. Typically, some argue that exempting groceries and other necessities from the sales tax reduces tax regressivity. However, as pointed out by the late Professor John Mikesell of Indiana University, the downside of “household consumption exemptions is that they provide relief for each purchaser regardless of income level. As a result, a vast amount of tax relief goes to the affluent, thus creating considerable revenue loss without gaining any socially desirable effect.”[16]
Our research supports this claim and shows that, given states’ existing sales tax exemptions for purchases made with SNAP and WIC benefits, the poorest decile of households experiences approximately 9 percent more sales tax liability with a sales tax exemptionA tax exemption excludes certain income, revenue, or even taxpayers from tax altogether. For example, nonprofits that fulfill certain requirements are granted tax-exempt status by the Internal Revenue Service (IRS), preventing them from having to pay income tax. for groceries than they would if groceries were taxed and the general sales tax rate were reduced commensurately.[17]
A relatively narrow tax base almost always drives tax rates up in the long run. As services, most of which are tax-exempt, have grown considerably as a share of personal consumption expenditures (from less than 40 percent in the early 1950s to more than 65 percent in the 2020s),[18] the sales tax base has become narrower in almost every state.[19] As a result, the statutory median sales tax rate across the United States increased from 3 percent in the 1970s to 6 percent in the 2010s. Indiana followed the same trend: the sales tax rate increased from 2 percent in 1963-1973 to 5 percent in 1983-2002 to 7 percent from 2008 onward.[20] To prevent further increases in statutory sales tax rates, states, including Indiana, should consider broadening their sales tax bases to additional forms of final personal consumption, including both goods and services. In any base-broadening effort, policymakers should be careful to avoid exposing additional business inputs to the sales tax, as this causes tax pyramiding, where sales taxes on business inputs are passed along to consumers in the form of higher prices for goods and services sold, and then the retail sales tax is levied on top of that embedded tax.
Sales and Use Taxes Reform Solutions
If Indiana policymakers wish to broaden the sales tax base to offset tax reductions elsewhere in the tax code, there are a variety of goods and services to which the sales tax could be newly applied.
For example, applying the sales tax to groceries would increase the sales tax base by about $20 billion, meaning sales tax collections would increase by about $1.4 billion a year if the current 7 percent rate were applied to groceries and about $800 million a year if a preferential sales tax rate of 4 percent rate were applied.[21] If the state provided a grocery tax creditA tax credit is a provision that reduces a taxpayer’s final tax bill, dollar-for-dollar. A tax credit differs from deductions and exemptions, which reduce taxable income, rather than the taxpayer’s tax bill directly. of $100 per taxpayer with adjusted gross income of $50,000 or less, this would only reduce the potential revenue gain by about $230 million.[22]
Additionally, if the state chooses to include some personal services in the tax base, sales tax collections will increase, enabling Indiana to either lower the sales tax rate or continue lowering the individual income tax rate at an accelerated pace. For instance, including recreational services such as membership fees in private clubs, sport centers, theaters, and museums ($2.3 billion) and personal care and clothing services ($1.7 billion) could increase the sales tax base by about $4 billion, meaning sales tax collections would increase by approximately $280 million a year. Including additional personal services such as audio-video services and some professional services (that are not business inputs) in the tax base can increase tax collections even further.
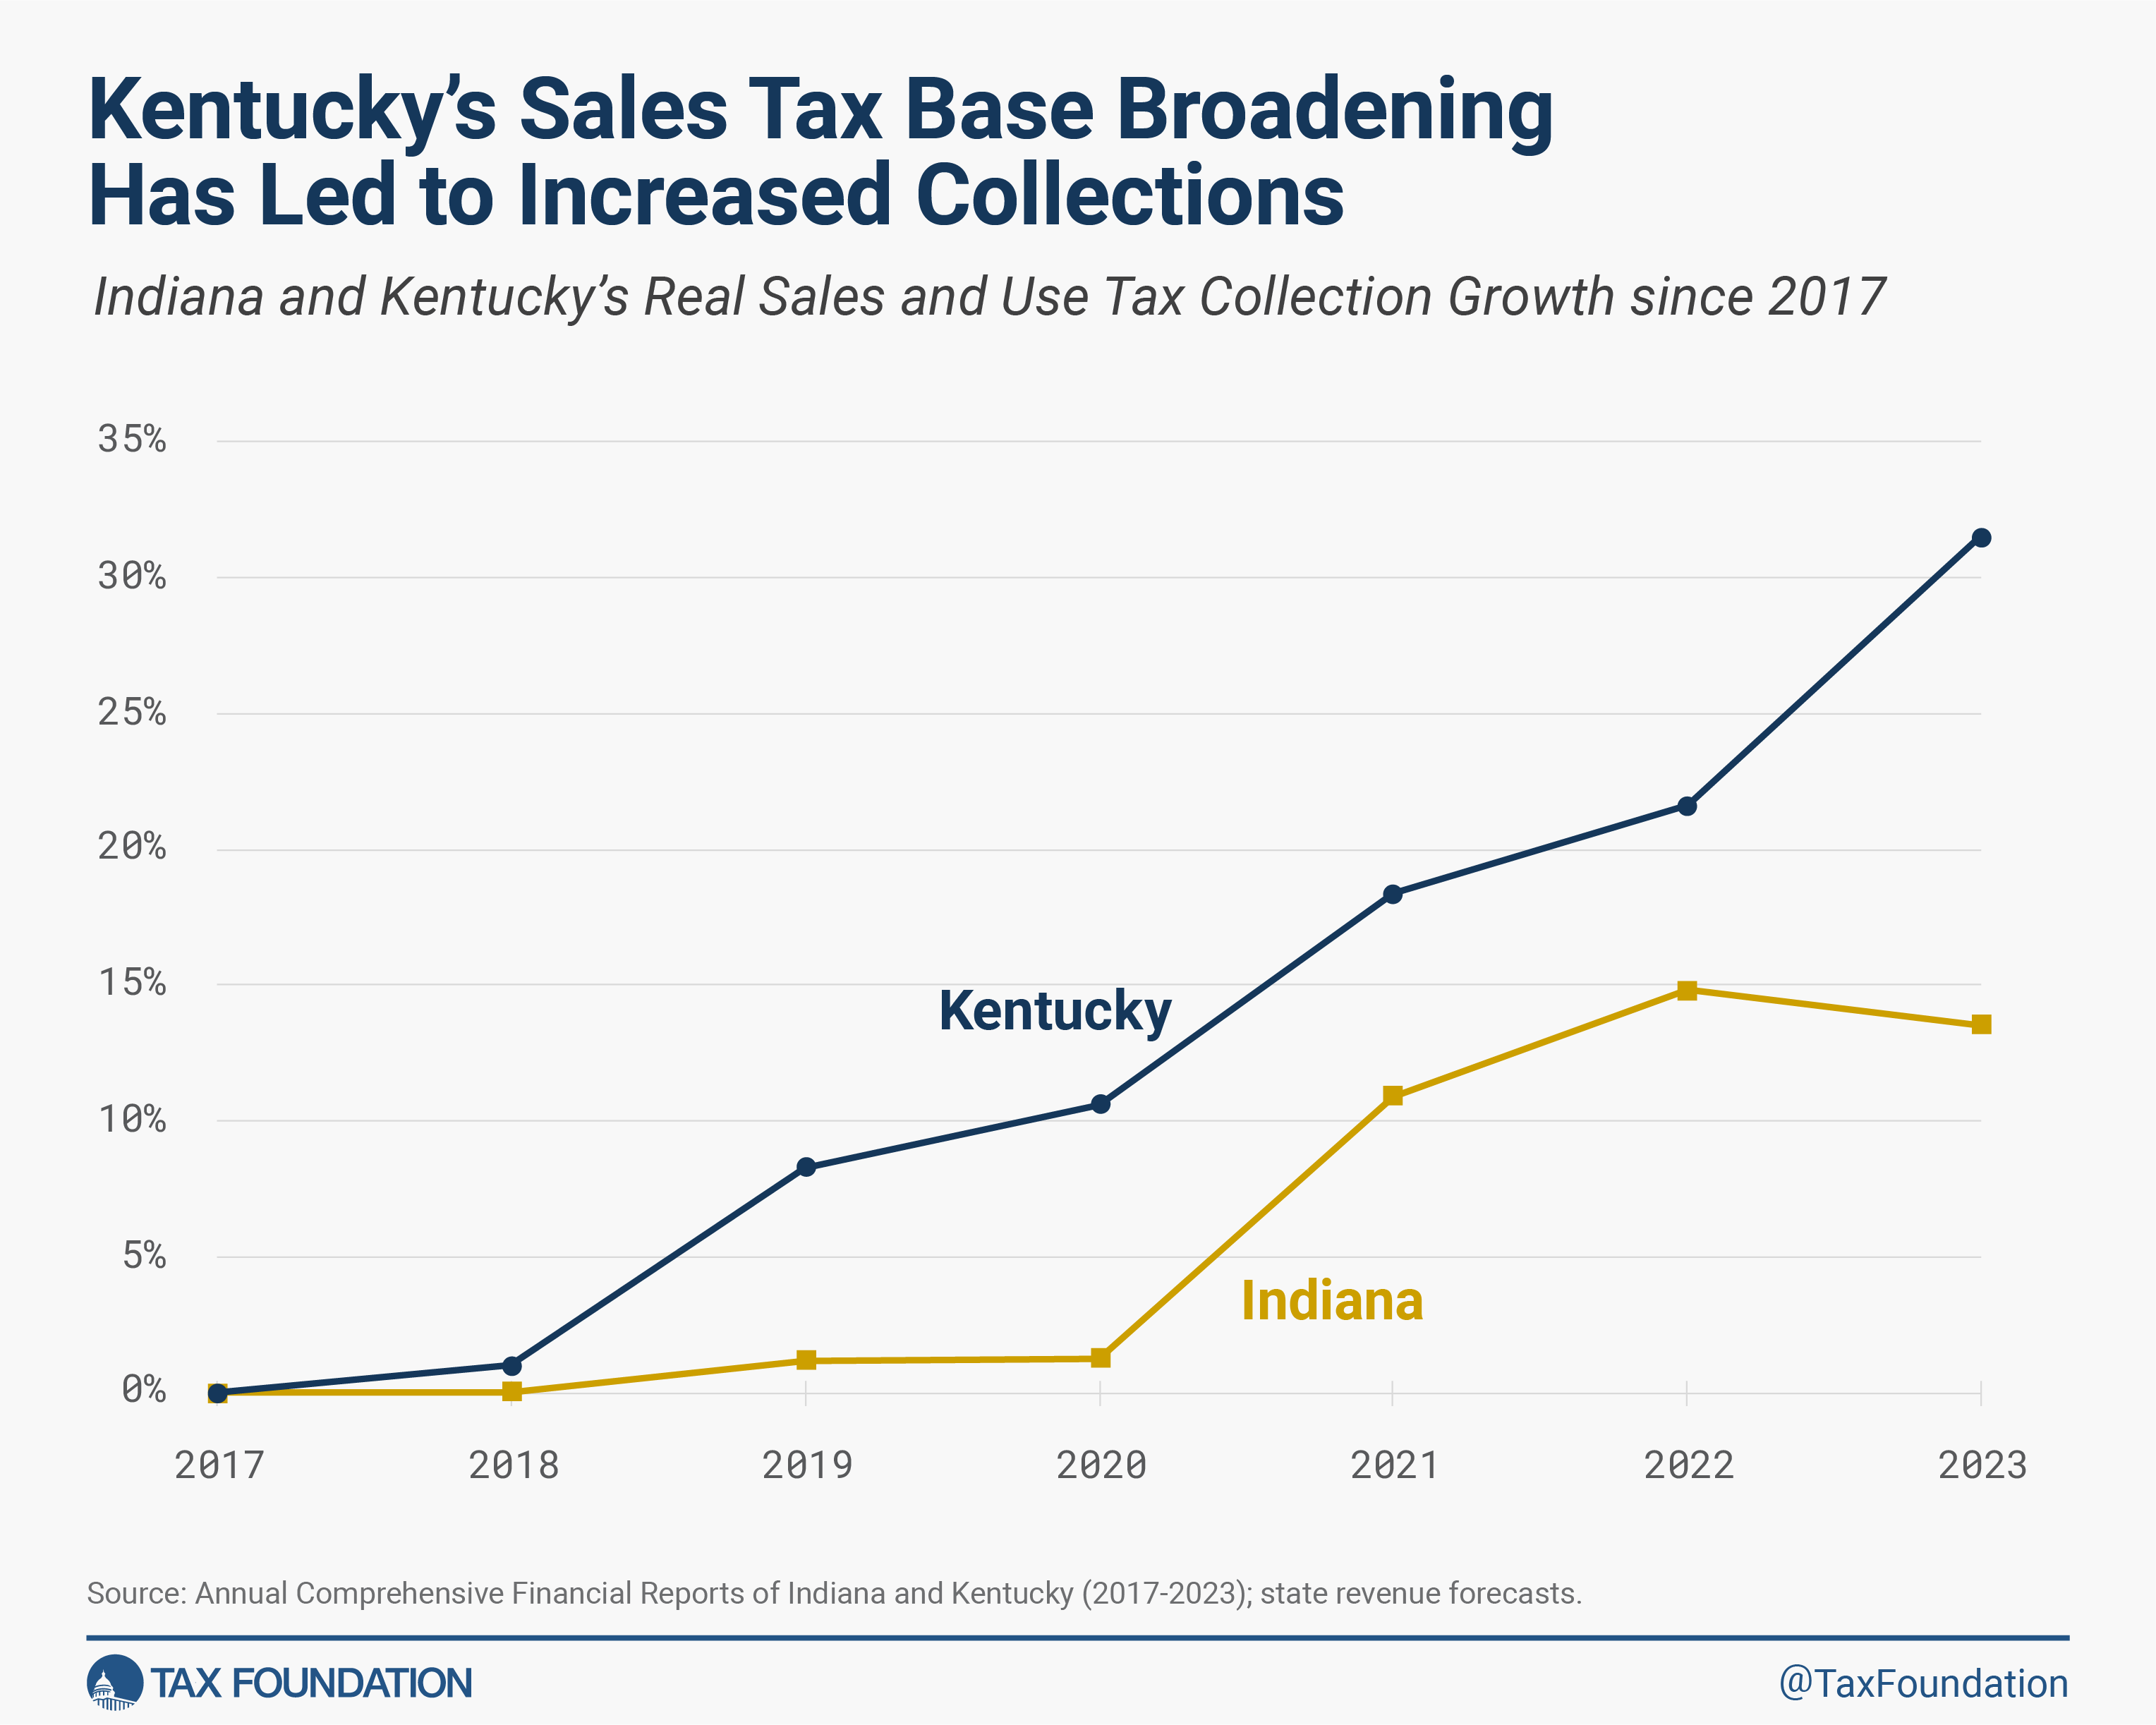
One of Indiana’s neighbors, Kentucky, has recently implemented a large-scale sales tax base broadening reform. In 2018 and again in 2021, Kentucky enacted legislation substantially increasing the sales tax base by making more than 30 personal services taxable while keeping the sales tax rate constant at 6 percent. As a result, real (inflation-adjusted) sales and use tax collections in the state grew by 31.5 percent in six years. In Indiana, which did not implement base broadening, sales and use tax collections increased only by 13.5 percent during the same period.
This example illustrates that sales tax revenues are likely to increase considerably as a result of base broadening, allowing the state to lower the sales tax rate or reform other taxes, depending on lawmakers’ policy priorities. For example, Kentucky had a top marginal individual income tax rate of 6 percent in 2018, but, due to sales tax base broadening and economic growth, Kentucky’s income tax rate was reduced incrementally and is now a flat 4.5 percent.
It is important to note, however, that Kentucky’s recent base-broadening reforms are not a perfect example to follow. They captured multiple services that are primarily purchased as business inputs, as well as some services that are regularly purchased both by businesses and individuals, both of which exacerbate tax pyramiding. When designing any sales tax base-broadening reforms, policymakers should include only goods and services that constitute final personal consumption, not intermediate consumption.
An additional policy option with respect to sales and use taxes is to modify the definition of economic nexus for the purposes of sales tax collection and remittance obligations for remote sellers. After the U.S. Supreme Court’s decision in South Dakota v. Wayfair, every state with a sales tax has adopted economic nexus requirements for remote out-of-state sellers. These requirements typically included the total volume of sales and/or the number of transactions a seller without a physical presence in a state performs in that state.
In Indiana, economic nexus is currently defined as $100,000 in gross revenue or 200 transactions. Several states, including Arizona, Kansas, Oklahoma, Tennessee, and Wisconsin, have eliminated the transaction threshold from their definition of economic nexus (or never had it). This has reduced administrative complexity for smaller remote sellers and tax administrators alike.
For example, imagine a remote firm that sells chocolate bars to Indiana’s residents. When the firm crosses the 200 transactions threshold, it would be required to start collecting and remitting Indiana’s sales tax even if its gross revenue from sales in Indiana is just $1,000. If the transaction threshold is eliminated, only the more substantial remote sellers would be responsible for collecting and remitting the tax. Indiana policymakers should consider following this sound practice and eliminating the transaction threshold from the state’s definition of economic nexus to avoid imposing burdensome compliance costs on small remote sellers.
Indiana’s Property Tax Structure
Indiana’s real property taxes are among the most efficient in the nation, and this is reflected in Indiana’s 2nd-place ranking on the property tax component of our 2023 State Business Tax Climate Index.
Indiana should preserve its current system of real property taxation since property taxes are critically important for local governments, constituting a large, stable, and predictable source of revenue. In Indiana, property taxes generate more than 80 percent of local tax collections, and, as argued by Joan Youngman of the Lincoln Institute of Land Policy,[23] real property taxes are visible, simple, and transparent, satisfying most of the principles of sound tax policy. Real property taxes also satisfy the benefit principle of taxation since tax payments typically correspond with benefits received (e.g., public education, road maintenance, law enforcement protection, libraries, parks, and recreation facilities).
Furthermore, Indiana does not impose nonneutral and economically harmful estate, inheritance, or gift taxes, which would make the state less attractive for relatively affluent individuals.
Additionally, Indiana has recently made important improvements to its tax on tangible personal property. In 2015, Indiana lawmakers created a $20,000 de minimis exemption for tangible personal property, and that exemption has been increased over the years to $80,000 today. This exemption significantly reduces compliance costs and unnecessary tax burdens for many small- and medium-sized businesses, but the tangible personal property tax remains a tax and compliance burden for plenty of other businesses that must calculate the depreciable value of their taxable tangible personal property each year and remit the appropriate amount. As such, in the years ahead, policymakers should consider increasing the de minimis exemption further or indexing it to inflation.
Property Tax Reform Solutions
Since taxes on tangible personal property are more distortive, economically harmful, and administratively complex than real property taxes, policymakers should continue working to reduce reliance on tangible personal property taxes over time, with the goal of eventually repealing the tax altogether. Wisconsin is an example of a state that has seen recent success on this front, with policymakers removing various categories of business tangible personal property from the tax base over time and enacting legislation in a bipartisan manner this year to repeal the tax entirely. Additionally, this year, Rhode Island lawmakers enacted a new $50,000 de minimis exemption that will end tangible personal property tax filing and payment obligations for approximately 75 percent of Rhode Island businesses.[24]
Conclusion
Indiana’s tax code is structured in a relatively sound and economically efficient manner overall, but additional improvements should be considered to make the state even more economically competitive. While there are many factors that influence individuals’ and businesses’ location decisions, tax policy is a significant factor—and one within policymakers’ control. Maintaining a well-structured tax code is one of the best policy options available for states that wish to attract steady economic development and sustain a trajectory of consistent job growth, wage growth, and economic growth over the long run.
This Task Force has a unique opportunity to set a vision for modernizing Indiana’s tax code to better promote long-term economic growth and competitiveness in the Hoosier State, all while continuing to generate the necessary revenue to fund government services. We appreciate the opportunity to participate in this important conversation and are happy to answer any questions.
Stay informed on the tax policies impacting you.
Subscribe to get insights from our trusted experts delivered straight to your inbox.
Subscribe[1] Janelle Fritts and Jared Walczak, 2023 State Business Tax Climate Index, Tax Foundation, Oct. 25, 2022, https://www.taxfoundation.org/research/all/state/2023-state-business-tax-climate-index/.
[2] Note: Ohio does not have a corporate income tax but instead imposes a gross receipts tax at a rate not strictly comparable to corporate income tax rates.
[3] See, e.g., Joseph E. Stiglitz and Jay K. Rosengard, Economics of the Public Sector, Fourth Edition (New York: W. W. Norton & Company, 2015).
[4] Economic arguments for why consumption taxes are less distortive than income taxes are summarized in John L. Mikesell, Fiscal Administration, Tenth Edition (Cengage Learning, 2018) and Gian Maria Milesi-Ferretti and Nouriel Roubini, “Growth Effects of Income and Consumption Taxes,” Journal of Money, Credit and Banking 30:4 (1998): 721-744.
[5] Janelle Fritts, “Americans Moved to Low-Tax States in 2022,” Tax Foundation, Jan. 10, 2023, https://taxfoundation.org/data/all/state/state-population-change-2022/.
[6] These calculations are based on Erica York and Jared Walczak, “State and Local Tax Burdens, Calendar Year 2022,” Tax Foundation, Apr. 7, 2022, https://taxfoundation.org/data/all/state/tax-burden-by-state-2022/.
[7] Jared Walczak, Janelle Fritts, and Maxwell James, “Local Income Taxes: A Primer,” Tax Foundation, Feb. 23, 2023, https://www.taxfoundation.org/research/all/state/local-income-taxes-2023/.
[8] Between 2010 and 2020, Porter County’s population increased by 5.4 percent, while Randolph County’s population declined by 6.4 percent, supporting a more general trend: Americans are moving from high-tax to low-tax jurisdictions. See more in: Janelle Fritts, “Americans Moved to Low-Tax States in 2022,” Tax Foundation, Jan. 10, 2023, https://taxfoundation.org/data/all/state/state-population-change-2022/.
[9] Economic literature provides some evidence that high-income individuals are sensitive to changes in local income tax rates and are more likely to relocate to another locality when their tax burden increases. See more in Lars Feld and Gebhard Kirchgässner, “Income Tax Competition at the State and Local Level in Switzerland,” Regional Science and Urban Economics 31:2-3 (2001): 181-213. For an extended discussion of strategic local tax interactions, also see Raphaël Parchet, “Are Local Tax Rates Strategic Complements or Strategic Substitutes?” American Economic Journal: Economic Policy 11:2 (2019): 189-224.
[10] Georgia is scheduled to replace its combined standard deduction and personal exemption ($14,500) with a single standard deduction of $18,500 in 2024. Arizona now conforms with the federal treatment of the standard deduction ($27,700 in 2023). All numbers are for married couples filing jointly.
[11] Jared Walczak, “Designing Tax Triggers: Lessons from the States,” Tax Foundation, Sept. 7, 2016, https://taxfoundation.org/research/all/state/designing-tax-triggers-lessons-states/.
[12] For instance, Tennessee and Washington have combined state and average local sales tax rates of above 9 percent, and Texas and Nevada have combined rates above 8 percent. All these states except Texas also have broader sales tax bases than Indiana.
[13] “Income Tax Information Bulletin #32,” Indiana Department of Revenue, December 2022, https://www.in.gov/dor/files/ib32.pdf.
[14] Sales tax breadth is defined as the ratio of the implicit sales tax base to state personal income.
[15] Jared Walczak, “State Sales Tax Breadth and Reliance, Fiscal Year 2021,” Tax Foundation, May 4, 2022, https://taxfoundation.org/data/all/state/state-sales-tax-base-reliance/.
[16] John Mikesell, “Reversing 85 Years of Bad State Retail Sales Tax Policy,” State Tax Notes, Feb. 4, 2019, https://www.taxnotes.com/tax-notes-state/sales-and-use-taxation/reversing-85-years-bad-state-retail-sales-tax-policy/2019/02/04/291rj .
[17] Jared Walczak, “The Surprising Regressivity of Grocery Tax Exemptions”, Tax Foundation, April 13, 2022, https://taxfoundation.org/research/all/state/sales-tax-grocery-tax-exemptions/.
[18] Data are from the Bureau of Economic Analysis’ National Income and Product Accounts database (Table 2.3.5. Personal Consumption Expenditures by Major Type).
[19] In Indiana, services occupied 63 percent of personal consumption expenditures in 2021 ($183 billion out of $291 billion).
[20] “Corporate Tax and Sales Tax History,” Indiana Department of Revenue, https://www.in.gov/dor/business-tax/tax-rates-fees-and-penalties/corporate-tax-and-sales-tax-history/.
[21] Based on 2021 BEA data.
[22] According to IRS data (https://www.irs.gov/statistics/soi-tax-stats-historic-table-2), there were 1,943,480 tax returns with adjusted gross income below $50,000 in Indiana in tax year 2020, including 313,650 joint returns.
[23] Joan Youngman, A Good Tax: Legal and Policy Issues for the Property Tax in the United States (Cambridge, MA: Lincoln Institute of Land Policy, 2016).
[24] Meredyth R. Whitty, “Assembly Approves Sen. Murray’s Tangible Tax Bill,” State of Rhode Island General Assembly News, Jun. 15, 2023, https://www.rilegislature.gov/pressrelease/_layouts/RIL.PressRelease.ListStructure/Forms/DisplayForm.aspx?List=c8baae31-3c10-431c-8dcd-9dbbe21ce3e9&ID=373759.
Share