


Introduction
The structure of a country’s tax code is a determining factor of its economic performance. A well-structured tax code is easy for taxpayers to comply with and can promote economic development while raising sufficient revenue for a government’s priorities. In contrast, poorly structured tax systems can be costly, distort economic decision-making, and harm domestic economies.
These economic dynamics apply at the supranational level as well. While the power to tax is in the hands of European Union Member States, the EU’s long-term political goals—such as the need for increased defence spending in the face of Russia’s war in Ukraine, the facilitation of the green and digital transitions,[1] and possible enlargement—will be expensive and require stable government revenues as well as significant private capital investment. Additionally, the Union will face increasing debt payments for the NextGenerationEU package adopted during the COVID-19 pandemic. As the EU takes a more active approach in both indirect and direct taxation to pay for these priorities, proposes new Own Resource ideas for the EU budget, and develops a 28th corporate tax regime to enhance the Single Market, it is important for policymakers to have a data-driven approach.[2]
Furthermore, in line with tax provisions of the Treaty on the Functioning of the European Union,[3] EU tax policy is geared towards the smooth functioning of the single market. Harmonization can have more benefits than costs if the harmonized policy is a principled policy and not simply the least common denominator. Therefore, it is imperative to design Union policy with an eye towards current Member State policies to avoid creating more losers than winners.
The variety of approaches to taxation among European countries creates a need to evaluate these systems relative to each other. For that purpose, we have developed the European Tax Policy Scorecard—a relative comparison of European countries’ tax systems.
The European Tax Policy Scorecard (ETPS)
The European Tax Policy Scorecard seeks to measure the extent to which a country’s tax system adheres to two important aspects of tax policy: competitiveness and neutrality.
A competitive tax code is one that keeps marginal tax rates low. In today’s globalized world, capital is highly mobile. Businesses can choose to invest in any number of countries throughout the world to find the highest rate of return. This means that businesses will look for countries with lower tax rates on investment to maximize their after-tax rate of return. If a country’s tax rate is too high, it will drive investment elsewhere, leading to slower economic growth. In addition, high marginal tax rates can impede domestic investment and lead to tax avoidance.

Table 1. 2025 European Tax Policy Scorecard Rankings
| Country | Overall Rank | Overall Score | Corporate Tax Rank | Individual Taxes Rank | Consumption Taxes Rank | Property Taxes Rank | Cross-Border Tax Rules Rank |
|---|---|---|---|---|---|---|---|
| Estonia | 1 | 100 | 2 | 6 | 13 | 1 | 9 |
| Cyprus | 2 | 96.3 | 4 | 8 | 3 | 3 | 13 |
| Switzerland | 3 | 95.4 | 12 | 10 | 1 | 31 | 1 |
| Latvia | 4 | 93 | 1 | 13 | 8 | 5 | 8 |
| Malta | 5 | 92.5 | 28 | 3 | 4 | 2 | 7 |
| Bulgaria | 6 | 89.5 | 3 | 1 | 9 | 10 | 20 |
| Romania | 7 | 83.9 | 8 | 2 | 28 | 4 | 17 |
| Lithuania | 8 | 81.2 | 6 | 12 | 12 | 7 | 18 |
| Czech Republic | 9 | 77.5 | 13 | 15 | 20 | 7 | 10 |
| Luxembourg | 10 | 75.5 | 23 | 31 | 2 | 15 | 5 |
| Hungary | 11 | 74.8 | 7 | 5 | 32 | 20 | 4 |
| Sweden | 12 | 74.3 | 10 | 19 | 22 | 9 | 11 |
| Turkey | 13 | 74.2 | 26 | 11 | 10 | 23 | 6 |
| Slovak Republic | 14 | 72.6 | 24 | 4 | 25 | 6 | 22 |
| Croatia | 15 | 72.4 | 5 | 9 | 27 | 10 | 30 |
| Netherlands | 16 | 72 | 25 | 26 | 7 | 15 | 3 |
| United Kingdom | 17 | 67.7 | 27 | 20 | 23 | 20 | 2 |
| Norway | 18 | 65.5 | 16 | 22 | 19 | 14 | 16 |
| Austria | 19 | 65.4 | 21 | 28 | 6 | 24 | 15 |
| Greece | 20 | 65.3 | 19 | 7 | 26 | 22 | 26 |
| Finland | 21 | 64.5 | 11 | 23 | 24 | 18 | 19 |
| Belgium | 22 | 63.9 | 18 | 18 | 16 | 26 | 21 |
| Denmark | 23 | 63.8 | 17 | 24 | 15 | 10 | 31 |
| Slovenia | 24 | 62.5 | 15 | 14 | 17 | 28 | 29 |
| Iceland | 25 | 61.3 | 14 | 16 | 18 | 29 | 27 |
| Germany | 26 | 60.3 | 29 | 32 | 5 | 10 | 12 |
| Ireland | 27 | 59.1 | 9 | 29 | 30 | 18 | 24 |
| Poland | 28 | 56.6 | 22 | 17 | 29 | 25 | 32 |
| Portugal | 29 | 54.5 | 31 | 25 | 14 | 15 | 28 |
| Spain | 30 | 51.9 | 30 | 27 | 11 | 30 | 23 |
| France | 31 | 47 | 32 | 30 | 21 | 26 | 14 |
| Italy | 32 | 46.6 | 20 | 21 | 31 | 32 | 25 |
According to research from the OECD, corporate taxes are most harmful for economic growth, with personal income taxes and consumption taxes being less harmful. Taxes on immovable property have the smallest impact on growth.[4]
Separately, a neutral tax code is simply one that seeks to raise the most revenue with the fewest economic distortions. This means that it doesn’t favor consumption over saving, as investment and wealth taxes do. It also means few or no targeted tax breaks for specific activities carried out by businesses or individuals.
As tax laws become more complex, they also become less neutral. If, in theory, the same taxes apply to all businesses and individuals, but the rules are such that some groups of businesses or individuals can change their behavior to gain a tax advantage, this undermines the neutrality of a tax system.
A tax code that is competitive and neutral promotes sustainable economic growth and investment while raising sufficient revenue for government priorities. There are many factors unrelated to taxes which affect a country’s economic performance. Nevertheless, taxes play an important role in the health of a country’s economy.
To measure whether a country’s tax system is neutral and competitive, the ETPS looks at 40 tax policy variables. These variables measure not only the level of tax rates, but also how taxes are structured. The ETPS looks at a country’s corporate taxes, individual income taxes, consumption taxes, property taxes, and the treatment of profits earned cross-border. The ETPS gives a comprehensive overview of how developed countries’ tax codes compare, explains why certain tax codes stand out as good or bad models for reform, and provides important insight into how to think about tax policy.
The ETPS is intended to focus on European Union Member States. However, it also includes European OECD countries that are not part of the European Union, but tend to have significant economic relationships with the EU—such as Iceland, Norway, Switzerland, Turkey, and the United Kingdom—to give policymakers in Brussels a better understanding of tax policies in those countries and the effects their decisions may have on important regional partners.
The ETPS uses the most up-to-date data available as of July 2025. Recent changes in countries making rapid reforms may not be reflected in this year’s version of the European Tax Policy Scorecard.
2025 Rankings
Estonia has the highest ranking tax code in the ETPS. Its top score is driven by four positive features of its tax system. First, it has a 22 percent tax rate on corporate income that is only applied to distributed profits. Second, it has a flat 22 percent tax on individual income that does not apply to personal dividend income. Third, its property taxA property tax is primarily levied on immovable property like land and buildings, as well as on tangible personal property that is movable, like vehicles and equipment. Property taxes are the single largest source of state and local revenue in the U.S. and help fund schools, roads, police, and other services. applies only to the value of land, rather than to the value of real property or capital. Finally, it has a territorial tax systemTerritorial taxation is a system that excludes foreign earnings from a country’s domestic tax base. This is common throughout the world and is the opposite of worldwide taxation, where foreign earnings are included in the domestic tax base. that exempts 100 percent of foreign profits earned by domestic corporations from domestic taxation, with few restrictions.
While Estonia’s tax system is the most competitive in the ETPS, the other top countries’ tax systems receive high scores due to excellence in one or more of the major tax categories.
Cyprus has a low corporate tax rate of 12.5 percent and grants an allowance for corporate equity (ACE). It also levies a broad-based consumption taxA consumption tax is typically levied on the purchase of goods or services and is paid directly or indirectly by the consumer in the form of retail sales taxes, excise taxes, tariffs, value-added taxes (VAT), or income taxes where all savings are tax-deductible., while forgoing property taxes and taxes on capital gains from listed shares. WithholdingWithholding is the income an employer takes out of an employee’s paycheck and remits to the federal, state, and/or local government. It is calculated based on the amount of income earned, the taxpayer’s filing status, the number of allowances claimed, and any additional amount the employee requests. taxes are only levied on dividends at a low rate of 3 percent.
Switzerland has a relatively low corporate tax rate of 19.6 percent; a low, broad-based value-added tax with an 8.1 percent standard rate; and an individual income taxAn individual income tax (or personal income tax) is levied on the wages, salaries, investments, or other forms of income an individual or household earns. The U.S. imposes a progressive income tax where rates increase with income. The Federal Income Tax was established in 1913 with the ratification of the 16th Amendment. Though barely 100 years old, individual income taxes are the largest source that partially exempts capital gains from taxation.
Conversely, the least competitive systems in the ETPS have significant flaws in one or more of the major categories.
Italy has the least competitive tax system in the ETPS, due to its multiple distortionary property taxes with separate levies on real estate transfers, estates, and financial transactions, as well as a wealth tax on selected assets. Italy’s relatively high VAT rate of 22 percent applies to a narrow consumption base of only 43 percent of consumption, revealing both policy and enforcement gaps.
France has the second least competitive tax system in the ETPS. It also levies multiple distortionary property taxes, with separate levies on estates, bank assets, and financial transactions, and a wealth tax on real estate. Further, France levies the highest top marginal corporate tax rate at 36.1 percent due to several surtaxes, and the tax burden on labor of 47 percent for the average single worker is among the highest for ETPS countries.
Countries that rank poorly on the ETPS often levy relatively high marginal tax rates on corporate income or have multiple layers of tax rules that increase complexity. Four of the five countries at the bottom of the rankings have higher-than-average combined corporate tax rates, between 25 and 36.1 percent. Ireland ranks poorly on the ETPS despite its low corporate tax rate. This is due to high personal income taxes, including the highest top dividends rate at 51 percent, and a relatively narrow VAT base. The five lowest-ranking countries have unusually complex corporate tax incentives, employing between two and six alternative corporate rates, compared to an ETPS average of 1.8 percent.
They also tend to have narrow VAT bases, covering only between 43 and 56 percent of final consumption, and all but one have higher-than-average capital gains taxA capital gains tax is levied on the profit made from selling an asset and is often in addition to corporate income taxes, frequently resulting in double taxation. These taxes create a bias against saving, leading to a lower level of national income by encouraging present consumption over investment. rates, between 26 and 34 percent, compared to an ETPS average of 17.7 percent.
Notable Changes from Last Year
Croatia
Croatia simplified its personal income tax system in 2025, eliminating its municipal surtax and reducing the top rate from over 35 to 33 percent. It also introduced recurrent property taxes and broadened its VAT base. Croatia’s rank improved from 17th to 15th.
France
France added a temporary surtax on corporate income for companies with high revenues, lifting its top marginal corporate rate from 25.8 to 36.1 percent for 2025, the highest rate in Europe and the developed world. France’s rank fell from 30th to 31st.
Germany
Germany reinstated its accelerated depreciationDepreciation is a measurement of the “useful life” of a business asset, such as machinery or a factory, to determine the multiyear period over which the cost of that asset can be deducted from taxable income. Instead of allowing businesses to deduct the cost of investments immediately (i.e., full expensing), depreciation requires deductions to be taken over time, reducing their value and disco schedule for machinery and equipment at a higher rate in the summer of 2025 and plans to reduce its corporate tax rate by 5 percentage points over a five-year period starting in 2028. At the same time, Germany also expanded the generosity of its R&D tax subsidies. Germany’s rank fell from 24th to 26th.
Ireland
Ireland became one of the last European countries to introduce a participation exemption for dividends received from abroad, moving to a more territorial system. Ireland’s rank improved from 28th to 27th.
Portugal
Portugal lowered its tax rate on long-term capital gains from 28 to 19.6 percent and reduced its top corporate tax rate from 31.5 to 30.5 percent. In 2025, Portugal also made its notional interest deduction more generous. Portugal’s rank rose from 31st to 29th.
Slovak Republic
In 2025, the Slovak Republic increased its corporate rate from 21 to 24 percent, increased its VAT registration threshold, and introduced a financial transaction tax. The Slovak Republic’s rank fell from 10th to 14th.
Table 2. Changes from Last Year
| Country | 2024 Rank | 2024 Score | 2025 Rank | 2025 Score | Change in Rank from 2024 to 2025 | Change in Score from 2024 to 2025 |
|---|---|---|---|---|---|---|
| Austria | 19 | 64.7 | 19 | 65.4 | 0 | 0.6 |
| Belgium | 25 | 61.9 | 22 | 63.9 | 3 | 1.9 |
| Bulgaria | 6 | 85.7 | 6 | 89.5 | 0 | 3.8 |
| Croatia | 17 | 66 | 15 | 72.4 | 2 | 6.4 |
| Cyprus | 2 | 96 | 2 | 96.3 | 0 | 0.3 |
| Czech Republic | 9 | 76.8 | 9 | 77.5 | 0 | 0.7 |
| Denmark | 22 | 62.6 | 23 | 63.8 | -1 | 1.2 |
| Estonia | 1 | 100 | 1 | 100 | 0 | 0 |
| Finland | 16 | 66.2 | 21 | 64.5 | -5 | -1.7 |
| France | 30 | 52 | 31 | 47 | -1 | -5 |
| Germany | 24 | 62 | 26 | 60.3 | -2 | -1.7 |
| Greece | 23 | 62.5 | 20 | 65.3 | 3 | 2.8 |
| Hungary | 12 | 75.4 | 11 | 74.8 | 1 | -0.6 |
| Iceland | 26 | 57.7 | 25 | 61.3 | 1 | 3.6 |
| Ireland | 28 | 54.2 | 27 | 59.1 | 1 | 4.9 |
| Italy | 32 | 45.6 | 32 | 46.6 | 0 | 1.1 |
| Latvia | 4 | 92.6 | 4 | 93 | 0 | 0.4 |
| Lithuania | 8 | 79.3 | 8 | 81.2 | 0 | 1.9 |
| Luxembourg | 11 | 75.4 | 10 | 75.5 | 1 | 0.1 |
| Malta | 5 | 88.7 | 5 | 92.5 | 0 | 3.8 |
| Netherlands | 15 | 68.7 | 16 | 72 | -1 | 3.3 |
| Norway | 21 | 62.9 | 18 | 65.5 | 3 | 2.6 |
| Poland | 27 | 55.4 | 28 | 56.6 | -1 | 1.1 |
| Portugal | 31 | 49.7 | 29 | 54.5 | 2 | 4.8 |
| Romania | 7 | 83 | 7 | 83.9 | 0 | 0.9 |
| Slovak Republic | 10 | 76.1 | 14 | 72.6 | -4 | -3.5 |
| Slovenia | 20 | 63 | 24 | 62.5 | -4 | -0.5 |
| Spain | 29 | 53.3 | 30 | 51.9 | -1 | -1.3 |
| Sweden | 14 | 72.4 | 12 | 74.3 | 2 | 1.9 |
| Switzerland | 3 | 93.2 | 3 | 95.4 | 0 | 2.1 |
| Turkey | 13 | 72.7 | 13 | 74.2 | 0 | 1.5 |
| United Kingdom | 18 | 65.9 | 17 | 67.7 | 1 | 1.8 |
Methodological Changes
For the third edition of the ETPS, we reviewed its data and methodology to improve how it measures both competitiveness and neutrality.
The prior editions of the ETPS, however, may not be comparable to the results in this 2025 edition due to minor methodological changes and data corrections.
Corporate Income TaxA corporate income tax (CIT) is levied by federal and state governments on business profits. Many companies are not subject to the CIT because they are taxed as pass-through businesses, with income reportable under the individual income tax.
The corporate income tax is a direct tax on corporations’ profits. All European ETPS countries levy a tax on corporate profits, but the tax rates and bases vary significantly across countries.
The ETPS breaks the corporate income tax category into three subcategories. Table 3 displays each country’s corporate income tax category rank and score, along with the ranks and scores of the subcategories—namely, the corporate rate, cost recoveryCost recovery refers to how the tax system permits businesses to recover the cost of investments through depreciation or amortization. Depreciation and amortization deductions affect taxable income, effective tax rates, and investment decisions., incentives, and complexity.
Combined Top Marginal Corporate Income Tax Rate
The top marginal corporate income tax rate measures the rate at which each additional euro of taxable profit is taxed. Countries with higher top marginal corporate income tax rates than the ETPS average receive lower scores than those with lower, more competitive rates.
France levies the highest top corporate income tax rate (36.1 percent), followed by Malta (35 percent) [5] and Portugal (30.5 percent). The lowest top marginal corporate income tax rate among ETPS countries is in Hungary (9 percent), followed by Bulgaria (10 percent) and Cyprus and Ireland (both 12.5 percent). The ETPS’s average combined corporate income tax rate is 21.9 percent for 2025.[6]
Table 3. Corporate Taxes
| Country | Overall Rank | Overall Score | Rate Rank | Rate Score | Cost Recovery Rank | Cost Recovery Score | Incentives/Complexity Rank | Incentives/Complexity Score |
|---|---|---|---|---|---|---|---|---|
| Austria | 21 | 63.3 | 20 | 58.1 | 13 | 43.4 | 21 | 68.3 |
| Belgium | 18 | 65.1 | 23 | 52.1 | 6 | 51.4 | 18 | 73.8 |
| Bulgaria | 3 | 91.7 | 2 | 97.0 | 21 | 39.5 | 2 | 95.7 |
| Croatia | 5 | 81.8 | 7 | 73.0 | 5 | 52.5 | 7 | 89.3 |
| Cyprus | 4 | 82.3 | 3 | 89.5 | 24 | 35.6 | 12 | 84.1 |
| Czech Republic | 13 | 71.4 | 14 | 64.0 | 22 | 39.3 | 8 | 86.6 |
| Denmark | 17 | 66.4 | 15 | 61.0 | 27 | 32.6 | 13 | 84.0 |
| Estonia | 2 | 94.8 | 15 | 61.0 | 1 | 100.0 | 3 | 93.9 |
| Finland | 11 | 72.3 | 10 | 67.0 | 26 | 33.4 | 4 | 91.0 |
| France | 32 | 29.0 | 32 | 18.7 | 10 | 45.1 | 32 | 27.2 |
| Germany | 29 | 53.4 | 29 | 36.9 | 8 | 48.7 | 25 | 65.6 |
| Greece | 19 | 64.7 | 15 | 61.0 | 31 | 26.6 | 10 | 85.4 |
| Hungary | 7 | 77.9 | 1 | 100.0 | 32 | 26.3 | 24 | 66.4 |
| Iceland | 14 | 70.2 | 10 | 67.0 | 23 | 39.0 | 15 | 79.4 |
| Ireland | 9 | 74.9 | 3 | 89.5 | 29 | 30.4 | 20 | 68.7 |
| Italy | 20 | 63.4 | 28 | 43.6 | 4 | 56.5 | 16 | 76.1 |
| Latvia | 1 | 100.0 | 10 | 67.0 | 1 | 100.0 | 1 | 100.0 |
| Lithuania | 6 | 81.2 | 5 | 79.0 | 3 | 62.8 | 22 | 68.2 |
| Luxembourg | 23 | 60.5 | 21 | 55.4 | 11 | 44.9 | 27 | 62.8 |
| Malta | 28 | 54.8 | 31 | 22.1 | 7 | 49.8 | 6 | 90.2 |
| Netherlands | 25 | 59.3 | 27 | 49.7 | 15 | 42.0 | 19 | 70.7 |
| Norway | 16 | 66.5 | 15 | 61.0 | 28 | 31.0 | 9 | 85.9 |
| Poland | 22 | 62.8 | 8 | 70.0 | 14 | 42.1 | 30 | 50.9 |
| Portugal | 31 | 40.7 | 30 | 35.6 | 12 | 44.2 | 31 | 36.7 |
| Romania | 8 | 77.2 | 5 | 79.0 | 18 | 40.9 | 14 | 79.5 |
| Slovak Republic | 24 | 59.4 | 22 | 55.1 | 19 | 39.9 | 26 | 65.3 |
| Slovenia | 15 | 67.6 | 15 | 61.0 | 25 | 34.4 | 10 | 85.4 |
| Spain | 30 | 49.1 | 23 | 52.1 | 30 | 28.9 | 29 | 52.0 |
| Sweden | 10 | 74.4 | 13 | 65.2 | 16 | 41.9 | 5 | 90.8 |
| Switzerland | 12 | 71.6 | 9 | 68.2 | 9 | 46.1 | 17 | 74.2 |
| Turkey | 26 | 58.4 | 23 | 52.1 | 20 | 39.7 | 23 | 67.0 |
| United Kingdom | 27 | 55.4 | 23 | 52.1 | 17 | 41.5 | 28 | 56.8 |
Cost Recovery
The corporate income tax is intended to be a tax on profits, not revenues. Thus, it is important that a tax code properly defines what constitutes taxable incomeTaxable income is the amount of income subject to tax, after deductions and exemptions. Taxable income differs from—and is less than—gross income. . If a tax code does not allow businesses to account for all the costs of doing business, it will inflate a business’ taxable income and thus its tax bill.
Loss Offset Rules: Carryforwards and Carrybacks
Loss carryover provisions allow businesses to either deduct current year losses against future profits (carryforwards) or deduct current year losses against past profits (carrybacks). Carryover provisions help businesses “smooth” their risk and income. Ideally, a tax code allows businesses to carry forward their losses for an unlimited number of years, ensuring that a business is taxed on its average profitability over time.
In 18 of the 32 ETPS countries, corporations can carry forward losses indefinitely in 2025, although 12 limit the amount of taxable income that can be offset by losses from previous years.[7] Of the 14 countries with time limits, the average loss carryforward period is six years. Hungary, Poland, and Slovakia have the most restrictive loss carryover provisions in the ETPS: carrybacks are not allowed, and carryforwards are not only limited to five years but also capped at 50 percent of taxable income (coded as 2.5 years).[8] The ETPS ranks countries that allow losses to be carried forward indefinitely without limits better than countries that impose time or deductibility restrictions on carryforwards.
Countries tend to be significantly more restrictive with loss carryback provisions than with carryforward provisions. In 2025, only the Estonian and Latvian systems allow, by design, unlimited carrybacks of losses.[9] Of the six countries that allow time-limited carrybacks, the average period is 1.25 years.[10] The ETPS penalizes the 24 countries that do not allow any loss carrybacks.
Capital Cost Recovery: Machines, Buildings, and Intangibles
Businesses determine their profits by subtracting costs from revenue. However, in most jurisdictions, capital investments are not treated like other regular costs that can be subtracted from revenue in the year the money is spent. Instead, businesses are required to write off these costs over several years or even decades, depending on the type of asset. Depreciation schedules specify the amounts businesses are legally allowed to write off, as well as the time period over which assets need to be written off.
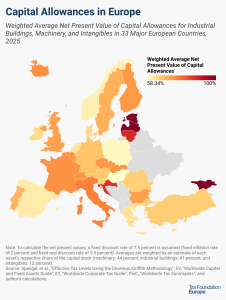
The ETPS measures a country’s capital allowances for three asset types, machinery, industrial buildings, and intangibles.[11] Capital allowances are expressed as a percent of the present value cost that corporations can write off over the life of an asset. A 100 percent capital allowanceA capital allowance is the amount of capital investment costs, or money directed towards a company’s long-term growth, a business can deduct each year from its revenue via depreciation. These are also sometimes referred to as depreciation allowances. represents a business’ ability to deduct the full cost of an investment over its life in real terms. Countries that provide faster write-offs for capital investments receive better scores in the ETPS.
On average, across the ETPS, businesses can write off 86.6 percent of the cost of machinery, 50.6 percent of the cost of industrial buildings, and 82.0 percent of the cost of intangibles, in real terms.
Several countries have or are set to make permanent improvements to their capital allowances in recent years. In 2023, the United Kingdom made full expensingFull expensing allows businesses to immediately deduct the full cost of certain investments in new or improved technology, equipment, or buildings. It alleviates a bias in the tax code and incentivizes companies to invest more, which, in the long run, raises worker productivity, boosts wages, and creates more jobs. for machinery and equipment a permanent feature of its tax code, while Lithuania is set to make full expensing for machinery and equipment permanently available from 2026.
Other countries are phasing out improvements to their capital allowances, undoing their positive long-term impact and generating economic uncertainty. Finland prolonged its accelerated depreciation for machinery until 2026, but is set to phase it out thereafter. Germany reinstated its accelerated depreciation schedule for machinery in 2025 at a higher rate, set to expire after 2026.
Estonia and Latvia are coded as allowing 100 percent of the present value of capital investment to be written off, as their corporate tax only applies to distributed profits and is thus determined by cash flow.
Inventories
Like capital investments, the costs of inventories are not written off in the year of purchase. Instead, the costs of inventories are deducted at sale. As a result, governments need to define the total cost of inventories sold. There are generally three methods used to calculate inventories: last in, first out (LIFO); average cost; and first in, first out (FIFO).
Countries that allow businesses to choose the LIFO method receive the best scores, those that allow the average cost method receive an average score, and countries that only allow the FIFO method receive the worst scores. Twelve ETPS countries allow companies to use the LIFO method of accounting, 13 countries use the average cost method of accounting, and seven countries limit companies to the FIFO method of accounting.[12]
Allowance for Corporate Equity
Businesses can finance their operations through debt or equity. Five ETPS countries—Cyprus, Malta, Poland, Portugal, and Turkey—have introduced an allowance for corporate equity.[13] All countries except Malta apply the allowance only to new equity instead of all equity, limiting the tax revenue costs while preserving the efficiency gains. The allowance rate is frequently based on the corporate or government bond rate and in some cases is adjusted by a risk premium.[14]
Countries that have implemented an allowance for corporate equity receive a better score in the ETPS.
Tax Incentives and Complexity
Good tax policy treats economic decisions neutrally by neither encouraging nor discouraging one activity over another. A tax incentive is a tax credit, deduction, or preferential tax rate that exclusively applies to a specific type of economic activity and can thus distort economic decisions.
The ETPS considers whether countries provide incentives such as patent box provisions and research and development (R&D) tax subsidies. Countries that provide such incentives are scored worse than those that do not.
Patent Boxes
Due to an increasingly globalized and mobile economy, countries have searched for ways to prevent corporations from reincorporating or shifting operations or profits elsewhere. One response to the increase in capital mobility has been the creation of patent boxes.
Patent boxes—also referred to as intellectual property (IP) regimes—provide tax rates on income derived from IP that are below statutory corporate tax rates. Eligible types of IP are most commonly patents and software copyrights. Patent boxes are an income-based, rather than an expenditure-based, tax incentive limiting its benefits to successful R&D projects that have produced IP rights rather than decreasing the ex-ante risks of R&D through cost reductions.
Intellectual property is extremely mobile. Hence, a country can use the lower tax rate of a patent box to entice corporations to hold their intellectual property within its borders. Research suggests that patent boxes are likely to attract new income derived from patents, implying that businesses reduce their corporate tax liability by shifting IP-related income. Tax revenues, however, are likely to decline, as the negative revenue effects of the lower statutory rate on patent income can be only partially offset by revenues from newly attracted patent income.[15]
In recent years, patent box rules have become more stringent in some countries as the OECD requirements for countering harmful tax practices have been adopted. Countries that follow the OECD standards now require companies to have substantial R&D activity within their borders to benefit from tax preferences associated with their intellectual property.[16]
Instead of providing patent boxes for intellectual property, countries should recognize that all capital is mobile to some degree and lower their corporate tax rates across the board. This would encourage investment of all kinds, rather than merely incentivizing corporations to locate their patents in a specific country.
Sixteen ETPS countries—Belgium, Cyprus, France, Hungary, Ireland, Lithuania, Luxembourg, Malta, the Netherlands, Poland, Portugal, Slovakia, Spain, Switzerland, Turkey, and the United Kingdom—have patent box legislation, with rates and exemptions varying among countries.[17] Countries with patent box regimes receive a lower score.
Research and Development
In the absence of full expensing, expenditure-based R&D tax incentives (partially) offset the tax costs of business investment. Unfortunately, R&D tax incentives are rarely neutral—they usually define very specific activities that qualify—and are often complex in their implementation.
As with other incentives, R&D incentives distort investment decisions and lead to an inefficient allocation of resources.[18] Additionally, the desire to secure R&D incentives encourages lobbying activities that consume resources and detract from investment and production. In Italy, for instance, firms can engage in a negotiation process for incentives, such as easy-term loans and tax credits.[19]
Countries could better use the revenue spent on special tax incentives to provide a lower business tax rate across the board or to improve the tax treatment of capital investment.
The implied tax subsidy rate on R&D expenditures, developed by the ETPS, measures the extent of expenditure-based R&D tax relief across countries. Implied tax subsidy rates are measured as the difference between one unit of investment in R&D and the pretax income required to break even on that investment unit, assuming a representative firm. In other words, it measures the extent of the preferential treatment of R&D in a given tax system. The more generous the tax provisions for R&D, the higher the implied tax subsidy rates for R&D. An implied subsidy rate of zero means R&D does not receive preferential tax treatment.
Among ETPS countries, Iceland has the highest implied tax subsidy rate on R&D expenditures, at 36.5 percent. Portugal and France provide the second and third most generous relief, with implied tax subsidy rates of 35 and 34.25 percent, respectively.
Of the countries that grant notable relief, Denmark (1 percent), Cyprus (2 percent), and Estonia (4 percent) are the least generous. The implied tax subsidy rates of Bulgaria, Latvia, Luxembourg, Malta, and Switzerland do not show any significant expenditure-based R&D tax relief.[20]
Countries that provide more generous expenditure-based R&D tax incentives receive a lower score on the ETPS.
Digital Services Taxes
Over the last few years, several ETPS countries have implemented so-called digital services taxes (DSTs). DSTs are taxes on selected gross revenue streams of large digital businesses. Their tax base typically includes revenues either derived from a specific set of digital goods or services (for example, targeted online advertising) or based on the number of digital users within a country. Relatively high domestic and global revenue thresholds limit the tax to large multinationals. As of 2025, 11 ETPS countries have implemented a DST: Austria, Denmark, France, Hungary, Italy, Poland, Portugal, Spain, Switzerland, Turkey, and the United Kingdom.[21]
Countries that have implemented a DST receive a lower score on the ETPS.
Complexity
The ETPS quantifies corporate tax code complexity by measuring the number of separate taxes (and rates) that apply to business income and the existence of surtax rates on business income. These burdens are measured by tallying up the separate rates that apply to business income and identifying applicable surtaxes.
Three countries apply a surtax to all or part of their corporate income tax: France, Germany, and Luxembourg. Thirty countries, with the exception of Latvia and Malta, apply an alternative minimum tax or multiple tax rates on corporate income. Portugal operates the most differentiated rate structure, with six different rates applying to corporate income ranging from 8.75 to 30.5 percent and a qualified domestic minimum tax.
Countries that have multiple rates that apply to corporate income and levy surtaxes on parts of corporate income taxes receive worse scores on the ETPS.
Individual Taxes
Individual income taxes are levied on an individual’s or household’s income to fund general government operations. These taxes are typically progressive, meaning that the rate at which an individual’s income is taxed increases as the individual earns more income.
In addition, countries have payroll taxes—also referred to as social security contributions or social insurance taxes. These typically flat-rate taxes are levied on wage income in addition to a country’s general individual income tax.
A country’s score for its individual income tax is determined by three subcategories: the rate and progressivity of wage taxation, income tax complexity, and the extent to which the income tax double taxes corporate income. Table 4 shows the ranks and scores for the entire individual tax category as well as the rank and score for each subcategory.
Taxes on Ordinary Income
A country’s taxes on ordinary income are measured according to three variables: the top rate at which ordinary income is taxed, the top income tax threshold, and the economic efficiency of labor taxation.
Table 4. Individual Taxes
| Country | Overall Rank | Overall Score | Income Tax Rank | Income Tax Score | Complexity Rank | Complexity Score | Capital Gains/Dividends Rank | Capital Gains/Dividends Score |
|---|---|---|---|---|---|---|---|---|
| Austria | 28 | 54.7 | 19 | 53.8 | 1 | 100 | 9 | 81.6 |
| Belgium | 18 | 72 | 18 | 55.1 | 1 | 100 | 25 | 46.3 |
| Bulgaria | 1 | 100 | 32 | 24.5 | 1 | 100 | 23 | 50.5 |
| Croatia | 9 | 83.6 | 25 | 45.4 | 1 | 100 | 15 | 72 |
| Cyprus | 8 | 83.8 | 1 | 100 | 1 | 100 | 4 | 86.7 |
| Czech Republic | 15 | 75.9 | 8 | 67.6 | 1 | 100 | 11 | 78.4 |
| Denmark | 24 | 58.9 | 10 | 62.3 | 1 | 100 | 5 | 84.1 |
| Estonia | 6 | 84.6 | 6 | 69 | 1 | 100 | 19 | 58.6 |
| Finland | 23 | 59.6 | 11 | 61.8 | 1 | 100 | 31 | 24.4 |
| France | 30 | 50.7 | 7 | 67.6 | 1 | 100 | 8 | 81 |
| Germany | 32 | 29.5 | 26 | 43.8 | 1 | 100 | 26 | 43.6 |
| Greece | 7 | 84.5 | 30 | 26.5 | 1 | 100 | 29 | 38.8 |
| Hungary | 5 | 88.3 | 15 | 58.9 | 31 | 19.7 | 22 | 52.5 |
| Iceland | 16 | 73.2 | 22 | 52.5 | 1 | 100 | 2 | 95.3 |
| Ireland | 29 | 52.5 | 3 | 84.9 | 1 | 100 | 14 | 73 |
| Italy | 21 | 62.4 | 12 | 60.3 | 1 | 100 | 18 | 60.4 |
| Latvia | 13 | 77.4 | 24 | 46.5 | 1 | 100 | 32 | 23.8 |
| Lithuania | 12 | 78.1 | 28 | 40.8 | 1 | 100 | 21 | 53.2 |
| Luxembourg | 31 | 36.8 | 18 | 55.3 | 1 | 100 | 13 | 75.3 |
| Malta | 3 | 93.8 | 9 | 64.1 | 1 | 100 | 16 | 68.7 |
| Netherlands | 26 | 57.3 | 23 | 48.5 | 31 | 19.7 | 9 | 80.4 |
| Norway | 22 | 61.1 | 4 | 70.8 | 1 | 100 | 1 | 100 |
| Poland | 17 | 72.6 | 27 | 41.8 | 1 | 100 | 28 | 39.9 |
| Portugal | 25 | 58.2 | 14 | 59.5 | 1 | 100 | 30 | 31.9 |
| Romania | 2 | 97.7 | 21 | 53.3 | 1 | 100 | 17 | 65.8 |
| Slovak Republic | 4 | 90.5 | 31 | 26.5 | 1 | 100 | 20 | 56.9 |
| Slovenia | 14 | 77.1 | 2 | 99.1 | 1 | 100 | 6 | 82 |
| Spain | 27 | 54.9 | 5 | 69.4 | 1 | 100 | 3 | 93.5 |
| Sweden | 19 | 65.5 | 20 | 53.4 | 1 | 100 | 12 | 76.6 |
| Switzerland | 10 | 81 | 29 | 29.4 | 1 | 100 | 24 | 46 |
| Turkey | 11 | 80 | 16 | 55.9 | 1 | 100 | 24 | 46 |
| United Kingdom | 20 | 63.4 | 13 | 60.3 | 1 | 100 | 10 | 79.3 |
Top Statutory Personal Income Tax Rate
Most countries’ income tax systems have a progressive taxA progressive tax is one where the average tax burden increases with income. High-income families pay a disproportionate share of the tax burden, while low- and middle-income taxpayers shoulder a relatively small tax burden. structure. This means that, as individuals earn more income, they move into tax bracketsA tax bracket is the range of incomes taxed at given rates, which typically differ depending on filing status. In a progressive individual or corporate income tax system, rates rise as income increases. There are seven federal individual income tax brackets; the federal corporate income tax system is flat. with higher tax rates. The top statutory personal income tax rate is the top tax rate on all income over a certain level.
Countries with high top statutory personal income tax rates receive a worse score on the ETPS than countries with lower top rates. Denmark has the highest top personal income tax rate, at 55.9 percent, followed by France at 55.4 percent and Austria at 55 percent. Bulgaria and Romania have the lowest, both at 10 percent.[22]
If countries do not apply a social contribution ceiling, or social contributions still apply at the top rate threshold, then the ETPS takes into account the combined tax rate including employee social contributions. For example, Belgium and Slovenia both apply combined top rates above 60 percent, resulting in worse scores on the ETPS.[23]
Income Level at Which Top Statutory Personal Income Tax Rate Applies
The level at which the top statutory personal income tax rate first applies is also important. Countries with top statutory personal income tax rates that apply at lower levels score better on the ETPS. The ETPS bases its measure on the income level at which the top rate first applies as compared to the country’s average income. According to this measure, Austria applies its top tax rate at the highest level of income (the top personal income tax rate applies at 17.8 times the average Austrian income), whereas Bulgaria and Hungary apply their top rates on the first euro, with flat personal income taxes of 10 and 15 percent, respectively.[24]
The Economic Cost of Labor Taxation
One way to examine the efficiency of labor taxation in a country is to control for the level of labor taxation using the marginal tax wedge.[25] The marginal tax wedge influences the choice to earn another euro of income while the average tax wedge measures the tax burden at the current income level.[26] A higher ratio means that as one earns more income, the influence of the tax system on those decisions, and the related economic losses, grows. A lower ratio means that individuals can decide to work more without the tax system changing their decisions.
The ETPS gives countries with high ratios a worse score due to the larger impact that those systems have on workers’ decisions. Hungary has a ratio of 1, meaning the next euro earned always faces the same tax burden as current earnings. This is because Hungary operates a perfectly flat income tax system, so the marginal and average tax rateThe average tax rate is the total tax paid divided by taxable income. While marginal tax rates show the amount of tax paid on the next dollar earned, average tax rates show the overall share of income paid in taxes. are always identical. Bulgaria (0.99) and Romania (1.01) also have flat income tax rates, but the social contribution ceiling or personal allowance in these countries make their labor taxation slightly more regressive for Bulgaria and more progressive for Romania. In contrast, the highest ratios are found in Spain (2.05), the Netherlands (2.01), and Italy (2.00). The average across ETPS countries is 1.50.[27]
Complexity
Complexity is measured by the existence of any surtax on personal income. This measure indicates a non-standard approach to the taxation of labor income and a less transparent personal income tax system. The ETPS penalizes countries with surtaxes.
Two ETPS countries levy a surtax on personal income: Germany and Luxembourg. Germany levies a 5.5 percent solidarity surcharge on income tax paid in excess of EUR 18,130, equivalent to labor income above EUR 96,409 for single filers, increasing its top marginal income tax rate from 45 percent to 47.475 percent. Luxembourg levies a solidarity tax at 7 percent of taxes for taxpayers earning less than EUR 150,000 and at 9 percent on taxes on personal income above that threshold. Croatia abolished its municipal surtax in 2025, instead letting local governments directly set their own tax rates on personal income within limits.
Capital Gains and Dividends Taxes
Capital gains taxes and personal dividend taxes are forms of double taxationDouble taxation is when taxes are paid twice on the same dollar of income, regardless of whether that’s corporate or individual income. of corporate profits that contribute to the tax burden on capital. When a corporation makes a profit, it pays corporate income tax. It can then generally do one of two things. The corporation can retain the after-tax profits, which boosts the value of the business and thus its stock price. Stockholders then sell the stock and realize a capital gain, which requires them to pay tax on that income. Alternatively, the corporation can distribute the after-tax profits to shareholders in the form of dividends. Stockholders who receive dividends then pay dividends tax on that income. Generally, higher dividends and capital gains taxes create a bias against saving and investment, reduce capital formation, and slow economic growth.[28]
In the ETPS, a country receives a better score for lower capital gains and dividends taxes.
Capital Gains Tax Rates
Countries generally tax capital gains at a lower rate than ordinary income, provided that specific requirements are met. The ETPS gives countries with higher capital gains tax rates a worse score than those with lower rates.
Denmark has the highest capital gains tax rate in the ETPS at 42 percent. Belgium, Cyprus, Greece, Luxembourg, Malta, Slovakia, Slovenia, Switzerland, and Turkey do not tax long-term capital gains from the sale of listed shares.[29]
Dividend Tax Rates
Dividend taxes can adversely impact capital formation in a country. Countries’ rates are expressed as the top marginal personal dividend tax rate after any imputation or credit system.
Countries with lower overall dividend tax rates score better on the ETPS due to the dividend tax rate’s effect on the cost of investment (i.e., the cost of capital) and the more neutral treatment between saving and consumption. Ireland has the highest dividend tax rate in the ETPS at 51 percent. Estonia and Latvia have dividend tax rates of 0 percent due to their cash-flow corporate tax systems. Malta imposes effective tax rates on dividends of 0 percent or below due to its dividend imputation system. The ETPS average is 21.9 percent.[30]
Consumption Taxes
Consumption taxes are levied on individuals’ purchases of goods and services. In the EU, the value-added tax is the most common general consumption tax.[31] Most general consumption taxes either do not tax intermediate business inputs or allow a credit for taxes already paid on them, which makes them one of the most economically efficient means of raising tax revenue.
A country’s consumption tax score is broken down into three subcategories: the tax rate, the tax base, and complexity. Table 5 displays the ranks and scores for the consumption taxes category.
Consumption Tax Rate
Ideally, a VAT should be levied at the standard rate on all final consumption. Countries with lower consumption tax rates score better than those with higher tax rates.
The average general consumption tax rate in the ETPS is 21.5 percent. Hungary has the highest tax rate at 27 percent while Switzerland has the lowest tax rate at 8.1 percent.[32]
Table 5. Consumption Taxes
| Country | Overall Rank | Overall Score | Rate Rank | Rate Score | Base Rank | Base Score |
|---|---|---|---|---|---|---|
| Austria | 6 | 56.3 | 7 | 46.5 | 20 | 60.8 |
| Belgium | 16 | 44.9 | 7 | 46.5 | 30 | 35.9 |
| Bulgaria | 9 | 51.2 | 7 | 46.7 | 12 | 72.1 |
| Croatia | 27 | 34.6 | 12 | 42.3 | 24 | 57.7 |
| Cyprus | 3 | 66 | 7 | 46.7 | 19 | 62.6 |
| Czech Republic | 20 | 42.4 | 27 | 24.4 | 17 | 65.2 |
| Denmark | 15 | 46.3 | 4 | 51.2 | 3 | 83.4 |
| Estonia | 13 | 47.9 | 12 | 42.3 | 26 | 53.1 |
| Finland | 24 | 38.3 | 27 | 24.4 | 2 | 86.8 |
| France | 21 | 42.3 | 24 | 28.8 | 4 | 83.2 |
| Germany | 5 | 58.7 | 31 | 22.1 | 7 | 75.5 |
| Greece | 26 | 35.8 | 7 | 46.7 | 29 | 46.3 |
| Hungary | 32 | 24.7 | 4 | 51.2 | 14 | 70 |
| Iceland | 18 | 42.6 | 24 | 28.8 | 21 | 60.8 |
| Ireland | 30 | 31.7 | 32 | 15.4 | 23 | 60.4 |
| Italy | 31 | 29.4 | 24 | 28.8 | 11 | 73.4 |
| Latvia | 8 | 51.7 | 20 | 33.3 | 28 | 46.6 |
| Lithuania | 12 | 48.1 | 18 | 37.8 | 31 | 35.8 |
| Luxembourg | 2 | 82.2 | 12 | 42.3 | 13 | 70.3 |
| Malta | 4 | 60 | 12 | 42.3 | 18 | 63.6 |
| Netherlands | 7 | 53.4 | 2 | 60.2 | 1 | 100 |
| Norway | 19 | 42.6 | 3 | 55.7 | 16 | 65.7 |
| Poland | 29 | 31.9 | 12 | 42.3 | 10 | 73.4 |
| Portugal | 14 | 46.6 | 27 | 24.4 | 5 | 80 |
| Romania | 28 | 33.2 | 20 | 33.3 | 27 | 47 |
| Slovak Republic | 25 | 36.2 | 20 | 33.3 | 8 | 74.2 |
| Slovenia | 17 | 42.9 | 4 | 51.2 | 32 | 22.8 |
| Spain | 11 | 49.5 | 20 | 33.3 | 25 | 54.9 |
| Sweden | 22 | 42.1 | 18 | 37.8 | 22 | 60.7 |
| Switzerland | 1 | 100 | 12 | 42.3 | 15 | 66.2 |
| Turkey | 10 | 50.8 | 27 | 24.4 | 6 | 79.1 |
| United Kingdom | 23 | 40 | 1 | 100 | 9 | 73.8 |
Consumption Tax Base
While a VAT should be levied on all final consumption, many countries’ consumption tax bases are far from this ideal. Many countries exempt certain goods and services from the VAT or tax them at a reduced rate.
VAT/Sales Tax Exemption Threshold
Most ETPS countries set exemption thresholds for their VATs/sales taxes. If a business is below a certain annual revenue threshold, it is not required to participate in the VAT system.
Countries receive better scores for lower thresholds. Romania receives the worst threshold score with a VAT threshold of RON 395,000—or around EUR 170,000 in purchasing power parity (PPP).[33] Spain and Turkey receive the best scores for having no general VAT/sales tax exemption threshold. The average across ETPS countries that have a VAT threshold is approximately EUR 63,000 (PPP).[34]
Consumption Tax Base as a Percent of Total Consumption
One way to measure a country’s VAT base is the VAT revenue ratio. This ratio looks at the difference between the VAT revenue actually collected and collectable VAT revenue under a VAT that was applied at the standard rate on all final consumption. The difference in actual and potential VAT revenues is due to 1) policy choices to exempt certain goods and services from VAT or tax them at a reduced rate,[35] and 2) a lack of VAT compliance.[36] Countries with tax base ratios near 1—signifying a pure tax base—score better.
Under this measure, Luxembourg has the broadest tax base, covering 82.2 percent of total consumption. Estonia and Croatia follow with ratios of 0.70 and 0.68, respectively. Turkey (0.41), Greece (0.43), and Italy (0.43) have the worst ratios. The ETPS average tax base ratio is 0.56.[37]
Property Taxes
Property taxes are government levies on the assets of an individual or business. The methods and intervals of collection vary widely among the types of property taxes. Estate and inheritance taxes, for example, are due upon the death of an individual and the passing of his or her estate to an heir. Taxes on real property, on the other hand, are paid at set intervals—often annually—on the value of taxable property such as land and real estate.
Table 6 shows the ranks and scores for the property taxes category and each of its subcategories, which are real property taxes, wealth and estate taxes, and capital and transaction taxes.
Real Property Taxes
Real property taxes are levied on a recurrent basis on taxable property. For example, in most German federal states, businesses and individuals pay a property tax to their municipality based on the value of their real property.
Structure of Property Taxes
Although taxes on real property are generally an efficient way to raise revenue, some real property taxes can become direct taxes on capital. This occurs when a tax applies to more than just the value of the land itself, such as the buildings or structures on the land. This increases the cost of capital, discourages the formation of capital (such as the building of structures), and can negatively impact business location decisions.
When a business wants to improve its property through renovations or expanding a factory, a property tax that applies to both the land and those improvements directly increases the costs of those improvements. However, a tax that just applies to the value of the land would not create an incentive against property improvements.
Countries that tax the value of structures and buildings as well as land receive the worst scores on the ETPS. Some countries mitigate this treatment with a deduction for property taxes paid against corporate taxable income. These countries receive slightly better scores. Countries receive the best possible score if they either have no property tax or only tax land.
Table 6. Property Taxes
| Country | Overall Rank | Overall Score | Real Property Taxes Rank | Real Property Taxes Score | Wealth/Estate Taxes Rank | Wealth/Estate Taxes Score | Capital/Transaction Taxes Rank | Capital/Transaction Taxes Score |
|---|---|---|---|---|---|---|---|---|
| Austria | 24 | 50.6 | 5 | 60.1 | 9 | 70.2 | 28 | 45.2 |
| Belgium | 26 | 48.1 | 5 | 60.1 | 9 | 70.2 | 22 | 49.4 |
| Bulgaria | 10 | 64.4 | 29 | 19.2 | 1 | 100 | 13 | 64.5 |
| Croatia | 10 | 64.4 | 4 | 59.6 | 28 | 48.7 | 22 | 49.4 |
| Cyprus | 3 | 84.7 | 4 | 59.6 | 9 | 70.2 | 5 | 79.4 |
| Czech Republic | 7 | 70.6 | 4 | 59.6 | 9 | 70.2 | 5 | 79.4 |
| Denmark | 10 | 64.4 | 1 | 100 | 1 | 100 | 22 | 49.4 |
| Estonia | 1 | 100 | 4 | 59.6 | 9 | 70.2 | 1 | 100 |
| Finland | 18 | 59.9 | 4 | 59.6 | 9 | 70.2 | 5 | 79.4 |
| France | 26 | 48.1 | 1 | 100 | 1 | 100 | 1 | 100 |
| Germany | 10 | 64.4 | 4 | 59.6 | 9 | 70.2 | 19 | 64.4 |
| Greece | 22 | 54.1 | 4 | 59.6 | 28 | 48.7 | 22 | 49.4 |
| Hungary | 20 | 55.3 | 4 | 59.6 | 9 | 70.2 | 5 | 79.4 |
| Iceland | 29 | 40.5 | 4 | 59.6 | 9 | 70.2 | 27 | 45.4 |
| Ireland | 18 | 59.9 | 4 | 59.6 | 9 | 70.2 | 22 | 49.4 |
| Italy | 32 | 27.5 | 29 | 19.2 | 9 | 70.2 | 13 | 64.5 |
| Latvia | 5 | 74.4 | 4 | 59.6 | 9 | 70.2 | 19 | 64.4 |
| Lithuania | 7 | 70.6 | 29 | 19.2 | 28 | 48.7 | 28 | 45.3 |
| Luxembourg | 15 | 59.9 | 4 | 59.6 | 1 | 100 | 5 | 79.4 |
| Malta | 2 | 89.2 | 4 | 59.6 | 9 | 70.2 | 1 | 100 |
| Netherlands | 15 | 59.9 | 4 | 59.6 | 9 | 70.2 | 13 | 64.5 |
| Norway | 14 | 60 | 1 | 100 | 1 | 100 | 19 | 64.4 |
| Poland | 25 | 49.6 | 4 | 59.6 | 9 | 70.2 | 13 | 64.5 |
| Portugal | 15 | 59.9 | 4 | 59.6 | 27 | 57.1 | 5 | 79.4 |
| Romania | 4 | 80.7 | 4 | 59.6 | 9 | 70.2 | 31 | 30.3 |
| Slovak Republic | 6 | 71.6 | 4 | 59.6 | 9 | 70.2 | 13 | 64.5 |
| Slovenia | 28 | 45.1 | 4 | 59.6 | 1 | 100 | 1 | 100 |
| Spain | 30 | 39.6 | 4 | 59.6 | 1 | 100 | 12 | 70 |
| Sweden | 9 | 69.9 | 29 | 19.2 | 9 | 70.2 | 5 | 79.4 |
| Switzerland | 31 | 35.1 | 4 | 59.6 | 31 | 27.2 | 28 | 45.3 |
| Turkey | 23 | 54.1 | 4 | 59.6 | 1 | 100 | 13 | 64.5 |
| United Kingdom | 20 | 55.3 | 4 | 59.6 | 31 | 27.2 | 31 | 30.3 |
Every ETPS country except Cyprus and Malta applies recurrent taxes to real property. Estonia is the only country with a property tax that is levied only on the value of land, which excludes the value of any buildings or structures on the land.[38] Of the 29 ETPS countries with taxes on all capital, 25 allow for a deduction against corporate taxable income.[39] Only Austria, Iceland, Italy, and Slovenia do not allow businesses to deduct their property tax liability, leading to double taxation of business assets. Croatia was the latest ETPS country to introduce a recurrent property tax in 2025.
Wealth and Estate Taxes
Many countries also levy property taxes on an individual’s wealth. These taxes can take the form of estate or inheritance taxes that are levied either upon an individual’s estate at death or upon the assets transferred from the decedent’s estate to the heirs. These taxes can also take the form of a recurring tax on an individual’s wealth. Estate and inheritance taxes limit resources available for investment or production and reduce the incentive to save and invest.[40] This reduction in investment adversely affects economic growth. Moreover, these taxes, the estate and inheritance taxAn inheritance tax is levied upon the value of inherited assets received by a beneficiary after a decedent’s death. Not to be confused with estate taxes, which are paid by the decedent’s estate based on the size of the total estate before assets are distributed, inheritance taxes are paid by the recipient or heir based on the value of the bequest received. especially, can be avoided with certain planning techniques, which makes the tax an inefficient and unnecessarily complex source of revenue.
Wealth Taxes
In addition to estate and inheritance taxes, some countries levy wealth taxes. Wealth taxes are often low-rate, progressive taxes on an individual’s or family’s assets or the assets of a corporation. Unlike estate taxes, wealth taxes are levied on an annual basis. While some countries levy a comprehensive tax on net wealth, others limit their wealth taxes to selected assets, such as security accounts, financial assets held abroad, or real estate.
Three countries levy net wealth taxes: Norway, Spain, and Switzerland. Belgium, France, and Italy impose wealth taxes on selected assets. Countries with no wealth tax receive the best score, countries with wealth taxes on selected assets receive an average score, and countries with net wealth taxes receive the lowest score.[41]
Estate, Inheritance, and Gift Taxes
Estate taxes are levied on the value of an individual’s taxable estate at the time of death and are paid by the estate itself, while inheritance taxes are levied on the value of assets transferred to an individual’s heirs upon death and are paid by the heirs (not the estate of the deceased individual). Gift taxes are taxes on the transfer of property (cash, stocks, and other property) that are typically used to prevent individuals from circumventing estate and inheritance taxes by gifting away their assets before death.
Rates, exemption levels, and rules vary substantially among countries. In Italy, for example, exemptions of up to EUR 1 million may apply for bequests to close relatives. Belgium’s Brussels capital region, on the other hand, has an inheritance tax with an exemption of EUR 15,000 and a variety of tax rates depending on who receives assets from the estate and what the assets are.[42]
Estate, inheritance, and gift taxes create significant compliance costs for taxpayers while raising insignificant amounts of revenue.
According to OECD data for 2023, estate, inheritance, and gift taxes across the OECD raised an average of 0.14 percent of GDP in tax revenue. The highest amount was raised in France, at only 0.8 percent of GDP, despite France’s top inheritance tax rate of up to 60 percent in some cases.[43]
Countries without these taxes score better than countries that have them. Nine countries in the ETPS have no estate, inheritance, or gift taxes: Austria, Cyprus, Estonia, Latvia, Malta, Norway, Romania, Slovakia, and Sweden. All others levy an estate, inheritance, or gift tax.[44]
Capital, Wealth, and Property Taxes on Businesses
There are various taxes countries levy on the assets and fixed capital of businesses. These include taxes on the transfer of real property, taxes on the net assets of businesses, taxes on raising capital, and taxes on financial transactions. These taxes contribute directly to the cost of capital for businesses and reduce the after-tax rate of return on investment.
Property Transfer Taxes
Property transfer taxes are taxes on the transfer of real property (real estate, land improvements, machinery) from one person or firm to another. A common example in the United Kingdom is the stamp duty land tax which is commonly levied on the value of homes that are purchased by individuals.[45] Property transfer taxes represent a direct tax on capital and increase the cost of purchasing property.
Countries receive a worse score if they have property transfer taxes. Four ETPS countries do not have property transfer taxes: the Czech Republic, Estonia, Lithuania, and Slovakia.[46]
Corporate Asset Taxes
Similar to wealth taxes, asset taxes are levied on the wealth, or assets, of a business. For instance, Luxembourg levies a 0.5 percent tax on the worldwide net wealth of nontransparent Luxembourg-based companies every year.[47] Similarly, cantons in Switzerland levy taxes on the net assets of corporations, varying from 0.001 percent to 0.5 percent of corporate net assets.[48] Other countries levy these taxes exclusively on bank assets.
Fifteen ETPS countries have some type of corporate wealth or asset tax. Fourteen of these countries have bank taxes of some kind.[49]
Capital Duties
Capital duties are taxes on the issuance of shares of stock. Typically, countries either levy these taxes at very low rates or require a small, flat fee. For example, Switzerland requires resident companies to pay a 1 percent tax on the issuance of shares of stock.[50] These types of taxes increase the cost of capital, limit funds available for investment, and make it more difficult to form businesses.[51]
Countries with capital duties score worse than countries without them. Seven countries in the ETPS levy some type of capital duty.[52]
Financial Transaction Taxes
A financial transaction tax is a levy on the sale or transfer of a financial asset. Financial transaction taxes take different forms in different countries. Finland levies a tax of 1.6 percent on the transfer of Finnish securities. On the other hand, Poland levies a 1 percent stamp duty on exchanges of property rights based on the transaction value. For transactions on a stock exchange, the tax is the responsibility of the buyer.[53]
Financial transaction taxes impose an additional layer of taxation on the purchase or sale of stocks. Markets run on efficiency, and capital needs to flow quickly to its most economically productive use. A financial transaction tax impedes this process.[54]
The ETPS ranks countries with financial transaction taxes worse than countries without them. Fourteen countries in the ETPS have financial transaction taxes, including France and the United Kingdom, while 18 countries do not impose financial transaction taxes.[55]
Cross-Border Tax Rules
In an increasingly globalized economy, businesses often expand beyond the borders of their home countries to reach customers and build supply chains around the world. Countries have defined rules that determine how, or if, corporate income earned in foreign countries is taxed domestically. Cross-border tax rules comprise the systems and regulations that countries apply to those business activities.
Table 7 displays the overall rank and score for the cross-border tax rules category as well as the ranks and scores for the subcategories, including dividends and capital gains exemptions (territoriality), withholding taxes, tax treaties, and anti-tax avoidance rules.
Territoriality
Under a territorial tax system, multinational businesses pay taxes to the countries in which they earn their income. This means that territorial tax regimes do not generally tax corporate income earned in foreign countries. A worldwide tax systemA worldwide tax system for corporations, as opposed to a territorial tax system, includes foreign-earned income in the domestic tax base. As part of the 2017 Tax Cuts and Jobs Act (TCJA), the United States shifted from worldwide taxation towards territorial taxation.—such as the system previously employed by the United States—requires companies to pay taxes on worldwide income, regardless of where it is earned. Several countries—as is now the case in the US—operate some sort of hybrid system. In the ETPS, Croatia and Poland are the only countries to levy worldwide taxes on capital gains.
Countries enact territorial tax systems through so-called “participation exemptions,” which include full or partial exemptions for foreign-earned dividends or capital gains income (or both). Participation exemptions eliminate the additional domestic tax on foreign income by allowing companies to exclude—some or all—foreign income from their taxable income. A pure territorial system fully exempts foreign-sourced dividends and capital gains income.
Companies based in countries with worldwide tax systems are at a competitive disadvantage because they face potentially higher levels of taxation than their competitors based in countries with territorial tax systems. Additionally, taxes on repatriated corporate income in a company’s home country increase complexity and discourage investment and production.[56]
The territoriality of a tax system is measured by the degree to which a country exempts foreign-sourced income through dividend and capital gains exemptions.
Table 7. Cross-Border Taxes Rules
| Country | Overall Rank | Overall Score | Div/Cap Gains Exemption Rank | Div/Cap Gains Exemption Score | Withholding Taxes Rank | Withholding Taxes Score | Tax Treaties Rank | Tax Treaties Score | Anti-Tax Avoidance Rank | Anti-Tax Avoidance Score |
|---|---|---|---|---|---|---|---|---|---|---|
| Austria | 15 | 64.5 | 1 | 100 | 19 | 62.2 | 10 | 58.5 | 3 | 70.2 |
| Belgium | 21 | 53.4 | 1 | 100 | 15 | 65.6 | 1 | 100 | 16 | 41.1 |
| Bulgaria | 20 | 54.8 | 1 | 100 | 21 | 60.7 | 11 | 58.6 | 24 | 26 |
| Croatia | 30 | 43.6 | 1 | 100 | 32 | 25.7 | 7 | 64.3 | 24 | 26 |
| Cyprus | 13 | 66.2 | 12 | 79.3 | 9 | 79.1 | 25 | 41.2 | 24 | 26 |
| Czech Republic | 10 | 70.3 | 27 | 60 | 12 | 66.8 | 24 | 42.2 | 24 | 26 |
| Denmark | 31 | 42.7 | 1 | 100 | 4 | 97.7 | 26 | 35.4 | 24 | 26 |
| Estonia | 9 | 71.1 | 12 | 79.3 | 18 | 62.8 | 5 | 67.2 | 10 | 42.9 |
| Finland | 19 | 56.5 | 12 | 79.3 | 28 | 41.6 | 20 | 47 | 24 | 26 |
| France | 14 | 64.6 | 12 | 79.3 | 5 | 91.1 | 27 | 33.5 | 3 | 64.7 |
| Germany | 12 | 66.6 | 12 | 79.3 | 14 | 66.5 | 20 | 47 | 18 | 34.5 |
| Greece | 26 | 49 | 30 | 47.1 | 22 | 58.2 | 2 | 91.3 | 24 | 26 |
| Hungary | 4 | 84.3 | 25 | 70.6 | 17 | 65.3 | 7 | 64.3 | 10 | 42.9 |
| Iceland | 27 | 48 | 12 | 79.3 | 15 | 66.2 | 30 | 28.7 | 10 | 42.9 |
| Ireland | 24 | 50 | 1 | 100 | 1 | 100 | 15 | 52.8 | 10 | 42.9 |
| Italy | 25 | 49.6 | 1 | 100 | 23 | 56.9 | 32 | 18.1 | 8 | 47.8 |
| Latvia | 8 | 74.8 | 12 | 79.3 | 26 | 46.6 | 23 | 44.1 | 10 | 42.9 |
| Lithuania | 18 | 59.7 | 28 | 49.9 | 30 | 38.7 | 4 | 72 | 18 | 34.5 |
| Luxembourg | 5 | 81.7 | 12 | 79.3 | 1 | 100 | 27 | 33.5 | 3 | 64.7 |
| Malta | 7 | 78.1 | 12 | 79.3 | 11 | 70.5 | 30 | 28.7 | 3 | 64.7 |
| Netherlands | 3 | 87.4 | 1 | 100 | 6 | 88.3 | 14 | 56.6 | 10 | 42.9 |
| Norway | 16 | 60 | 12 | 79.3 | 1 | 100 | 18 | 50.8 | 8 | 47.8 |
| Poland | 32 | 42.6 | 1 | 100 | 6 | 88.3 | 6 | 66.3 | 10 | 42.9 |
| Portugal | 28 | 45.3 | 26 | 62.9 | 8 | 80.5 | 15 | 52.8 | 18 | 34.5 |
| Romania | 17 | 59.9 | 31 | 39.3 | 24 | 51.2 | 13 | 57.6 | 18 | 34.5 |
| Slovak Republic | 22 | 53.4 | 12 | 79.3 | 31 | 38.1 | 19 | 48 | 18 | 34.5 |
| Slovenia | 29 | 44.1 | 12 | 79.3 | 13 | 66.6 | 11 | 58.6 | 24 | 26 |
| Spain | 23 | 52.5 | 12 | 79.3 | 29 | 40.4 | 22 | 45.1 | 6 | 56.2 |
| Sweden | 11 | 67.7 | 32 | 30.9 | 18 | 62.8 | 29 | 30.6 | 2 | 72.2 |
| Switzerland | 1 | 100 | 28 | 49.9 | 25 | 48.5 | 7 | 64.3 | 10 | 42.9 |
| Turkey | 6 | 79.5 | 1 | 100 | 10 | 76.6 | 15 | 52.8 | 24 | 26 |
| United Kingdom | 2 | 94.6 | 1 | 100 | 27 | 44.5 | 3 | 78.8 | 1 | 100 |
Dividends Received Exemption
When a foreign subsidiary of a parent company earns income, it pays corporate income tax to the country in which it does business. After paying the tax, the subsidiary can either reinvest its profits into ongoing activities (by purchasing equipment or hiring more workers, for example) or it can distribute its profits back to the parent company in the form of dividends.
Under a worldwide tax system, the dividends received by a parent company are taxed again by the parent company’s home country, minus a tax credit for taxes already paid on that income. Under a pure territorial system, those dividends are exempt from taxation in the parent’s country.
Countries receive a score based on the level of dividend exemption they provide. Countries with no dividend exemption (worldwide tax systems) receive the worst score.
Twenty-six ETPS countries exempt all foreign-sourced dividends received by parent companies from domestic taxation. Six countries allow 95 percent or 97 percent of foreign-sourced dividends to be exempt from domestic taxation. Ireland is the latest ETPS country to enact a participation exemption for dividends in 2025 and move towards a more territorial tax system.[57]
Branch or Subsidiary Capital Gains Exclusion
Another feature of an international tax system is its treatment of capital gains earned through foreign investments. When a parent company invests in a foreign subsidiary (i.e., purchases shares in a foreign subsidiary), it can realize a capital gain on that investment if it later divests the asset. A territorial tax system would exempt these gains from domestic taxation, as they are derived from overseas activity.
Taxing foreign-sourced capital gains income at domestic tax rates can discourage saving and investment.
Countries that exempt foreign-sourced capital gains from domestic taxation receive a better score on the ETPS. Foreign-sourced capital gains are fully excluded from domestic taxation in 25 ETPS countries. Five countries partially exclude foreign-sourced capital gains. Poland and Croatia do not exclude foreign-sourced capital gains income from domestic taxation.[58]
Restrictions on Eligible Countries
An ideal territorial system would only concern itself with the profits earned within the home country’s borders. However, many countries have restrictions on their territorial systems that determine when a business’ dividends or capital gains received from foreign subsidiaries are exempt from domestic tax.
Some countries treat foreign corporate income differently depending on the country in which the foreign income was earned. For example, several countries restrict their territorial systems based on a “blacklist” of countries that do not follow certain requirements. Among EU countries, it is common to restrict the participation exemption to Member States of the European Economic Area.
The eligibility rules create additional complexity for companies and are often established arbitrarily. Portugal, for instance, limits exemptions for foreign-sourced dividends and capital gains to those earned in countries that are not listed as a tax haven and that impose an income tax listed in the EU parent-subsidiary directive or have an income tax equal to at least 60 percent of the Portuguese corporate tax rate.[59] Italy, which normally allows a 95 percent tax exemptionA tax exemption excludes certain income, revenue, or even taxpayers from tax altogether. For example, nonprofits that fulfill certain requirements are granted tax-exempt status by the Internal Revenue Service (IRS), preventing them from having to pay income tax. for foreign-sourced dividends paid to Italian shareholders, does not allow the exemption if the income was earned in a subsidiary located in a blacklisted country, unless evidence that an adequate level of taxation was borne by the foreign entity can be provided.[60]
In the ETPS, 19 of 32 countries that provide participation exemptions place restrictions on whether they exempt foreign-sourced income from domestic taxation based on the source country of the income.[61] Countries that have these restrictions on their territorial tax systems receive a worse score on the ETPS.
Withholding Taxes
When firms pay dividends, interest, and royalties to foreign investors or businesses, governments often require those firms to withhold a certain portion to pay as tax. For example, Switzerland requires businesses to withhold a maximum 35 percent tax on dividends and interest to foreign individuals unless a tax treaty provides otherwise.
These taxes make investment more costly both for investors, who will receive a lower return on dividends, and for firms, which must pay a higher amount in interest or royalty payments to compensate for the cost of the withholding taxes. These taxes also reduce funds available for investment and production and increase the cost of capital.
Countries with higher withholding tax rates on dividends, interest, and royalties score worse in the ETPS. Dividends, interest, and royalties from these countries do not always face the same tax rate as when distributed to domestic shareholders. Tax treaties between countries either reduce or eliminate withholding taxes.
While Switzerland levies the highest dividend and interest withholding rates, Estonia, Hungary, Latvia, and Malta do not levy withholding taxes on dividends or interest payments.
For royalties, Belgium requires firms to retain the highest amount, at 30 percent, followed by France and Portugal, at 25 percent. Cyprus, Hungary, Latvia, Luxembourg, Malta, the Netherlands, Norway, Sweden, and Switzerland do not require companies to retain any amount of royalties for withholding tax purposes.[62]
Tax Treaty Network
Tax treaties align many tax laws between two countries and attempt to reduce double taxation, particularly by reducing or eliminating withholding taxes between the countries. Countries with a greater number of partners in their tax treaty network have more attractive tax regimes for foreign investment and receive a better score than countries with fewer treaties.
The United Kingdom has the broadest network of tax treaties (132 countries) and thus receives the best score. Iceland receives the worst score, with a treaty network of only 47 countries. Across the ETPS, the average size of a tax treaty network is 83 countries.[63]
Anti-Avoidance Rules
Anti-avoidance rules seek to prevent corporations from minimizing their tax liability through aggressive tax planning. These rules can take several forms, such as rules for controlled foreign corporations (CFCs), thin capitalization rules, and diverted profits taxes.
Anti-avoidance rules can make countries with uncompetitive tax structures even less competitive, as these rules can add significant complexity.[64]
Controlled Foreign Corporation Rules
CFC rules are intended to prevent corporations from shifting their pretax profits from a high-tax country to a low-tax country by using highly mobile forms of income. CFC rules are generally applied in multiple steps. First, they determine whether a foreign subsidiary is deemed a “controlled foreign corporation” for tax purposes. Second, if a foreign entity is deemed “controlled,” there is an applicability test to determine whether the CFC rules apply—generally through an income test, a predefined minimum tax rate, or a black/white list for countries. Third, if both tests are passed, the CFC rules subject the foreign corporation’s passive income (rent, royalties, interest), and sometimes active income, to the tax rate of the home country of the subsidiary’s parent corporation.
CFC rules vary widely among countries. The definition of what constitutes “control” is a somewhat arbitrary decision that often increases tax code complexity. For instance, Austria considers a subsidiary to be controlled if an Austrian company owns more than 50 percent of the shares or voting rights or is entitled to more than 50 percent of its profits, while Portugal considers a foreign company to be controlled if a Portuguese resident owns, directly or indirectly, at least 25 percent of its shares.
In 2016, an EU directive established that all EU Member States tax certain multinational, non-distributed income of CFCs if the parent company located in that Member State owns more than 50 percent of the shares of the CFC, and if the tax paid by the CFC is lower than the difference between the tax paid by the CFC if it had been situated in the Member State and the tax it actually paid.[65] All EU Member States have adopted CFC rules.[66]
Each country’s score in this subcomponent is based on four aspects of CFC rules: 1) whether there are CFC rules, 2) whether CFC rules apply to passive income or all income, 3) whether there are exemptions from the general CFC rules, and 4) whether the CFC rules have a strict minimum tax component. Countries receive the best score if they do not have CFC rules. Countries with CFC rules that have exemptions or only apply to passive income or income associated with non-genuine arrangements receive a better score. Countries score the worst if they have CFC rules that apply to all income and have no exemptions.
CFC rules exist in 31 of the 32 ETPS countries, with Switzerland being the only exception. In five of the 31 countries with CFC rules, the rules capture both active and passive income, while in 10 countries, the rules have a threshold for treating all income as passive income. In the remaining 16 countries with CFC rules, they only apply to passive income or income associated with non-genuine arrangements.[67]
Interest Deduction Limitations
Many countries limit the amount of interest expenses a multinational corporation, or one of its subsidiaries, can deduct for tax purposes. Low-tax countries create an incentive for companies to finance their investments with equity, while high-tax countries create an incentive for companies to finance investments with debt and use interest deductions to reduce their tax liabilities. To prevent businesses from lending money internally from entities in low-tax jurisdictions to entities in high-tax jurisdictions for tax purposes, most countries limit the amount companies can deduct in interest.
Interest deduction limitations can vary widely among countries, and there is much discretion available to governments in enforcing these laws.[68] Some countries limit interest deductions by applying transfer pricing regulations to interest rates. Others apply what are called “thin capitalization rules,” which limit the amount of deductible interest. The two most common types used in practice are “safe harbor rules” and “earnings stripping rules.” Safe harbor rules restrict the amount of debt for which interest is tax-deductible by defining a debt-to-equity ratio. Interest paid on debt exceeding this set ratio is not tax-deductible. Earnings stripping rules limit the tax-deductible share of debt interest to pretax earnings.
Interest deduction rules, particularly thin capitalization rules, have been shown to reduce the value of firms and distort firm decisions about how to invest in capital.[69] While interest deduction limitations can be seen as a way to address the debt bias inherent to most corporate tax systems, limiting the tax deductibility of interest expenses creates new distortions if interest income continues to be fully taxed.[70]
Countries that limit interest deductions with only transfer pricing regulations receive the best score. Countries with debt-to-equity ratios receive an average score, and countries with interest-to-pretax-earning limits receive the worst score.
Interest deduction limitations are found in all 32 countries measured in the ETPS. For instance, Turkey limits interest deductions if a firm’s debt-to-equity ratio reaches 3 to 1, while Belgium allows companies to deduct intra-group loans up to a 5 to 1 ratio. Germany and Spain limit interest deductions (regardless of whether they are for cross-border loans) to 30 percent of operating income.[71]
General Anti-Tax Avoidance Rules
Many countries apply general anti-tax avoidance rules to tax multinational companies with business structures designed specifically for tax advantages rather than economic reasons. These rules often follow the substance over form principle—emphasizing the economic purpose of a transaction rather than its legal or formal aspects—in determining how profits should be taxed.
The United Kingdom applies a diverted profits tax. A diverted profits tax is a set of complex rules and penalty rates that apply if a company is found to have minimized its tax burden through a structure without economic substance. The United Kingdom applies a 25 percent rate, though companies in certain industries can face higher rates.[72] These complex tax regimes result in high compliance costs for multinational companies as well as double taxation of some corporate profits.
Anti-abuse provisions of this nature are not currently accounted for in the ETPS. However, if they were appropriately accounted for, countries like the United Kingdom would likely receive worse scores on their cross-border tax rules—potentially also impacting their overall ranking.
Stay informed on the tax policies impacting you.
Subscribe to our free newsletter to get the latest tax data, news and analysis.
SubscribeAppendix
Methodology
The ETPS is a relative ranking of the competitiveness and neutrality of the tax code in each of the 32 ETPS countries. It utilizes 40 variables across five categories: corporate income tax, individual taxes, consumption taxes, property taxes, and cross-border tax rules. Each category has multiple subcategories, and each subcategory can hold several of the 40 variables. For example, the consumption tax category contains two subcategories: rate and base. The consumption tax base subcategory then includes two variables: “VAT/sales tax threshold” and “VAT/sales tax base as a percent of total consumption.”
The ETPS is designed to measure a country’s tax code on a relative basis rather than on an absolute measurement. This means that a score of 100 does not signify the absolute best possible tax code, but the best tax code among the 32 ETPS countries. Each country’s score on the ETPS represents its relative difference from the best country’s score.
The Calculation of the Variable, Subcategory, Category, and Final Score
First, the standard deviation and average of each variable are calculated. The standard deviation measures the average difference of a country’s tax variables from the mean among all 32 countries.[73] For example, the average corporate income tax rate across the 32 ETPS countries is about 21.9 percent, with a standard deviation of 6.2 percentage points. This means that, on average, an ETPS country’s corporate tax rate is 6.2 percentage points off from the mean rate of 21.9 percent.
To compare variables with each other, it is necessary to standardize them, because each variable has a different mean and standard deviation. To standardize the variables, each observation is given a normalized score (z-score). This sets every variable’s mean to 0 with a standard deviation of 1. Each country’s score for each variable is a measure of its difference from the mean across all countries for that variable. A score of 0 means a country’s score is equal to the average, a score of -1 means it is one standard deviation below average, and a score of 1 is one standard deviation above average.
The score for the corporate tax rate demonstrates this process. As mentioned, the average corporate income tax rate among the 32 ETPS countries is 21.9 percent, and the standard deviation is 6.2 percentage points. France’s corporate tax rate normalized score is -2.28,[74] or 2.28 standard deviations less competitive than the average ETPS country. In contrast, Bulgaria’s tax rate of 10 percent is 1.9 standard deviations more competitive than the average ETPS country.
The next step is to combine variable scores to calculate subcategory scores. Within subcategories, each individual variable’s score is equally weighted and added together. For instance, the subcategory of cost recovery includes seven variables: loss carryback; loss carryforward; the present discounted value of depreciation schedules for machines, industrial buildings, and intangibles (each its own variable); inventory accounting method; and allowance for corporate equity. The scores for each of these seven variables are multiplied by 1/7, or 14.3 percent, to give them equal weight, and then added together. The result is the cost recovery subcategory score.
Calculating Subcategory Scores
From here, two transformations occur. First, to eliminate any negative values, the lowest z-score is multiplied by minus one. Then one is added to that value. For example, France has the worst z-score for the corporate income tax rate subcategory (-2.28). Thus, -2.28 multiplied by negative one is 2.28. Adding one to that product gives 3.28. Then 3.28 is added to each country’s z-score, giving the adjusted z-score. This sets the worst score in each subcategory to 1. For France, -2.28 plus 3.28 equals 1.
Second, the adjusted subcategory scores for each country are scaled to 100, relative to the country with the best score in each subcategory. This is done by taking each country’s adjusted z-score and dividing it by the best adjusted z-score in each category. For example, Hungary, which has the lowest corporate tax rate, has the best adjusted corporate rate subcategory z-score of 2.06, and receives a final subcategory score of 100.
Calculating Category Scores
The same method is used to create the category scores. First, the z-score for subcategories is averaged to create the initial category score. Then, the worst z-score is multiplied by minus one and one is added to that product. That resulting amount is added to each country’s z-score. For example, France has the worst initial corporate category score of -1.33. Thus, -1.33 multiplied by negative one is 1.33. Adding one to that product gives 2.33. Then 2.33 is added to each country’s initial category score to give the adjusted initial category score. This sets the worst score in each category to 1. For France, -1.33 plus 2.33 equals 1.
Second, the adjusted initial category scores for each country are scaled to 100, relative to the country with the best score in each category. This is done by taking each country’s adjusted initial category score and dividing it by the best adjusted initial category score in each category. For example, Latvia, which has the best corporate category score, has the best adjusted category score of 1.12, and receives a final category score of 100.
Calculating Final Scores
The same method is used to create the final score. First, the initial category scores are averaged to create the initial final score. Then, the lowest value of the initial final score is multiplied by negative one and one is added to that product. That resulting amount is added to each country’s initial final score. For example, Italy has the worst initial final score of -0.53. Thus, -0.53 multiplied by negative one is 0.53. Adding one to that product gives 1.53. Then 1.53 is added to each country’s initial final score (the adjusted initial final score). This sets the worst score in each category to 1.
Second, the adjusted initial final scores for each country are scaled to 100, relative to the country with the best score in each category. This is done by taking each country’s adjusted initial final score and dividing it by the best adjusted initial final score in each category. For example, Estonia, which has the best final score, has the best adjusted final score of 1.61, and receives a final category score of 100.
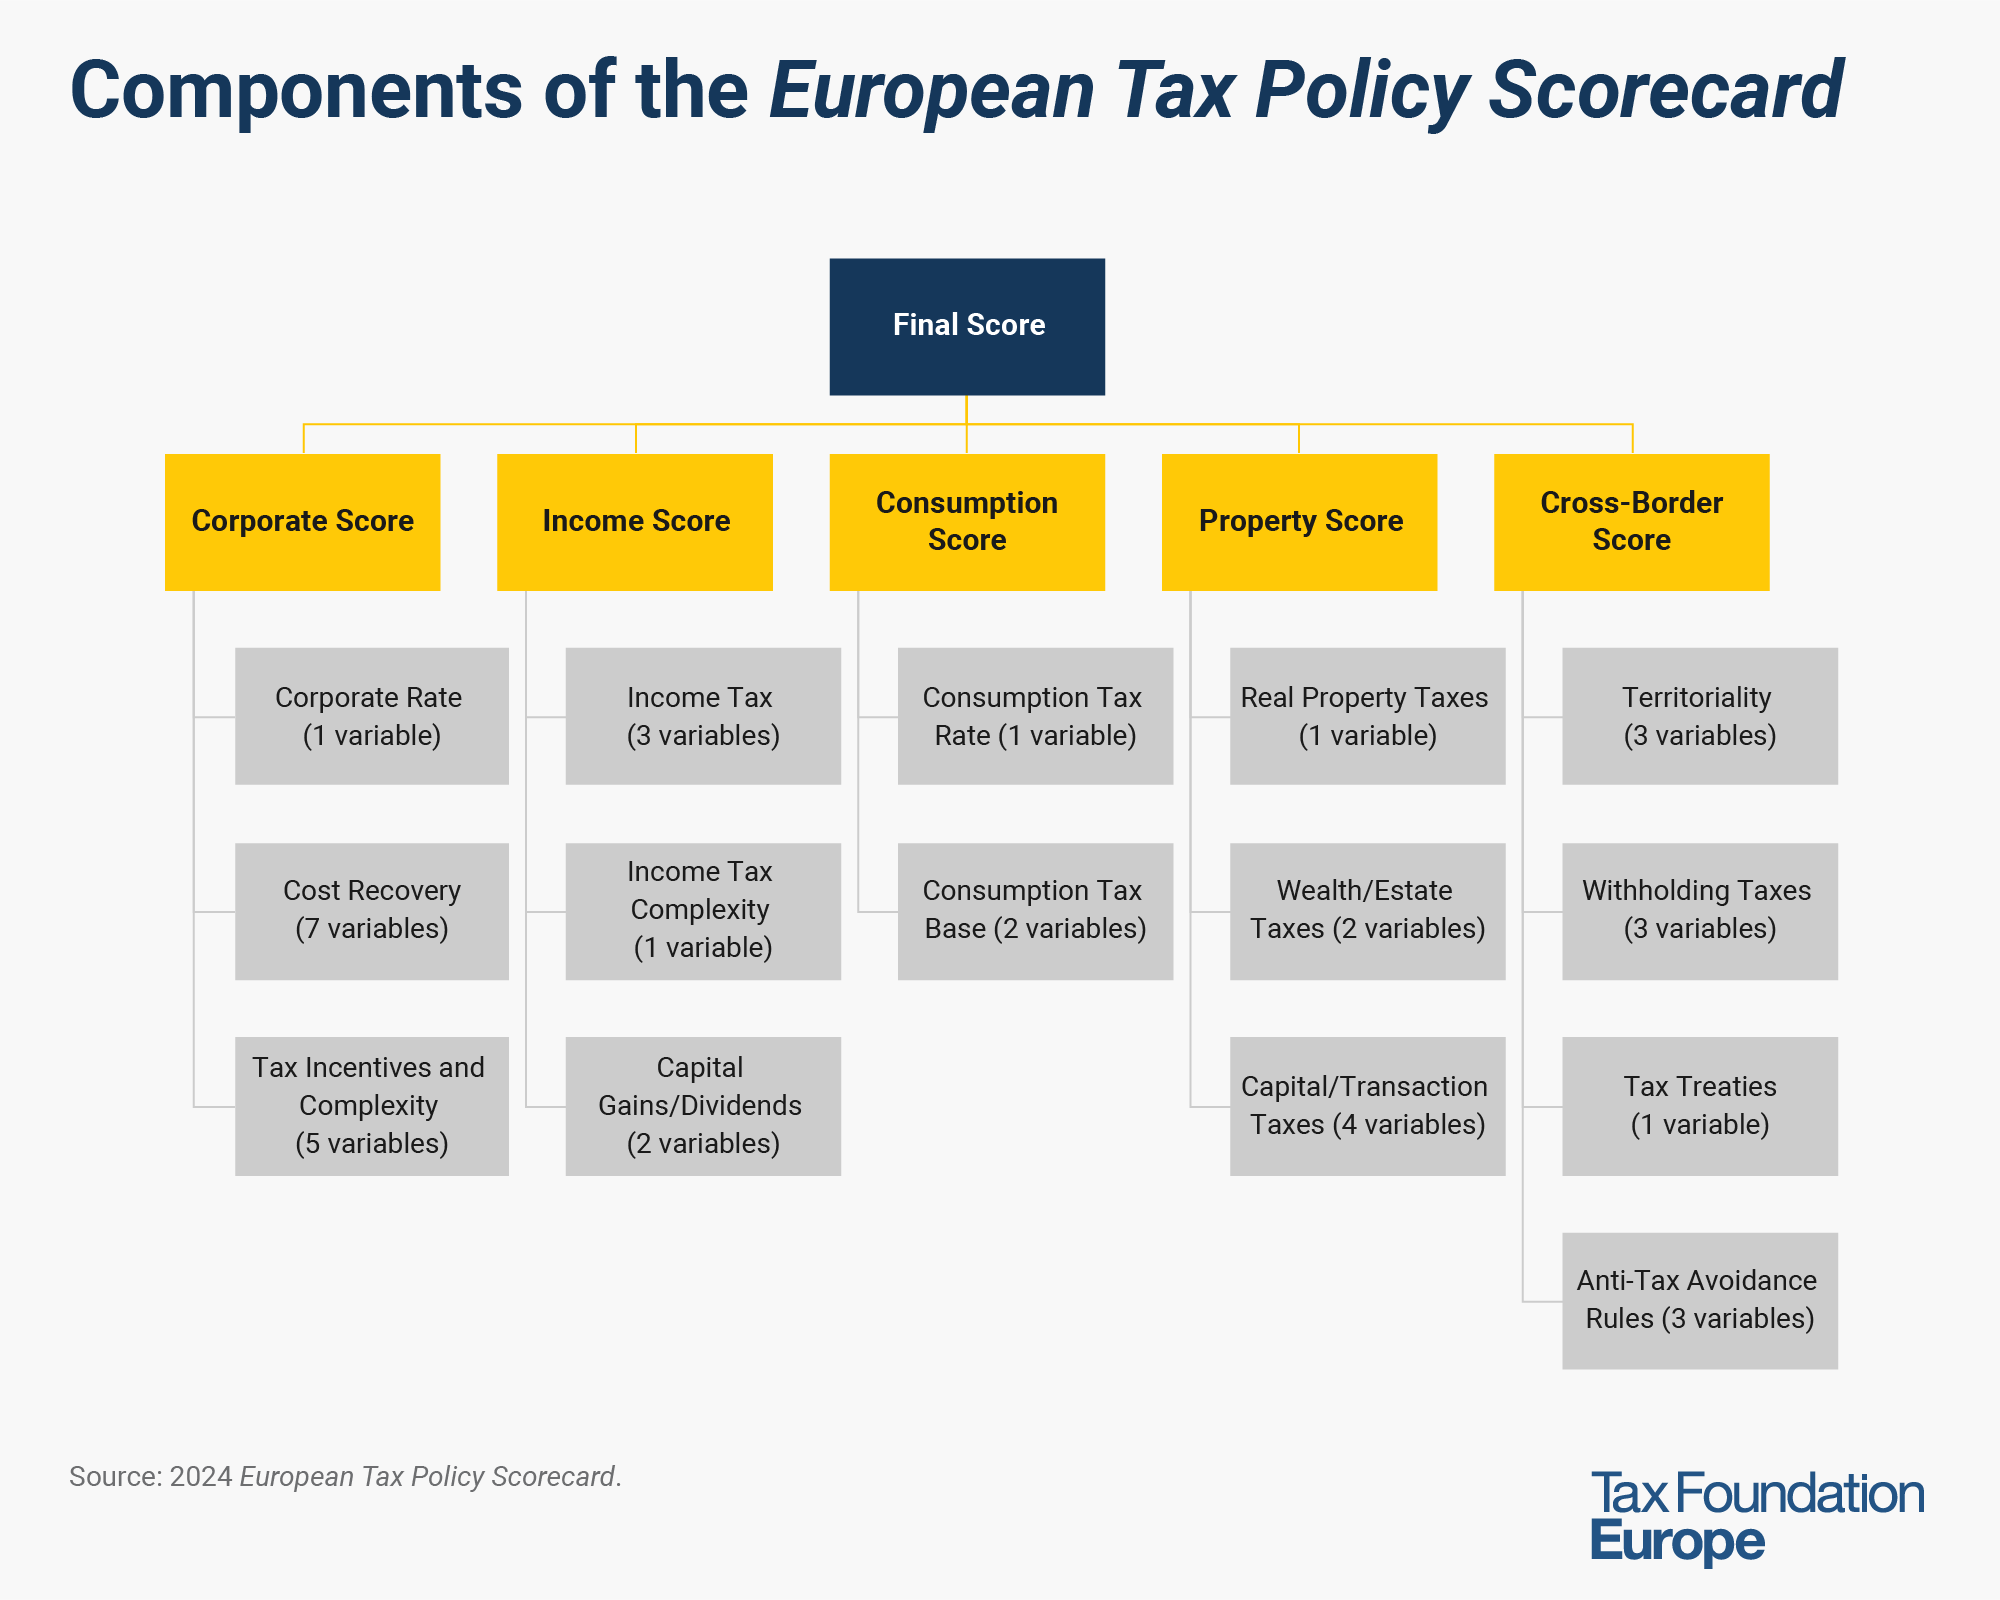
Distribution of the Final Scores
Many of the countries shown in the ETPS have final scores that are grouped closely together. Though the scores range from 100 (Estonia) to 46.6 (Itay), there are three countries with scores in the 80s and 10 countries with scores in the 60s. The closeness of some of the scores means that small differences in variable values (such as a percentage-point difference in the corporate income tax rate or size of the VAT base) can mean the difference of several rank positions.
The distribution of the scores also shows the distance between first and second place, again demonstrating how significantly different the Estonian tax system is, even relative to the ETPS country with the second most competitive and neutral tax system, Cyprus (with a final score of 96.3).
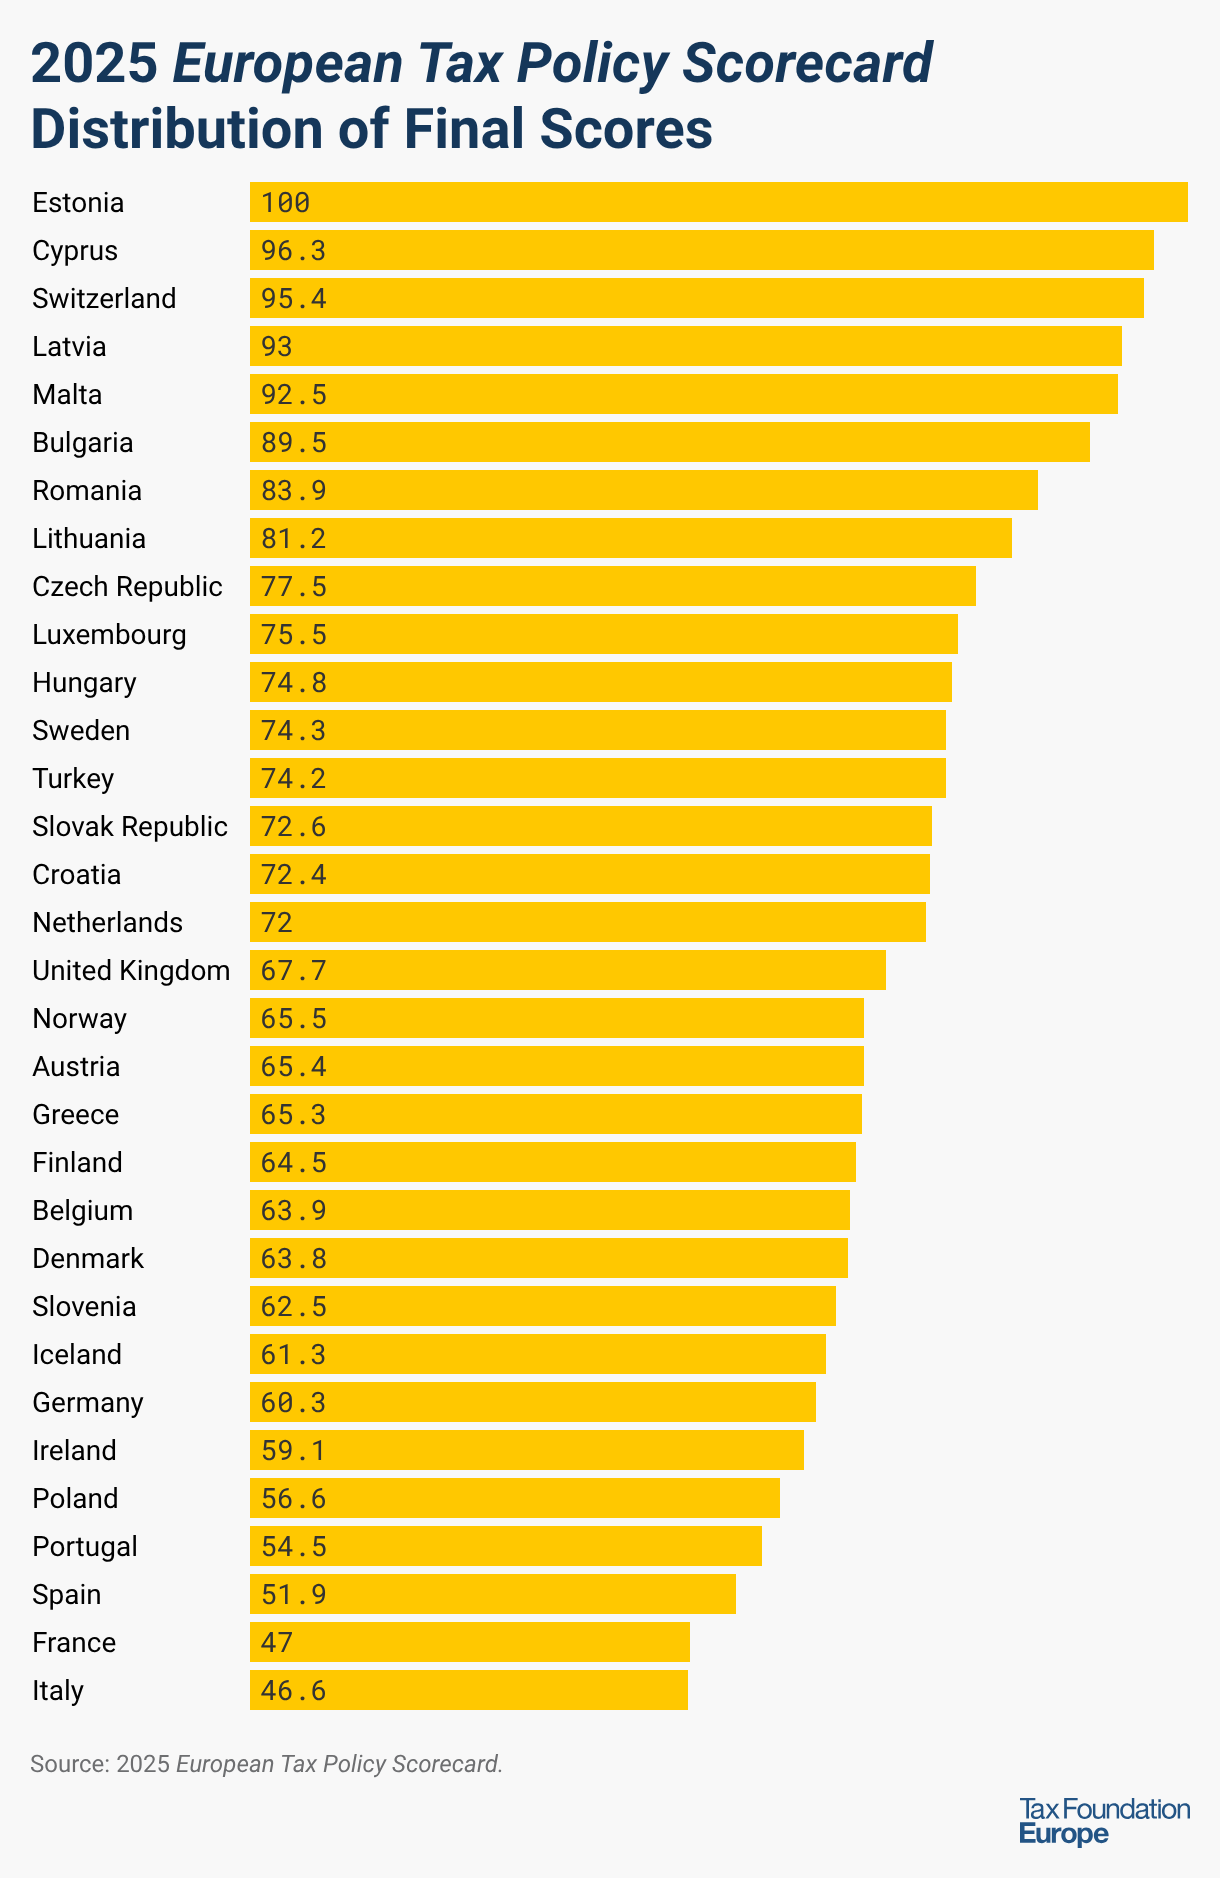
The ETPS includes data from numerous sources, including:
- Bloomberg Tax Country Guides
- Deloitte International Tax Source
- Ernst & Young International Tax Guides
- European Commission: Christoph Spengel, Frank Schmidt, Jost Heckemeyer, and Katharina Nicolay, “Effective Tax Levels Using the Devereux/Griffith Methodology.”
- Eurostat
- International Monetary Fund (IMF)
- Organisation for Economic Co-operation and Development (OECD)
- Oxford University Centre for Business Taxation Database
- PwC Worldwide Tax Summaries
The ETPS uses the most up-to-date data available as of December 2025. Data may not reflect changes in countries making rapid reforms. See footnotes for specific data citations.
Appendix Tables
- Table A. Corporate Taxes
- Table B. Individual Taxes
- Table C. Consumption Taxes
- Table D. Property Taxes
- Table E. Cross-Border Tax Rules
References
[1] Sean Bray, Daniel Bunn, and Joost Haddinga, “The Role of Pro-Growth Tax Policy and Private Investment in the European Union’s Green Transition,” Tax Foundation, May 4, 2023, https://taxfoundation.org/research/all/global/eu-green-transition-tax-policy/.
[2] Alex Mengden, “Distributed Profits Taxation Would Be a Good Role Model for the EU’s 28th Regime,” Jan. 29, 2025, Tax Foundation, https://taxfoundation.org/blog/distributed-profits-tax-eu-28-regime/.
[3] The tax provisions chapter (Articles 110-113 TFEU) relates to the harmonization of legislation concerning turnover taxes, excise duties, and other forms of indirect taxation; the chapter on the approximation of laws (Articles 114-118 TFEU) covers taxes that have an indirect effect on the establishment of the internal market, with fiscal provisions not subject to the ordinary legislative procedure; other provisions relevant to tax policy, referring to the free movement of persons, services, and capital (Articles 45-66 TFEU), the environment (Articles 191-192 TFEU) and competition (Articles 107-109 TFEU).
[4] Organisation for Economic Co-operation and Development (OECD), “Tax and Economic Growth,” Economics Department Working Paper No. 620, Jul. 11, 2008.
[5] Malta’s integrated corporate tax rate is lower than its statutory rate, since its full imputation system avoids the double taxation of dividends.
[6] OECD, “Corporate income tax statutory and targeted small business rates, Combined corporate income tax rate,” updated July 2025, https://data-explorer.oecd.org/; PwC, “Worldwide Tax Summaries: Corporate – Taxes on Corporate Income.”
[7] Countries with unlimited carryforwards are coded as having periods of 100 years. Some countries restrict the amount of taxable income that can be offset by losses each year. For example, Denmark allows for indefinite carryforwards but only 60 percent of taxable income can be offset by losses in any given year. These restrictions are coded as the percentage of taxable income that can be offset by losses times the number of allowable years. Thus, Denmark is coded as 60.
[8] Bloomberg Tax, “Country Guides,” https://bloomberglaw.com/product/tax/toc/source/511920/147664382; PwC, “Worldwide Tax Summaries,” https://pwc.com/gx/en/services/tax/worldwide-tax-summaries.html; and individual government websites.
[9] Estonia and Latvia do not have explicit loss carryover provisions. However, their cash-flow corporate tax system implicitly allows for unlimited loss carryforwards and carrybacks.
[10] Bloomberg Tax, “Country Guides;” PwC, “Worldwide Tax Summaries”; and individual government websites.
[11] Intangible assets are typically amortized, but the write-off is similar to depreciation.
[12] Christoph Spengel, Frank Schmidt, Jost Heckemeyer, and Katharina Nicolay, “Effective Tax Levels Using the Devereux/Griffith Methodology.” European Commission, October 2021, https://taxation-customs.ec.europa.eu/system/files/2022-03/final_report_2021_effective_tax_levels_revised_en.pdf; PwC, “Worldwide Tax Summaries: Corporate – Income Determination,” https://taxsummaries.pwc.com/austria/corporate/income-determination; and EY, “Worldwide Corporate Tax Guide 2025.”
[13] The European Commission also included an allowance for corporate equity in its proposal for a common corporate tax base in the European Union. See European Commission, “Common Consolidated Corporate Tax Base (CCCTB),” https://ec.europa.eu/taxation_customs/business/company-tax/common-consolidated-corporate-tax-base-ccctb_en. Switzerland has an optional allowance for corporate equity at the cantonal level, which is currently only in effect in the canton of Zurich. See PwC, “Worldwide Tax Summaries: Corporate – Deductions,” https://taxsummaries.pwc.com/switzerland/corporate/deductions.
[14] Bloomberg Tax, “Country Guides”; PwC, “Worldwide Tax Summaries: Corporate – Deductions”; and Spengel, Schmidt, Heckemeyer, and Nicolay, “Effective Tax Levels Using the Devereux/Griffith Methodology.”
[15] Rachel Griffith, Helen Miller, and Martin O’Connell, “Ownership of Intellectual Property and Corporate Taxation,” Journal of Public Economics 112 (April 2014): 12–23, https://sciencedirect.com/science/article/pii/S0047272714000103.
[16] OECD, “Action 5: Agreement on Modified Nexus Approach for IP Regimes,” 2015, https://oecd.org/ctp/beps-action-5-agreement-on-modified-nexus-approach-for-ip-regimes.pdf; and OECD, “Harmful Tax Practices – Peer Review Results,” January 2022, http://oecd.org/tax/beps/harmful-tax-practices-peer-review-results-on-preferential-regimes.pdf.
[17] Bloomberg Tax, “Country Guides”; PwC, “Worldwide Tax Summaries: Corporate – Tax credits and incentives,” https://taxsummaries.pwc.com/australia/corporate/tax-credits-and-incentives; and OECD, “Intellectual Property Regimes,” https://qdd.oecd.org/data/IP_Regimes.
[18] This does not imply that R&D credits do not meet their policy goal of fostering innovation through R&D activity, technology transfer, and entrepreneurship. See IMF, “Acting Now, Acting Together,” April 2016, https://imf.org/en/Publications/FM/Issues/2016/12/31/Acting-Now-Acting-Together. However, R&D credits benefit certain firms and industries more than others, creating distortions in the economy. See Gary Guenther, “Research Tax Credit: Current Law and Policy Issues for the 114th Congress,” Congressional Research Service, Mar. 13, 2015, https://fas.org/sgp/crs/misc/RL31181.pdf, and Fulvio Castellacci and Christine Mee Lie, “Do the effects of R&D tax credits vary across industries? A meta-regression analysis,” Research Policy 44:4 (May 2015), 819-832, https://sciencedirect.com/science/article/abs/pii/S0048733315000128.
[19] Deloitte, “International Tax– Italy Highlights 2023,” January 2023, https://www2.deloitte.com/content/dam/Deloitte/global/Documents/Tax/dttl-tax-italyhighlights-2023.pdf.
[20] OECD, “Implied tax subsidy rates on R&D expenditures,” https://data-explorer.oecd.org/org/. The measure used in the ETPS is the average implied tax subsidy rate of loss-making and profitable SMEs and large firms.
[21] KPMG, “Taxation of the digitalized economy: Developments summary,” updated Feb. 5, 2026, https://kpmg.com/kpmg-us/content/dam/kpmg/pdf/2023/digitalized-economy-taxation-developments-summary.pdf.
[22] Ibid. Denmark is set to increase its top personal income tax rate to 60.5 percent starting in 2026.
[23] OECD, “Top statutory personal income tax rate and marginal tax rateThe marginal tax rate is the amount of additional tax paid for every additional dollar earned as income. The average tax rate is the total tax paid divided by total income earned. A 10 percent marginal tax rate means that 10 cents of every next dollar earned would be taken as tax. for employees at the earnings threshold where the top statutory personal income tax rate first applies,” updated July 2025, https://data-explorer.oecd.org/. Employee social security taxes are included when these are not phased out before the top threshold and the combined rate is higher than the top statutory rate.
[24] Ibid.
[25] The marginal tax burden faced by an average worker in a country and the total tax cost of labor for an average worker in a country are called the marginal and average tax wedges, respectively. The tax wedge includes income taxes and social security contributions (both the employee-side and the employer-side). The ratio of marginal to average tax wedges is calculated using the EC data of average total tax wedges over six intervals of income for single individuals without dependents and calculating the marginal tax wedges across five intervals. It is the average of marginal to average total tax wedges over the intervals between 50 percent, 67 percent, 80 percent, 100 percent, 125 percent, and 167 percent of average earnings.
[26] Cristina Enache, “A Comparison of the Tax Burden on Labor in the OECD,” Tax Foundation, Apr. 19, 2021, https://taxfoundation.org/publications/comparison-tax-burden-labor-oecd/.
[27] European Commission, “Economic and Financial Affairs, Economic databases and indicators, Tax and Benefit Indicators, Tax Wedge,” updated June 2025, https://europa.eu/economy_finance/db_indicators/tab/.
[28] Daniel Bunn and Elke Asen, “Savings and Investment: The Tax Treatment of Stock and Retirement Accounts in the OECD,” Tax Foundation, May 26, 2021, https://taxfoundation.org/savings-and-investment-oecd/.
[29] Bloomberg Tax, “Country Guide”; PwC, “Quick Charts: Capital gains tax (CGT) rates,” https://taxsummaries.pwc.com/quick-charts/capital-gains-tax-cgt-rates; and PwC, “Worldwide Tax Summaries: Individual – Income determination,” https://taxsummaries.pwc.com/. When the capital gains tax rate varies by type of asset sold, the tax rate applying to the sale of listed shares after an extended period of time is used. Includes surtaxes if applicable.
[30] Bloomberg Tax, “Country Guides”; OECD, “Combined (corporate and shareholder) statutory tax rates on dividend income, Net personal tax,” updated July 2025, https://data-explorer.oecd.org/org/.
[31] There are other types of consumption taxes, such as excise taxes. However, these are generally narrowly based, as they are levied on specific goods, services, and activities, rather than all final consumption. The ETPS only considers general consumption taxes (VAT and retail sales tax).
[32] OECD, “Taxes on Consumption: Value Added Tax/Goods and Services Tax (VAT/GST) (1976-2021): VAT/GST: standard and any reduced rates (2022),” http://oecd.org/tax/tax-policy/tax-database/.
[33] Original measurements in U.S. dollars (purchasing power parity, PPP).
[34] OECD, “Taxes on Consumption: Value Added Tax/Goods and Services Tax (VAT/GST) (1976-2023): VAT/GST: standard and any reduced rates (2023),” https://www.oecd.org/tax/consumption/vat-gst-annual-turnover-concessions-ctt-trends.xlsx/
[35] Cristina Enache, “The EU’s Questionable VAT Policy,” Tax Foundation, Feb. 2, 2026, https://taxfoundation.org/blog/eu-vat-revenue-compliance/.
[36] The same concept can be applied to retail sales taxes.
[37] The VAT revenue ratio (VRR) was calculated using the following formula in line with the OECD’s VRR calculations: VRR = VAT Revenue/[(Consumption – VAT revenue) x standard VAT rate]. The calculations are based on OECD, “Consumption Tax Trends 2018,” Dec. 5, 2018, https://read.oecd-ilibrary.org/taxation/consumption-tax-trends-2018_ctt-2018-en#page92; For non-OECD countries, see Eurostat, “National Tax Lists – individual taxes,” updated Jan. 22, 2025, https://ec.europa.eu/eurostat/statistics-explained/index.php?title=Tax_revenue_statistics.
[38] When the property tax base is set at the subnational level, the ETPS evaluates the most representative model. For example, effective from 2025, the German state of Baden-Württemberg only taxes the value of the land. However, most states use the federal model, which also taxes the value of buildings. See, https://grundsteuerreform.de/.
[39] Deloitte, “Tax Guides and Highlights,” https://dits.deloitte.com/#TaxGuides; Bloomberg Tax, “Country Guides”; and PwC, “Worldwide Tax Summaries: Corporate – Income Determination.”
[40] Jared Walczak, “State Inheritance and Estate Taxes: Rates, Economic Implications, and the Return of Interstate Competition,” Tax Foundation, Jul. 17, 2017, https://taxfoundation.org/state-inheritance-estate-taxes-economic-implications/#_ftn84.
[41] Bloomberg Tax, “Country Guides”; and EY, “Worldwide Estate and Inheritance Tax Guide 2025,” https://ey.com/en_gl/tax-guides/worldwide-estate-and-inheritance-tax-guide.
[42] EY, “Worldwide Estate and Inheritance Tax Guide 2025.”
[43] OECD Data Explorer, “A comparative table of tax revenues for Revenue Statistics in OECD member countries,” https://data-explorer.oecd.org/.
[44] Bloomberg Tax, “Country Guides”; EY, “Worldwide Estate and Inheritance Tax Guide 2025”; PwC, “Worldwide Tax Summaries: Individual Taxes – Other taxes.”
[45] UK Government, “Stamp Duty Land Tax – Overview,” https://gov.uk/stamp-duty-land-tax.
[46] Deloitte, “Tax Guides and Highlights”; Bloomberg Tax, “Country Guides.”
[47] Luxembourg levies this tax on non-Luxembourg companies as well, but only on wealth held within Luxembourg. See Government of the Grand Duchy of Luxembourg, “Net wealth tax,” Mar. 22, 2017, http://guichet.public.lu/entreprises/en/fiscalite/impots-benefices/impots-divers/impot-fortune/index.html.
[48] PwC, “Worldwide Tax Summaries: Corporate Taxes – Other taxes.”
[49] Bloomberg Tax, “Country Guides – Other Taxes,” and “Country Guides – Special Industries,” https://bloomberglaw.com/product/tax/toc_view_menu/3380.
[50] PwC, “Worldwide Tax Summaries: Corporate Taxes.”
[51] EUR-Lex, “Council Directive 2008/7/EC, concerning indirect taxes on the raising of capital,” February 2008, http://eur-lex.europa.eu/legal-content/EN/ALL/?uri=CELEX:32008L0007.
[52] Bloomberg Tax, “Country Guides”; and PwC, “Worldwide Tax Summaries: Corporate Taxes.”
[53] Ibid.
[54] Colin Miller and Anna Tyger, “The Impact of a Financial Transaction Tax.”
[55] Ibid.
[56] Kyle Pomerleau, Daniel Bunn, and Thomas Locher, “Anti-Base Erosion Provisions and Territorial Tax Systems in OECD Countries,” Tax Foundation, Jul. 7, 2021, https://taxfoundation.org/anti-base-erosion-territorial-tax-systems.
[57] Deloitte, “Tax Guides and Highlights 2025”; Bloomberg Tax, “Country Guide”; EY, “Worldwide Corporate Tax Guide 2025”; and PwC, “Worldwide Tax Summaries.”
[58] Ibid.
[59] Deloitte, “Tax Guides and Highlights – Portugal Highlights 2024,” https://deloitte.com/content/dam/Deloitte/global/Documents/Tax/dttl-tax-portugalhighlights-2024.pdf.
[60] Deloitte, “Tax Guides and Highlights – Italy Highlights 2024,” https://deloitte.com/content/dam/Deloitte/global/Documents/Tax/dttl-tax-italyhighlights-2024.pdf.
[61] Deloitte, “Tax Guides and Highlights 2025”; Bloomberg Tax, “Country Guide”; EY, “Worldwide Corporate Tax Guide 2025”; and PwC, “Worldwide Tax Summaries.”
[62] Deloitte, “Domestic rates: Withholding tax,” https://dits.deloitte.com/#DomesticRatesSubMenu.
[63] EY, “Worldwide Corporate Tax Guide: 2025.” The source may not include all active tax treaties, potentially underestimating the scope of tax treaty networks. Tax treaties with former countries, such as the USSR, Yugoslavia, and Czechoslovakia, are not counted as one. Every country the treaty applies to is counted individually.
[64] Thomas Hoppe, Deborah Schanz, Susann Sturm, and Caren Sureth-Sloane, “The Tax Complexity Index – A Survey-Based Country Measure of Tax Code and Framework Complexity,” TRR 266 Accounting for Transparency Working Paper Series No. 5, WU International Taxation Research Paper Series No. 2019-06, Sep. 16, 2020, https://papers.ssrn.com/sol3/papers.cfm?abstract_id=3469663.
[65] European Commission, “The Anti Tax Avoidance Directive,” Jan. 28, 2016, https://ec.europa.eu/taxation_customs/anti-tax-avoidance-directive_en.
[66] Sebastian Dueñas and Daniel Bunn, “Tax Avoidance Rules Increase the Compliance Burden in EU Member Countries,” Tax Foundation, Mar. 28, 2019, https://taxfoundation.org/eu-tax-avoidance-rules-increase-tax-compliance-burden/.
[67] Bloomberg Tax, “Country Guides: Anti-Avoidance Provisions – Controlled Foreign Company (CFC) Rules,” https://bloomberglaw.com/product/tax/bbna/chart/3/10077/347a743114754ceca09f7ec4b7015426; and PwC, “Worldwide Tax Summaries: Corporate – Group taxation,” https://taxsummaries.pwc.com/australia/corporate/group-taxation.
[68] Jennifer Blouin, Harry Huizinga, Luc Laeven, and Gaëtan Nicodème, “Thin Capitalization Rules and Multinational Firm Capital Structure,” International Monetary Fund Working Paper WP/14/12, January 2014, https://imf.org/external/pubs/ft/wp/2014/wp1412.pdf.
[69] Ibid.
[70] For more details, see “Allowance for Corporate Equity” in the ETPS section “Corporate Income Tax.”
[71] Bloomberg Tax, “Country Guides: Anti-Avoidance Provisions – Thin Capitalization/Other Interest Deductibility Rules,” https://bloomberglaw.com/product/tax/bbna/chart/3/10077/a8a08d05c9450b676b4d835dbb64348c; and PwC, “Worldwide Tax Summaries: Corporate – Group taxation.”
[72] Kyle Pomerleau, Daniel Bunn, and Thomas Locher, “Anti-Base Erosion Provisions and Territorial Tax Systems in OECD Countries.”
[73] To calculate the standard deviation, we find the mean of a variable (corporate tax rates, for example) and the difference of each country’s tax rate from the mean tax rate among the 32 countries. We then take each country’s difference from the mean and find the average difference for the group.
[74] The true normal score is 1.5. The score is a negative value to reflect the fact that being higher than the OECD average is less ideal.
Share this articleAbout the Authors

Expert
Sean Bray
Vice President of Global Tax Policy at Tax Foundation and Policy Director of Tax Foundation Europe
Sean Bray is Vice President of Global Tax Policy at Tax Foundation and Policy Director of Tax Foundation Europe, where he researches international tax issues with a focus on tax policy in Europe. Prior to joining the Tax Foundation, Sean Bray worked in the United States Senate on tech, telecom, and trade policy.

Alex Mengden is an Economist at the Tax Foundation, where he focuses on international tax issues and tax policy in Europe. He holds a BA in philosophy and economics from the University of Bayreuth and an MSc in economics from the Ludwig Maximilian University of Munich.
Previous Versions
-
2024 European Tax Policy Scorecard
55 min read -
2023 European Tax Policy Scorecard
52 min read