Table of Contents
- Key Findings
- Introduction
- The Tax Burden on Labor
- — Personal Income Taxes
- — Payroll Taxes
- — The Economic Incidence of Payroll Taxes
- Average OECD Tax Burden
- Tax Burden by OECD Country
- — Single Worker with No Children
- — Comparing a Single Worker with No Children to a Married Worker with Two Children
- OECD Tax Burden from 2000 to 2020
- Most Notable Changes in the Tax Burden since 2000
- COVID-19 Support Measures Had Little Impact on the Tax Burden
- Marginal and Average Tax Wedges
- Tax Burden Including VAT
- Tax Burden in Europe
- Conclusion
- Appendix
- Methodology
Key Findings
- Average wage earners in the OECD have their take-home pay lowered by two major taxes: individual income and payroll (both employee and employer side).
- Value-added (VAT) and sales taxes also place a taxA tax is a mandatory payment or charge collected by local, state, and national governments from individuals or businesses to cover the costs of general government services, goods, and activities. burden on take-home pay used for consumption.
- Before accounting for VAT and sales taxA sales tax is levied on retail sales of goods and services and, ideally, should apply to all final consumption with few exemptions. Many governments exempt goods like groceries; base broadening, such as including groceries, could keep rates lower. A sales tax should exempt business-to-business transactions which, when taxed, cause tax pyramiding. , the average tax burden a single average wage earner faced in the OECD was 34.6 percent of pretax earnings in 2020. The average OECD tax burden on labor has dropped 1.8 percentage points over the past two decades.
- The average tax burden among OECD countries varies substantially. In 2020, a worker in Belgium faced a tax burden seven times higher than that of a Chilean worker.
- In 2020, the average tax burden from income and payroll taxes for families in OECD countries was 24.4 percent, 10.2 percentage points lower than for single taxpayers without children. In general, countries with higher tax wedges provide greater tax relief for families with children.
- Between 2019 and 2020, the OECD average tax burden decreased by 0.39 percentage points and COVID-19 measures accounted for roughly one-fifth of that.
- In 2020 an Italian worker making €38,396 (US $56,839) faced a marginal tax wedgeA tax wedge is the difference between total labor costs to the employer and the corresponding net take-home pay of the employee. It is also an economic term that refers to the economic inefficiency resulting from taxes. as high as 117 percent on a 1 percent increase in earnings. Such marginal tax wedges might deter workers from pursuing additional income and working extra hours.
- Accounting for VAT and sales tax, the average tax burden on labor in 2020 was 40.1 percent, 5.5 percentage points higher than when only income and payroll taxes are considered.
Introduction
Individual income taxes, payroll taxes, and consumption taxes like value-added taxes (VAT) make up a large portion of many countries’ tax revenue.[1] These taxes combined make up the tax burden on labor both by taxing wages directly and through the tax burden on wages used for consumption.
The Organisation for Economic Co-operation and Development (OECD) reports data on the composition of the tax burden on labor across 37 developed countries.[2] The most recent data available shows that, on average, single workers with no children, earning a nation’s average wage in the OECD, faced a tax burden from income and payroll taxes of 34.6 percent in 2020. After accounting for VAT and sales taxes, which reduce the purchasing power of earnings, the OECD average tax wedge was 40.1 percent in 2020.
In many countries, taxes are progressive, which means that higher-income workers are taxed at higher rates. However, the average worker does not necessarily escape from being burdened by these taxes. It is also important to note that the tax burden on families is often lower than the burden on single, childless workers earning the same pretax income.
As noted in our primer3 on the tax wedge on labor, there is a negative relationship between the tax wedge and employment. Because of this, countries should explore ways to make their taxation of labor less burdensome to improve the efficiency of their labor markets.
The Tax Burden on Labor
The tax burden on labor is referred to as a “tax wedge,” which simply refers to the difference between an employer’s cost of an employee and the employee’s net disposable income. For the purpose of the OECD study, the wedge is determined by several factors: the amount of pretax income (referred to as “labor cost”) of a worker, the taxes that apply to that income, and whether the taxpayer is filing as single or as a family.
The OECD calculates the tax burden by adding together the income tax payment, employee-side payroll taxA payroll tax is a tax paid on the wages and salaries of employees to finance social insurance programs like Social Security, Medicare, and unemployment insurance. Payroll taxes are social insurance taxes that comprise 24.8 percent of combined federal, state, and local government revenue, the second largest source of that combined tax revenue. payment, and employer-side payroll tax payment of a worker earning the average wage in a country. The OECD then divides this figure by the total labor cost of this average worker, or what the worker could have earned in the absence of these three taxes.
Personal Income Taxes
Personal income taxes are levied directly on an individual’s income, including wage income. These taxes are typically levied in a progressive manner, meaning that an individual’s average tax rateThe average tax rate is the total tax paid divided by taxable income. While marginal tax rates show the amount of tax paid on the next dollar earned, average tax rates show the overall share of income paid in taxes. increases as income increases. The amount of income tax paid typically also depends on whether the taxpayer is filing as single or as family, as most countries allow for some targeted tax relief for families with children.
Payroll Taxes
Payroll taxes are typically flat-rate taxes levied on wages and are in addition to the taxes on income. In most OECD countries, both the employer and the employee pay payroll taxes. These taxes usually fund specific social programs, such as unemployment insurance, health insurance, and old age insurance.
The Economic Incidence of Payroll Taxes
Although payroll taxes are typically split between workers and their employers, economists generally agree that both sides of the payroll tax ultimately fall on workers.
In tax policy, there is an important distinction between the “legal” and the “economic” incidence of a tax. The legal incidence of a tax falls on the party that is legally required to write the check to the tax collector. However, the party that legally pays a tax is not always the one that ultimately bears the burden of the tax. The “economic” incidence of a tax can fall on any number of people and is determined by the relative elasticities of supply and demand of a taxed good, or how people and businesses respond to a tax.[4]
Average OECD Tax Burden
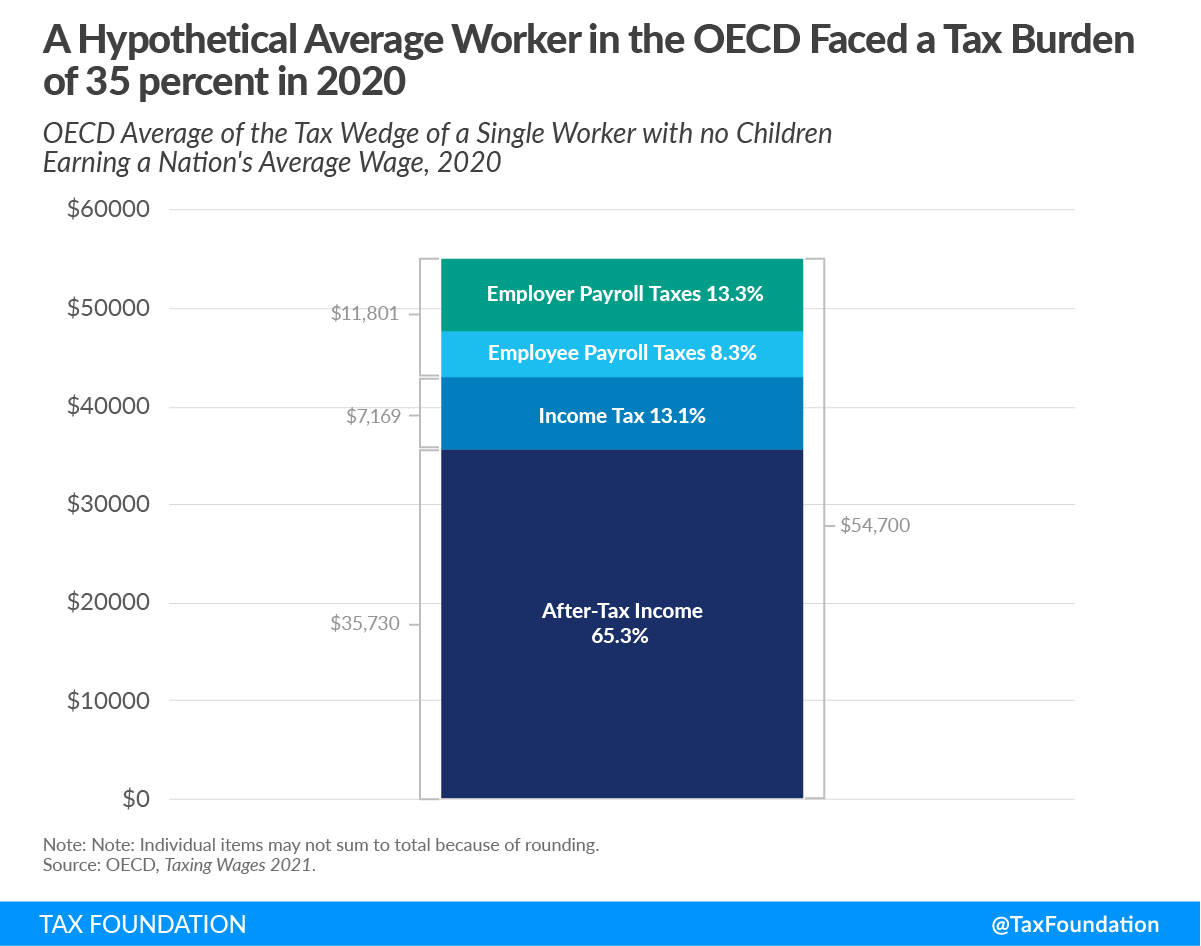
In 2020, the average OECD tax wedge for a single worker with no children earning a nation’s average wage was 34.6 percent. The average annual total labor cost per worker was $54,700. Income taxes accounted for 13.1 percent ($7,169) of the labor cost. Employee-side payroll taxes made up 8.3 percent ($4,517) and employer-side payroll taxes 13.3 percent ($7,284). The average annual disposable after-tax incomeAfter-tax income is the net amount of income available to invest, save, or consume after federal, state, and withholding taxes have been applied—your disposable income. Companies and, to a lesser extent, individuals, make economic decisions in light of how they can best maximize their earnings. of a worker in the OECD amounted to $35,730, or 65.3 percent of total labor cost.[5]
Tax Burden by OECD Country
The OECD average described above reflects overall tendencies of the tax burden on labor among the 37 OECD countries. However, as shown below, many countries deviate from this average quite substantially, reflecting economic and policy differences across countries.
Single Worker with No Children
In 2020, the tax wedge faced by single workers without children ranged from only 7 percent[6] in Chile to 51.5 percent in Belgium, a difference of 44.5 percentage points. Fourteen of the countries had a tax wedge above 40 percent, another 14 countries between 40 and 30 percent, and nine countries below 30 percent.
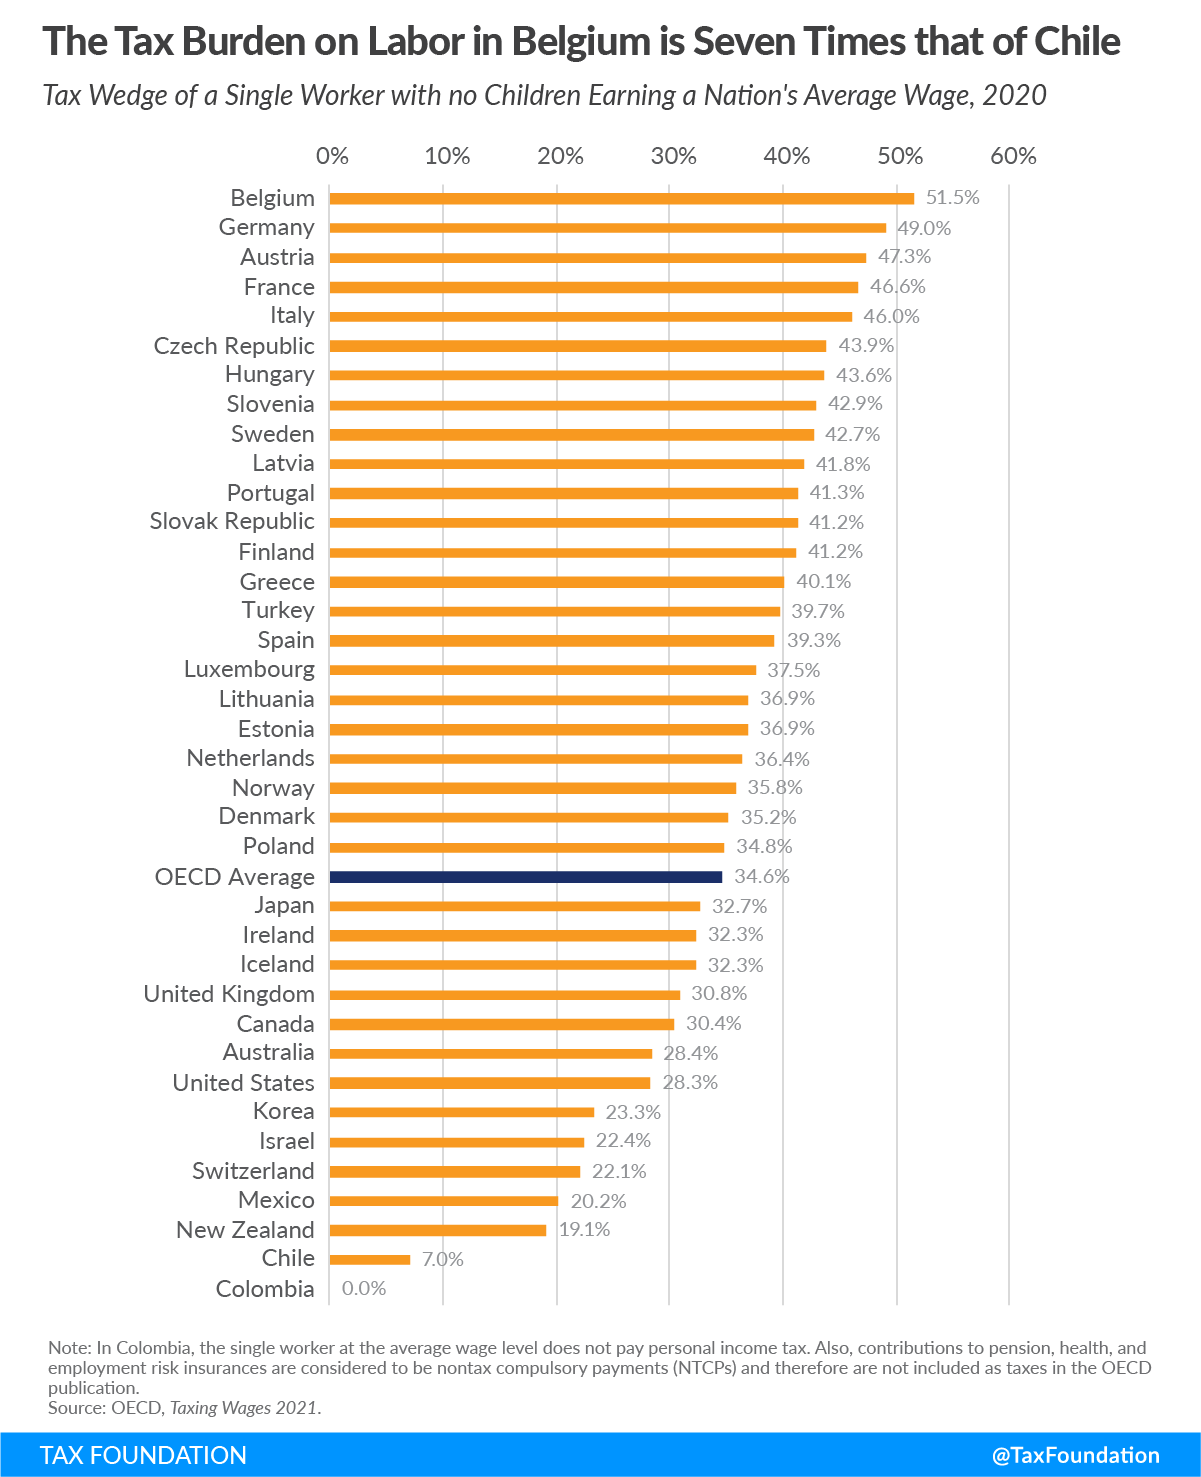
Tax wedges are particularly high in European countries—the 23 countries with the highest tax burden in the OECD are all European. In contrast, 10 out of the 14 OECD countries with the tax burden are non-European (the United Kingdom, Switzerland, Iceland, and Ireland are the four European countries in this category).
In 30 out of 37 OECD countries, total payroll taxes accounted for a larger share of the tax burden on labor than income taxes did.[7] Australia, Denmark, Iceland, Ireland, New Zealand, and the United States were the only countries in which the share from income taxes exceeded payroll taxes.
Comparing a Single Worker with No Children to a Married Worker with Two Children
Most countries in the OECD provide some targeted tax relief for families with children, typically through lower income taxes. The average wedge for families, defined as a one-earner married couple with two children, was 24.4 percent in 2020, compared to an average tax wedge of 34.6 percent for single workers without children.
The following figure compares the tax burden faced by a one-earner married couple with two children with that of a single worker without children.
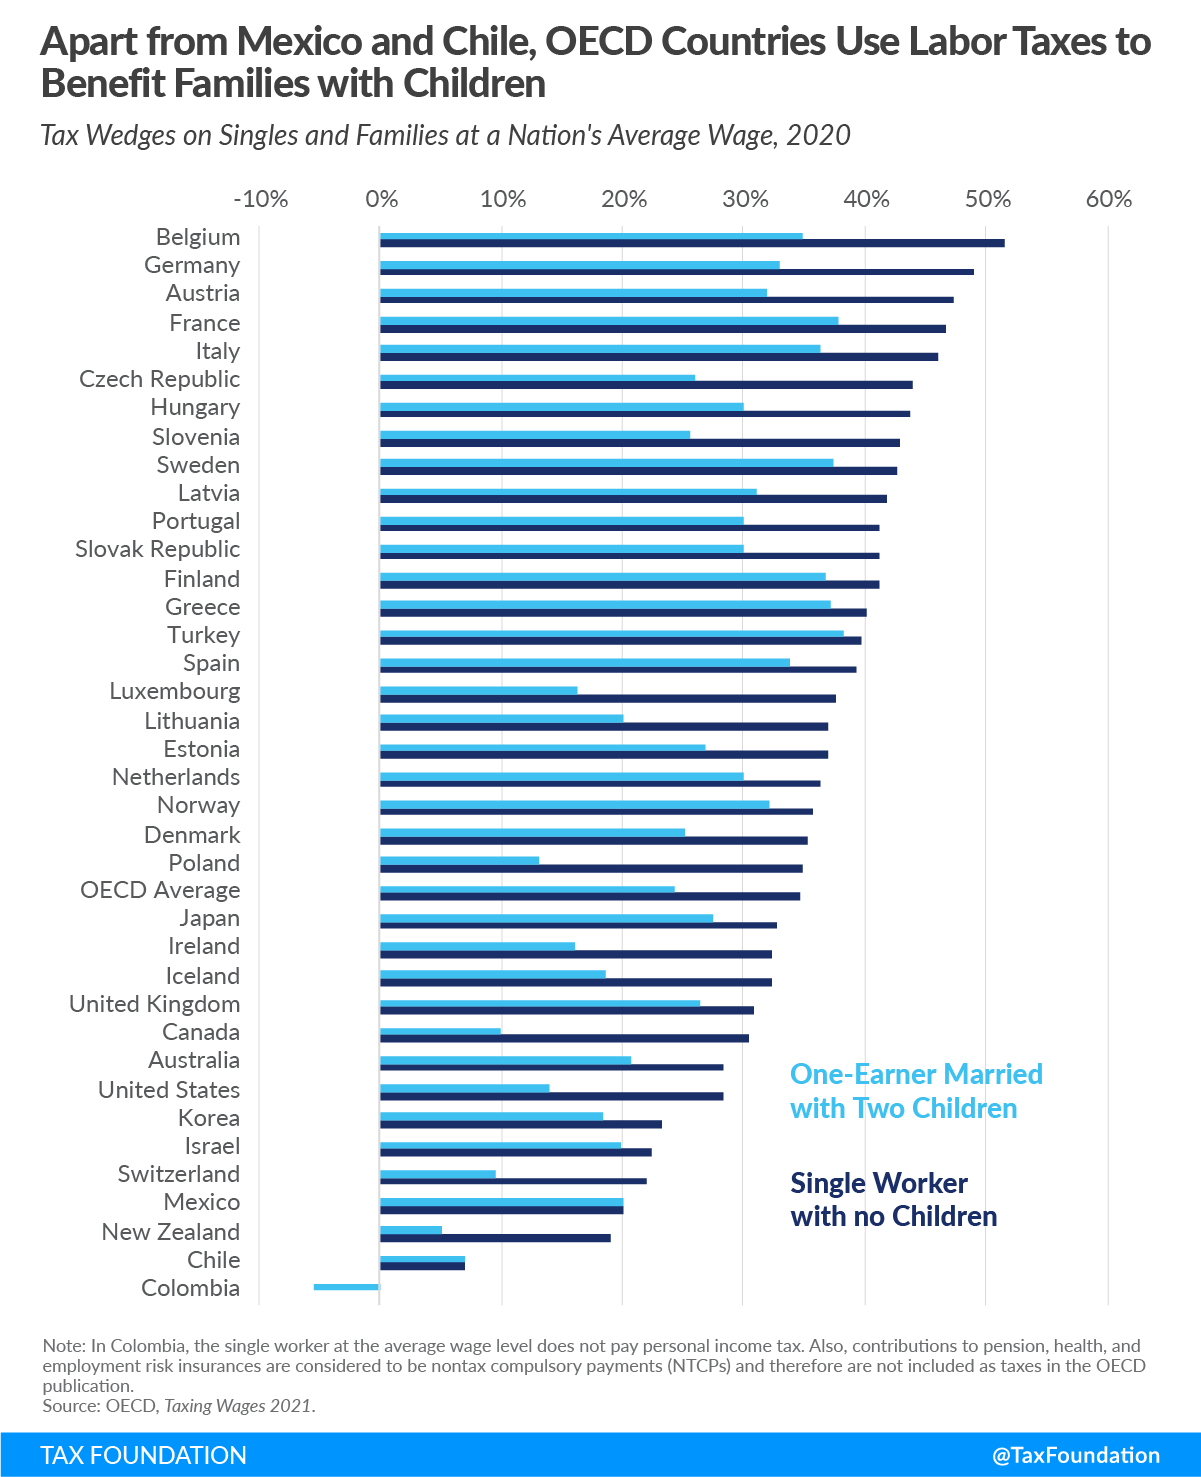
In general, countries with a higher tax wedge provide greater tax relief for families with children. Belgium, Germany, Austria, and the Czech Republic, which had the first, second, third, and sixth-highest tax wedge for single workers without children, drop more than seven positions, ranking seventh, ninth, eleven and twentieth respectively once family relief is included.
In 2020, the highest family tax wedge was in Turkey, at 38.2 percent, followed by France, at 37.9 percent, while the lowest family tax wedge was in New Zealand, at 5 percent.
Poland has the largest disparity between the two tax wedges, at 21.6 percentage points, between its 34.8 percent wedge for single workers and 13.2 percent wedge for families. Chile and Mexico are the only countries that do not provide any tax relief for families with children but they keep the average tax wedge low.
OECD Tax Burden from 2000 to 2020
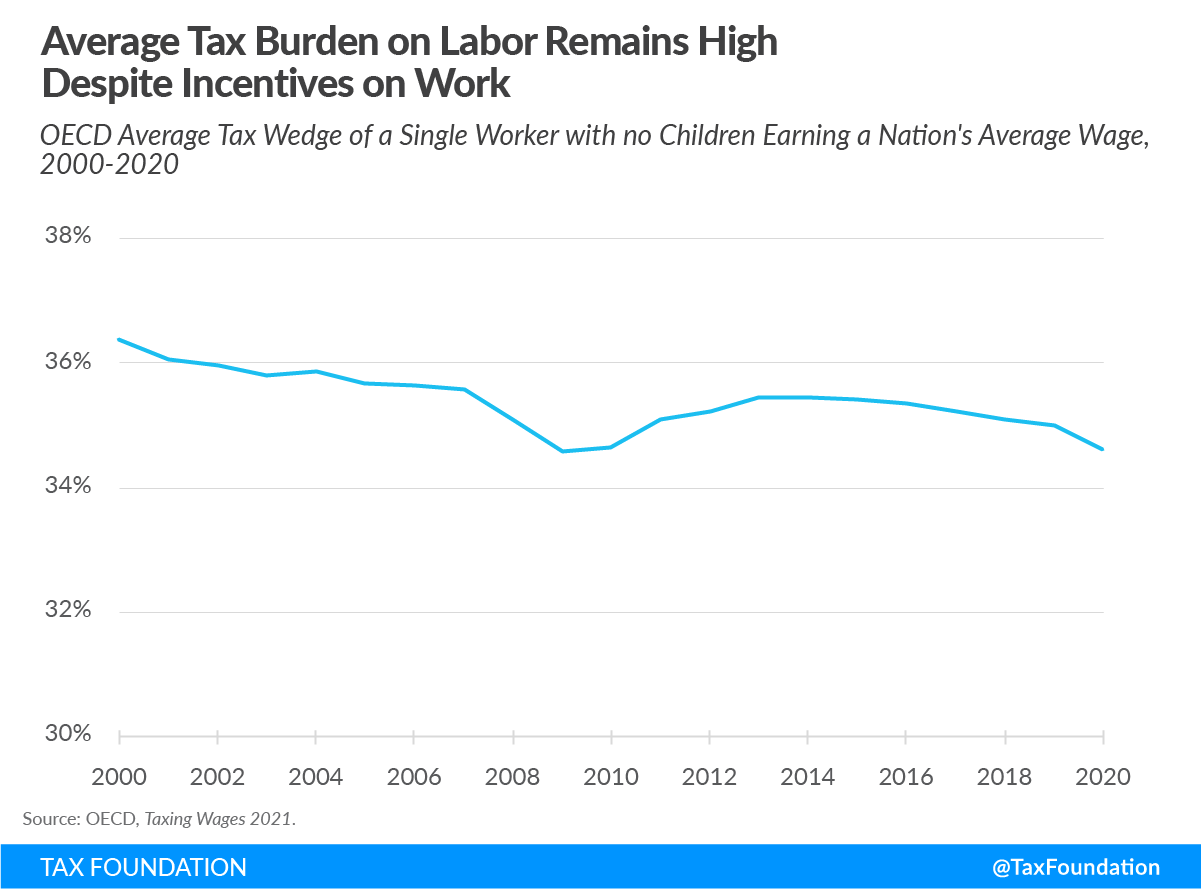
Although the tax wedge has changed quite substantially in some countries over time, the average OECD tax burden on labor has dropped just 1.8 percentage points over the past two decades. In 2000, the average OECD tax wedge was 36.4 percent, compared to 34.6 percent in 2020. However, in 2020, the average OECD tax burden dropped to its lowest level, also reached in 2009 post-financial crisis.
Most Notable Changes in the Tax Burden since 2000
Some individual countries have made substantial changes to their income and payroll taxes in the last two decades. The following graph shows the OECD countries with the largest increases and decreases in their respective tax wedges.
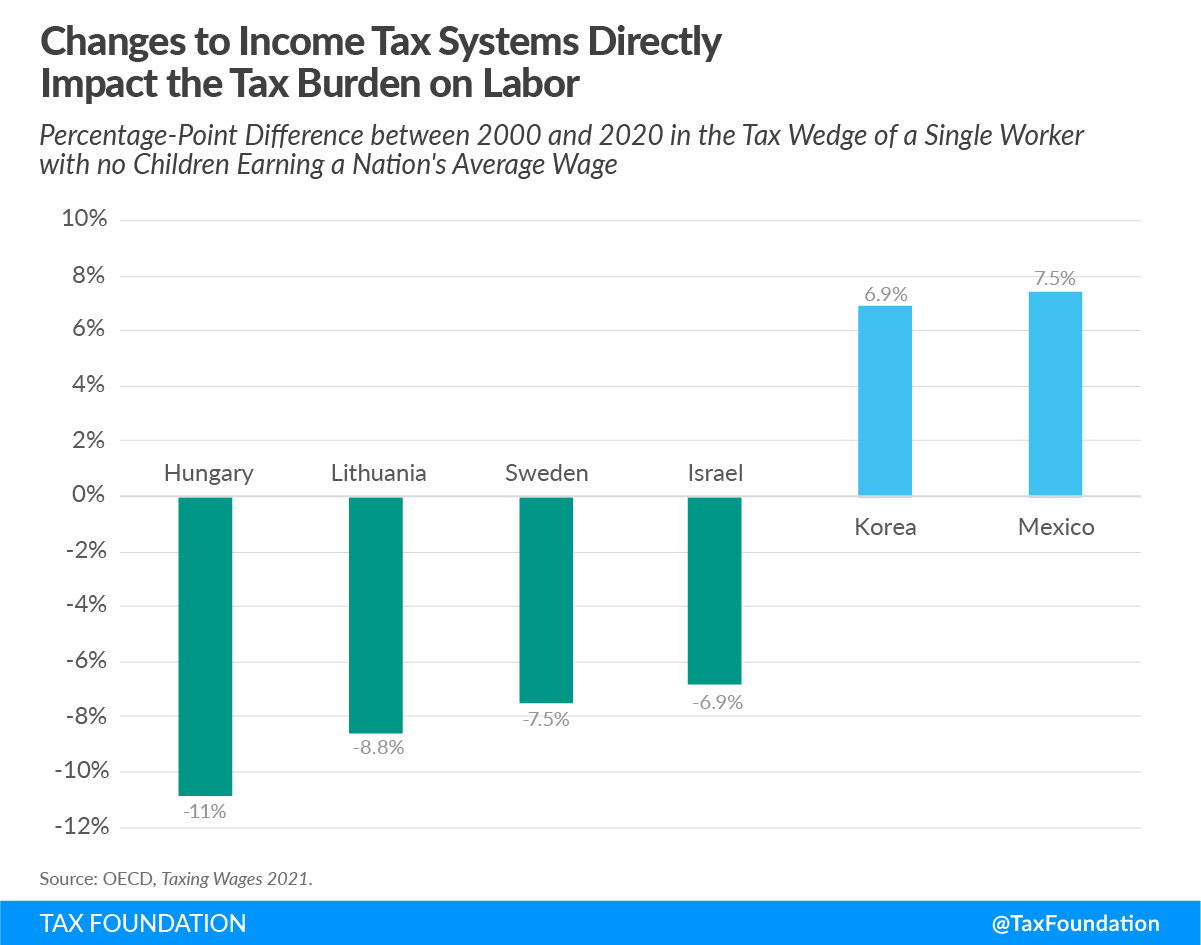
Hungary, the OECD country with the highest tax burden on labor in 2000, has had the most notable decrease in its tax wedge, from 54.7 percent to 43.6 percent in 2020. This is partially due to the introduction of a flat taxAn income tax is referred to as a “flat tax” when all taxable income is subject to the same tax rate, regardless of income level or assets. on income, which lowered the income tax burden relative to total labor costs. Additionally, Hungary reduced its payroll taxes relative to total labor costs. Israel, Sweden, and Lithuania have also lowered their tax burden on labor substantially, with a reduction between 7.2 and 8.8 percentage points each.
Mexico has seen the highest increase in its tax wedge since 2000, with an additional tax burden of 7.5 percentage points. While payroll taxes relative to total labor costs have roughly stayed the same in Mexico, income taxes as a percent of total labor costs have increased from 0.9 percent in 2000 to 8.5 percent in 2019. The tax wedge has also increased in South Korea, by 6.9 percentage points.
COVID-19 Support Measures Had Little Impact on the Tax Burden
Between 2019 and 2020, the OECD average tax burden decreased by 0.39 percentage points.
In 2020, the tax burden for the single worker earning the average wage increased by less than 0.5 percentage points in seven of the 37 OECD countries. In all but one country, Korea, the increases were driven by rising average wages, offset slightly by policy changes.
On the other hand, the tax burden fell in 29 countries. The decrease that reached 1.91 percentage points in Italy and 1.37 percentage points in the United States was mainly driven by policy changes rather than the decline of the average wages. Policy changes included lower income taxes, and tax and benefit measures introduced in response to the COVID-19 pandemic. In Austria, a rebate was applied in one of the income tax payments; in Lithuania, the tax-exempt amount was increased; in Canada, the decline in the tax burden resulted from a one-time special payment through the Goods and Services Tax creditA tax credit is a provision that reduces a taxpayer’s final tax bill, dollar-for-dollar. A tax credit differs from deductions and exemptions, which reduce taxable income, rather than the taxpayer’s tax bill directly. ; in the United States, the decrease in the tax wedge was mainly due to the Economic Impact Payment that was part of the Coronavirus Aid, Relief, and Economic Security Act (CARES).
However, the COVID-19 support measures were primarily designed to reduce the tax burden for families with children rather than that of a single taxpayer without children. Overall, the impact of the COVID-19 measures was smaller than other policy changes and accounted for roughly one-fifth of the decrease in the average tax burden a single average wage earner faced in 2020.
Marginal and Average Tax Wedges
Comparing the tax wedge on the average worker across countries is only a partial representation of how taxes on labor impact the economy, both by changing incentives to work and by raising revenue for the government at various levels.
The OECD’s Taxing Wages 2021 report presents both average and marginal tax wedges (MTW). The average tax wedge is what has been presented so far and is the combined share of labor and payroll taxes relative to gross labor income, or the tax burden. The marginal tax wedge, on the other hand, is the share of labor and payroll taxes applicable to the next dollar earned and can impact individuals’ decisions to work more hours or take a second job. The marginal tax wedge is generally higher than the average tax wedge due to the progressivity of taxes on labor across countries—as workers earn more, they face a higher tax wedge on their marginal dollar of earnings. However, a drastic increase in the marginal tax wedge, especially at lower levels of income, might deter workers from pursuing additional income and working extra hours.
In order to check for possible spikes, the marginal tax wedge[8] has been analyzed for gross earnings that range between 50 and 150 percentage points of the average wage in each OECD country.
| Average Marginal Tax Wedge | Top Marginal Tax Wedge | Annual Gross Wage at which the Top MTW Applies in US Dollars | |
|---|---|---|---|
| Canada | 38% | 63% | $40,770 |
| France | 59% | 93% | $62,382 |
| Italy | 61% | 117% | $56,839 |
| Note: Both top and average MTW are calculated for wages that are between 50% and 150% of the average country’s wage.
Source: OECD, “Taxing wages – Tax wedge decomposition,” https://www.stats.oecd.org/Index.aspx?DataSetCode=TXWDECOMP, and OECD, Taxing Wages 2021. |
|||
A Canadian worker faces a marginal tax wedge of 63 percent for a 1 percent increase in gross earnings on top of the gross annual wage of $40,770. This is because the provincial health-care premium[9] moves to a different rate at this level of income (CAD 48,000).
A French worker will face a marginal tax wedge of 93 percent for a 1 percent increase in the gross earnings on top of the gross annual wage of $62,382. This is because employer social security contributions increase by 6 percentage points[10] at this level of income.
Of the three countries, an Italian worker will see the biggest tax rate spike and face a marginal tax wedge of 117 percent for a 1 percent increase in the gross earnings on top of the gross annual wage of $56,839. This is because the local income tax rate raises drastically at this level of income.[11]
This shows that progressive taxA progressive tax is one where the average tax burden increases with income. High-income families pay a disproportionate share of the tax burden, while low- and middle-income taxpayers shoulder a relatively small tax burden. rates and several layers of social security contributions can create marginal tax rateThe marginal tax rate is the amount of additional tax paid for every additional dollar earned as income. The average tax rate is the total tax paid divided by total income earned. A 10 percent marginal tax rate means that 10 cents of every next dollar earned would be taken as tax. spikes that can distort or change incentives to work.
Tax Burden Including VAT
The tax burden on labor is broader than personal income taxes and payroll taxes. In many countries, individuals also pay a value-added tax (VAT) on their consumption. Because a VAT diminishes the purchasing power of individual earnings, a more complete picture of the tax burden should include the VAT. Although the United States does not have a VAT, state sales taxes also work to diminish the purchasing power of earnings.
Accounting for VAT rates and bases in OECD countries increased the tax burden on labor by 5.5 percentage points on average in 2020. The effective VAT rate is much lower than the statutory rate for each country because of exclusions in the tax baseThe tax base is the total amount of income, property, assets, consumption, transactions, or other economic activity subject to taxation by a tax authority. A narrow tax base is non-neutral and inefficient. A broad tax base reduces tax administration costs and allows more revenue to be raised at lower rates. . The distribution of VAT-inclusive tax wedges across countries is similar to that shown in Figure 2.
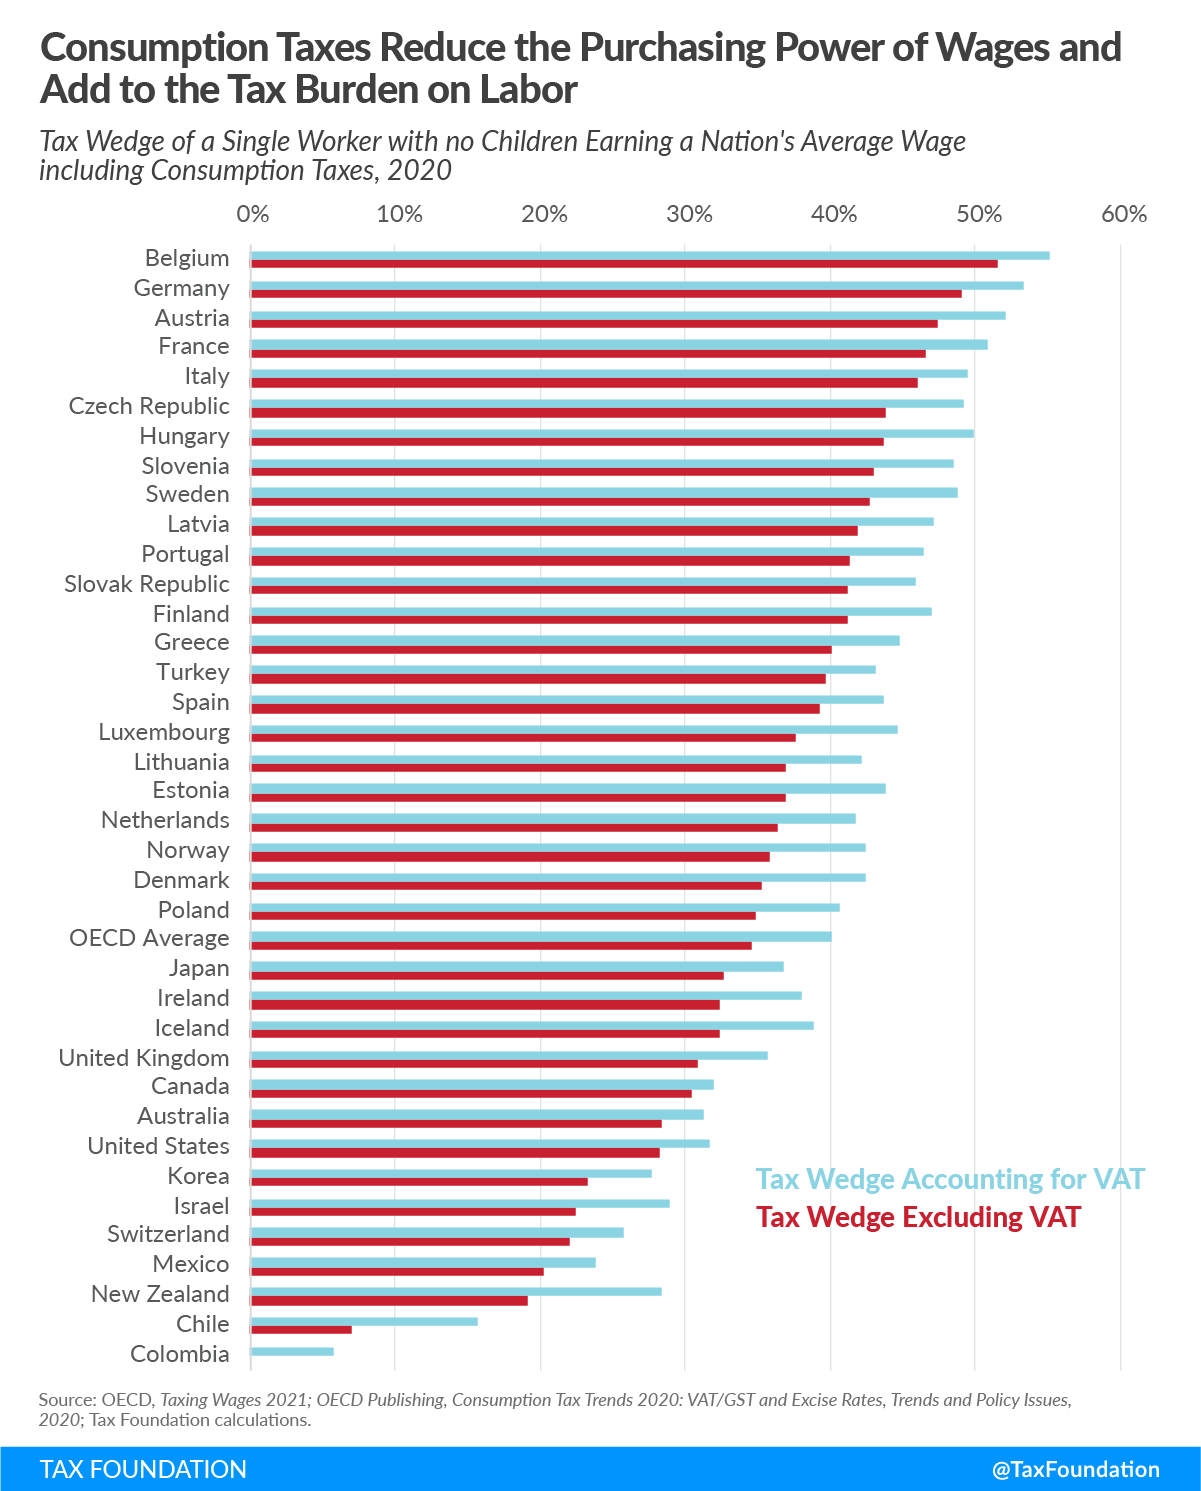
In 2020, the country with the largest difference between the two measures was New Zealand, with a tax wedge accounting for the VAT that is 28.4 percent, 9.2 percentage points larger than the tax wedge that only accounts for income and payroll taxes.
Canada had the smallest difference between the two measures, at 1.6 percentage points. This is partially because its goods and services tax rates are generally much lower than VAT rates in other OECD countries.
Tax Burden in Europe
Although the tax wedge in Europe is generally high, there is a relatively wide range. The following map illustrates how European countries differ in their tax burden on labor.
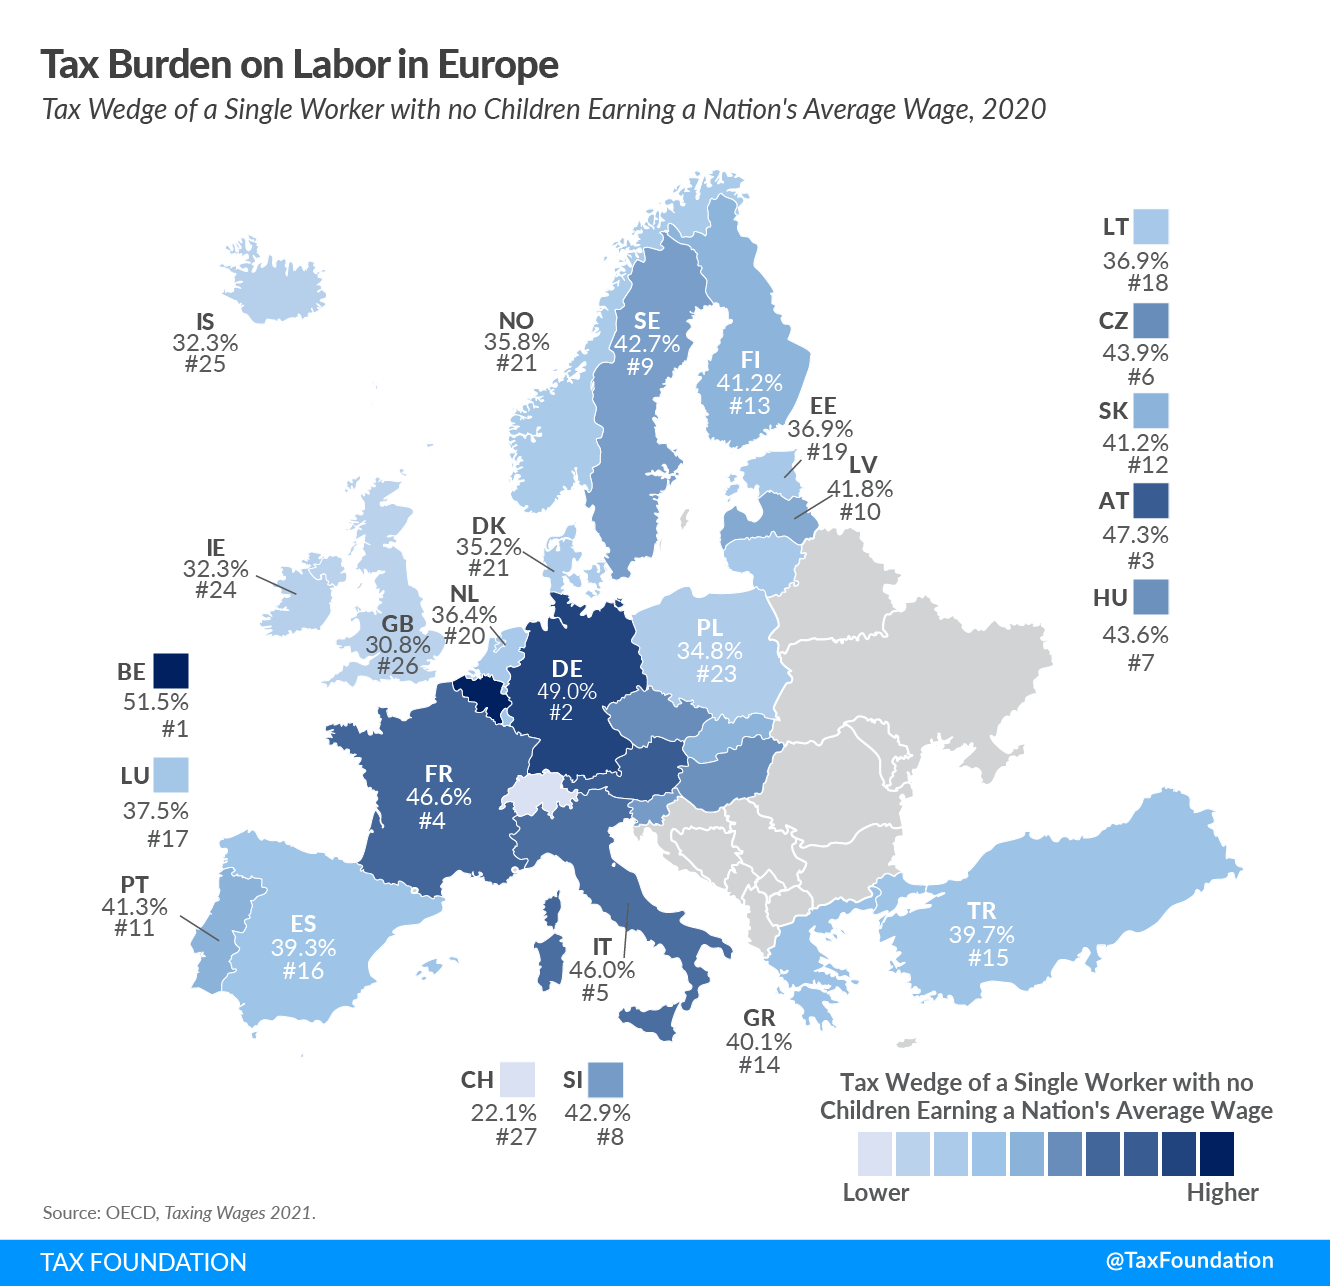
In 2020, the average tax wedge of the 27 countries covered in this map of Europe was 39.6 percent for a single worker without children, compared to the OECD average of 34.6 percent. Belgium had the highest tax burden on labor, at 51.5 percent (also the highest of all OECD countries), while Switzerland had the lowest tax burden, at 22.1 percent.
Conclusion
In 2020, single, average-wage workers paid about one-third of their wages in taxes. In most OECD countries, families had smaller tax burdens than single workers without children earning the same income, but how much less varied. Accounting for consumption taxA consumption tax is typically levied on the purchase of goods or services and is paid directly or indirectly by the consumer in the form of retail sales taxes, excise taxes, tariffs, value-added taxes (VAT), or an income tax where all savings is tax-deductible. es reveals higher tax wedges than when just accounting for income and payroll taxes. Governments with higher taxes generally explain their high tax burdens with more extensive public services. However, the cost of these services can be more than half of an average worker’s salary, and for many, at least a third of their salary.
Appendix
| Rank | Tax Wedge in % (As a Share of Labor Cost) | Income Tax in % | Employee Payroll Taxes in % | Employer Payroll Taxes in % | Total Average Annual Labor Cost Employee in $ | |
|---|---|---|---|---|---|---|
| Belgium | 1 | 51.5% | 19.2% | 11.0% | 21.3% | $80,965 |
| Germany | 2 | 49.0% | 15.7% | 16.8% | 16.6% | $84,456 |
| Austria | 3 | 47.3% | 11.4% | 14.0% | 21.9% | $81,902 |
| France | 4 | 46.6% | 11.7% | 8.3% | 26.6% | $70,841 |
| Italy | 5 | 46.0% | 14.8% | 7.2% | 24.0% | $58,889 |
| Czech Republic | 6 | 43.9% | 10.4% | 8.2% | 25.3% | $42,302 |
| Hungary | 7 | 43.6% | 12.7% | 15.7% | 15.3% | $40,247 |
| Slovenia | 8 | 42.9% | 10.0% | 19.0% | 13.9% | $41,541 |
| Sweden | 9 | 42.7% | 13.4% | 5.3% | 23.9% | $69,879 |
| Latvia | 10 | 41.8% | 13.5% | 8.9% | 19.4% | $32,802 |
| Portugal | 11 | 41.3% | 13.2% | 8.9% | 19.2% | $41,504 |
| Slovak Republic | 12 | 41.2% | 7.8% | 10.3% | 23.2% | $33,784 |
| Finland | 13 | 41.2% | 16.9% | 8.6% | 15.7% | $63,713 |
| Greece | 14 | 40.1% | 8.0% | 12.5% | 19.7% | $48,262 |
| Turkey | 15 | 39.7% | 12.0% | 12.8% | 14.9% | $43,447 |
| Spain | 16 | 39.3% | 11.4% | 4.9% | 23.0% | $55,937 |
| Luxembourg | 17 | 37.5% | 14.6% | 10.8% | 12.1% | $76,211 |
| Lithuania | 18 | 36.9% | 16.0% | 19.2% | 1.8% | $37,109 |
| Estonia | 19 | 36.9% | 10.4% | 1.2% | 25.3% | $42,136 |
| Netherlands | 20 | 36.4% | 14.5% | 11.1% | 10.8% | $77,594 |
| Norway | 21 | 35.8% | 17.0% | 7.3% | 11.5% | $71,456 |
| Denmark | 21 | 35.2% | 35.3% | 0.0% | 0.0% | $64,948 |
| Poland | 23 | 34.8% | 5.4% | 15.3% | 14.1% | $39,515 |
| Japan | 24 | 32.7% | 6.8% | 12.5% | 13.3% | $59,166 |
| Ireland | 25 | 32.3% | 18.8% | 3.6% | 10.0% | $64,086 |
| Iceland | 26 | 32.3% | 26.0% | 0.3% | 6.0% | $70,117 |
| United Kingdom | 27 | 30.8% | 12.6% | 8.4% | 9.8% | $64,161 |
| Canada | 28 | 30.4% | 14.3% | 6.8% | 9.4% | $53,570 |
| Australia | 29 | 28.4% | 22.7% | 0.0% | 5.6% | $67,199 |
| United States | 30 | 28.3% | 15.5% | 7.1% | 7.6% | $65,145 |
| Korea | 31 | 23.3% | 5.4% | 8.1% | 9.7% | $59,031 |
| Israel | 32 | 22.4% | 9.6% | 7.5% | 5.3% | $45,112 |
| Switzerland | 33 | 22.1% | 10.1% | 6.0% | 6.0% | $81,822 |
| Mexico | 34 | 20.2% | 8.4% | 1.2% | 10.5% | $15,555 |
| New Zealand | 35 | 19.1% | 19.1% | 0.0% | 0.0% | $43,493 |
| Chile | 36 | 7.0% | 0.0% | 7.0% | 0.0% | $24,050 |
| Colombia | 37 | 0.0% | 0.0% | 0.0% | 0.0% | $11,961 |
| OECD Average | 34.6% | 13.1% | 8.3% | 13.3% | $54,700 | |
| Note: Individual items may not sum to total because of rounding.
Source: OECD, Taxing Wages 2021. |
||||||
| Rank | Tax Wedge Including VAT in % (As a Share of Labor Cost and VAT) | Income Tax in % | Employee and Employer Payroll Taxes in % | VAT in % | Total Average Annual Labor Cost per Employee Including VAT in $ | |
|---|---|---|---|---|---|---|
| Belgium | 1 | 55.2% | 17.8% | 29.9% | 7.5% | $87,569 |
| Germany | 2 | 53.3% | 14.4% | 30.6% | 8.3% | $92,143 |
| Austria | 3 | 52.1% | 10.4% | 32.7% | 9.1% | $90,092 |
| France | 4 | 50.8% | 10.8% | 32.2% | 7.8% | $76,862 |
| Hungary | 5 | 49.9% | 11.3% | 27.5% | 11.1% | $45,295 |
| Italy | 6 | 49.5% | 13.9% | 29.2% | 6.4% | $62,925 |
| Czech Republic | 7 | 49.2% | 9.4% | 30.3% | 9.6% | $46,781 |
| Sweden | 8 | 48.7% | 12.0% | 26.1% | 10.6% | $78,125 |
| Slovenia | 9 | 48.5% | 9.0% | 29.7% | 9.8% | $46,036 |
| Latvia | 10 | 47.2% | 12.3% | 25.7% | 9.1% | $36,104 |
| Finland | 11 | 47.0% | 15.2% | 21.9% | 9.9% | $70,742 |
| Portugal | 12 | 46.5% | 12.0% | 25.6% | 8.9% | $45,540 |
| Slovak Republic | 13 | 45.9% | 7.1% | 30.8% | 8.0% | $36,712 |
| Greece | 14 | 44.8% | 7.3% | 29.6% | 7.8% | $52,372 |
| Luxembourg | 15 | 44.7% | 13.0% | 20.3% | 11.5% | $86,066 |
| Estonia | 16 | 43.8% | 9.3% | 23.6% | 11.0% | $47,333 |
| Spain | 17 | 43.7% | 10.6% | 25.9% | 7.2% | $60,306 |
| Turkey | 19 | 43.1% | 11.3% | 26.1% | 5.8% | $46,098 |
| Denmark | 19 | 42.5% | 31.4% | 0.0% | 11.0% | $73,002 |
| Norway | 20 | 42.5% | 15.3% | 16.8% | 10.4% | $79,745 |
| Lithuania | 21 | 42.2% | 14.6% | 19.2% | 8.4% | $40,522 |
| Netherlands | 22 | 41.8% | 13.3% | 20.1% | 8.4% | $84,731 |
| Poland | 23 | 40.6% | 4.9% | 26.8% | 8.9% | $43,357 |
| Iceland | 24 | 38.8% | 23.5% | 5.7% | 9.6% | $77,581 |
| Ireland | 25 | 38.0% | 17.2% | 12.4% | 8.4% | $69,958 |
| Japan | 26 | 36.8% | 6.4% | 24.3% | 6.1% | $63,039 |
| United Kingdom | 27 | 35.7% | 11.8% | 16.9% | 7.0% | $68,973 |
| Canada | 28 | 32.0% | 13.9% | 15.8% | 2.3% | $54,820 |
| United States | 29 | 31.7% | 15.1% | 14.3% | 2.3% | $66,675 |
| Australia | 30 | 31.3% | 21.8% | 5.4% | 4.1% | $70,070 |
| Israel | 31 | 28.9% | 8.8% | 11.7% | 8.4% | $49,242 |
| New Zealand | 32 | 28.4% | 16.9% | 0.0% | 11.4% | $49,109 |
| Korea | 33 | 27.7% | 5.1% | 16.8% | 5.8% | $62,681 |
| Switzerland | 34 | 25.7% | 9.6% | 11.4% | 4.7% | $85,858 |
| Mexico | 35 | 23.8% | 8.1% | 11.2% | 4.5% | $16,284 |
| Chile | 36 | 15.7% | 0.0% | 6.4% | 9.3% | $26,507 |
| Colombia | 37 | 5.7% | 0.0% | 0.0% | 5.7% | $12,686 |
| OECD Average | 40.1% | 12.0% | 19.8% | 8.3% | $59,626 | |
| Note: Individual items may not sum to total because of rounding. The data for the VAT Revenue Ratio used for this calculation is from 2018 and is the latest data available.
Source: OECD, Taxing Wages 2021; OECD Publishing, Consumption Tax Trends 2020: VAT/GST and Excise Rates, Trends and Policy Issues, 2020; Tax Foundation calculations. |
||||||
Methodology
Tax Wedges Accounting for VAT
The formula for calculating tax wedges that accounts for VAT utilizes the VAT rates and the VAT revenue ratio (VRR) from the OECD’s Consumption Tax Trends 2020: VAT/GST and Excise Rates, Trends and Policy Issues.[12],[13] We first calculate the tax-inclusive VAT rate, which is VAT rate/(1 + VAT rate). Next, we multiply the tax-inclusive VAT rate by the VAT revenue ratio and by the total labor cost to calculate the VAT amount. The formula for calculating the tax wedge including the VAT is then:

VAT/sales taxes are in both the numerator and the denominator because the tax wedge is taxes on labor as a share of total labor costs. For employees, VAT/sales taxes are part of taxes on labor, and they are also part of the total labor costs that employers face. By definition, a VAT is the rate of tax placed on the value added by a business by employing capital and labor. The added value is measured by the difference between the purchase price of materials and the sale of those materials (most often after a business turns those materials into something more useful). Though businesses may raise prices to pass the cost of a VAT or sales tax on to consumers in the short run, over the long run, the economic incidence of the VAT falls on workers.[14]
[1] Cristina Enache, “Sources of Government Revenue in the OECD,” Tax Foundation, Feb. 11, 2021, https://www.taxfoundation.org/publications/sources-of-government-revenue-in-the-oecd/.
[2] OECD Publishing, Taxing Wages 2021, https://www.oecd.org/ctp/tax-policy/taxing-wages-20725124.htm.
[3] Scott A. Hodge and Bryan Hickman, “The Importance of the Tax Wedge on Labor in Evaluating Tax Systems,” Tax Foundation, 2018, /wp-content/uploads/2018/09/Global-Primer_tax_wedge.pdf.
[4] Congressional Budget Office, “The Distribution of Household Income and Federal Taxes, 2013,” June 8, 2016, https://www.cbo.gov/publication/51361.
[5] Individual items may not sum to total because of rounding.
[6] In Colombia, the single worker at the average wage level does not pay personal income tax. Also, contributions to pension, health, and employment risk insurances are considered to be nontax compulsory payments (NTCPs) and therefore are not included as taxes in the OECD publication.
[7] See Table 2 in the Appendix.
[8] In this case the OECD calculated the marginal rates by increasing gross earnings by 1 percentage point in order to reduce the number of calculations as marginal rates needed to be calculated for every single currency unit within the income range included.
[9] OECD Publishing, Taxing Wages 2021..
[10] Employer contribution tax rate for illness, pregnancy, disability, and death is 7 percent up to 2.5 times the minimum wage. For wages that exceed 2.5 times the minimum wage a 13 percent rate applies. See OECD Publishing, Taxing Wages 2021.” .
[11] Regional and local income surcharge taxes in Italy have five tax bracketA tax bracket is the range of incomes taxed at given rates, which typically differ depending on filing status. In a progressive individual or corporate income tax system, rates rise as income increases. There are seven federal individual income tax brackets; the federal corporate income tax system is flat. s. However, if the taxable incomeTaxable income is the amount of income subject to tax, after deductions and exemptions. For both individuals and corporations, taxable income differs from—and is less than—gross income. is under the threshold the lowest tax rate is applicable, but once it surpasses that amount the third tax bracket will be applied. See OECD Publishing, Taxing Wages 2021.
[12] OECD Publishing, Consumption Tax Trends 2020: VAT/GST and Excise Rates, Trends and Policy Issues, 2020, https://doi.org/10.1787/152def2d-en.
[13] The most recent OECD data available for the VAT revenue ratio is from 2018. VAT rates are from 2020. The U.S. sales tax rate is the average of all U.S. state sales tax rates (weighted by population); see Janelle Cammenga, “State and Local Sales Tax Rates, 2019,” Tax Foundation, Jan. 30, 2019, https://www.taxfoundation.org/sales-tax-rates-2019/. The U.S. sales tax revenue ratio was calculated as the ratio of the implicit sales tax base to state personal income.
[14] Eric Toder, James R. Nunns, and Joseph Rosenberg, “Implications of Different Bases for a VAT,” Tax Policy Center and The Pew Charitable Trusts, Feb. 14, 2012, https://www.taxpolicycenter.org/publications/implications-different-bases-vat/full.
Share