State Individual Income Tax Rates and Brackets, 2026
Individual income taxes are a major source of state government revenue, accounting for more than a third of state tax collections. How do income taxes compare in your state?
9 min readProviding journalists, taxpayers and policymakers with basic data on taxes and spending is a cornerstone of the Tax Foundation’s educational mission. We’ve found that one of the best, most engaging ways to do that is by visualizing tax data in the form of maps.
How does your state collect revenue? Every week, we release a new tax map that illustrates one important measure of state tax rates, collections, burdens and more. If you enjoy our weekly tax maps, help us continue this work and more by making a small contribution here.

Individual income taxes are a major source of state government revenue, accounting for more than a third of state tax collections. How do income taxes compare in your state?
9 min read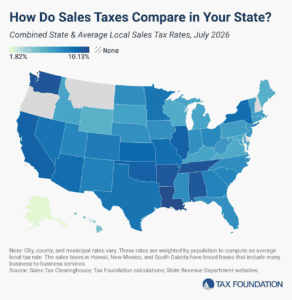
The five states with the highest average combined state and local sales tax rates are Louisiana (10.13 percent), Tennessee (9.61 percent), Washington (9.57 percent), Arkansas (9.48 percent), and Alabama (9.46 percent).
8 min read
Forty-four states levy a corporate income tax, with top rates ranging from a 2 percent flat rate in North Carolina to an 11.5 percent top marginal rate in New Jersey. Four states—Georgia, Nebraska, North Carolina, and Pennsylvania—reduced their corporate income tax rates effective January 1, 2026.
5 min read
Property taxes are the primary tool for financing local governments. While no taxpayers in high-tax jurisdictions will be celebrating their yearly payments, property taxes are largely rooted in the benefit principle of taxation: the people paying the property tax bills are most often the ones benefiting from the services.
9 min read
Millions of Americans, along with significant amounts of income and economic activity, are moving from high-tax states to those with more competitive tax systems and lower overall costs of living.
8 min read
The amount of revenue states raise through roadway-related revenues varies significantly across the US. Only two states raise enough revenue to fully cover their highway spending.
5 min read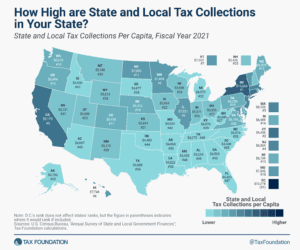
Contrary to initial expectations, the pandemic years were good for state and local tax collections, and while the surges of 2021 and 2022 have not continued into calendar year 2023, revenues remain robust in most states and well above pre-pandemic levels even after accounting for inflation.
5 min read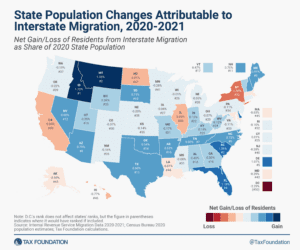
The latest IRS and Census data show that people and businesses favor states with low and structurally sound tax systems, which can impact the state’s economic growth and governmental coffers.
8 min read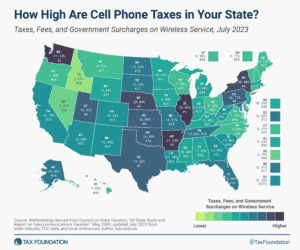
To alleviate the regressive impact on wireless consumers, states should examine their existing communications tax structures and consider policies that transition their tax systems away from narrowly based wireless taxes and toward broad-based tax sources.
18 min read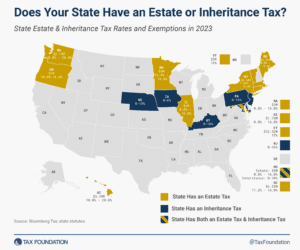
In addition to the federal estate tax, with a top rate of 40 percent, some states levy an additional estate or inheritance tax.
4 min read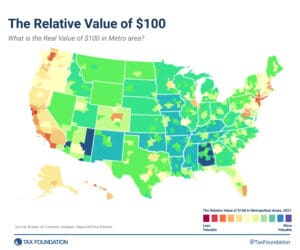
The differences in purchasing power can be large and they have significant implications for the relative impact of economic and tax policies across the United States.
3 min read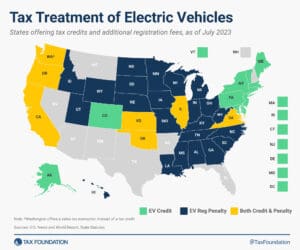
The state EV taxation landscape reflects the evolving transportation sector and the pressing need to address both fiscal gaps in road funding and environmental concerns.
4 min read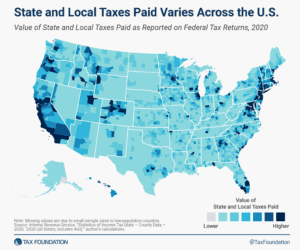
Any move to repeal the cap or enhance the deduction would disproportionately benefit higher earners, making the tax code more regressive.
5 min read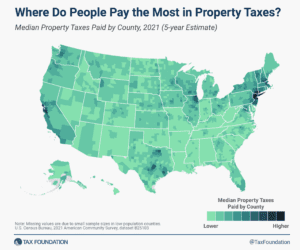
Property taxes are the primary tool for financing local governments and generate a significant share of state and local revenues.
6 min read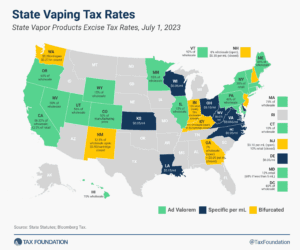
If the policy goal of taxing cigarettes is to encourage cessation, vapor taxation must be considered a part of that policy design.
3 min read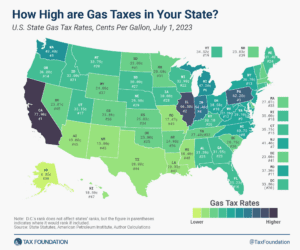
California pumps out the highest state gas tax rate of 77.9 cents per gallon (cpg), followed by Illinois (66.5 cpg) and Pennsylvania (62.2 cpg).
2 min read
However well-intended they may be, sales tax holidays remain the same as they always have been—ineffective and inefficient.
4 min read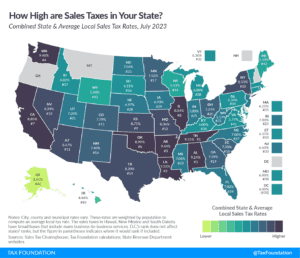
Compare the latest 2023 sales tax rates as of July 1st. Sales tax rate differentials can induce consumers to shop across borders or buy products online.
8 min read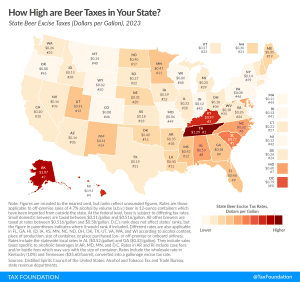
Taxes are the single most expensive ingredient in beer, costing more than the labor and raw materials combined.
3 min read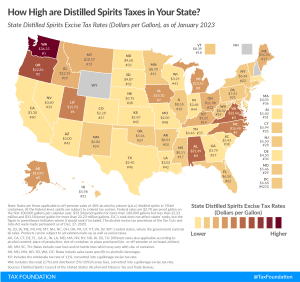
Of all alcoholic beverages subject to taxation, stiff drinks—and all distilled spirits—face the stiffest tax rates. Like many excise taxes, the treatment of distilled spirits varies widely across the states.
4 min read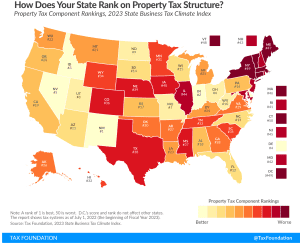
States are in a better position to attract business investment when they maintain competitive real property tax rates and avoid harmful taxes on tangible personal property, intangible property, wealth, and asset transfers.
5 min read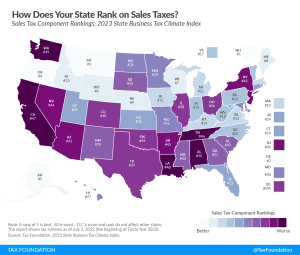
An ideal sales tax applies to a broad base of final consumer goods and services, with few exemptions, and is levied at a low rate.
5 min read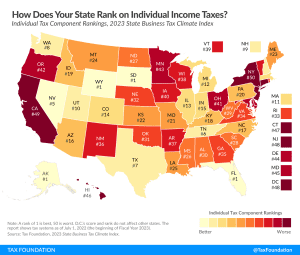
Individual income tax rates can influence location decision-making, especially in an era of enhanced mobility, where it is easier for individuals to move without jeopardizing their current job, or without limiting the scope of their search for a new one.
5 min read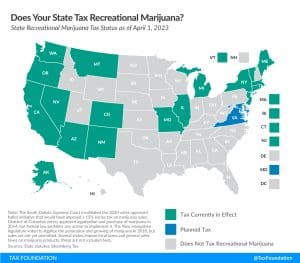
Recreational marijuana taxation is one of the hottest policy issues in the U.S. Currently, 21 states have implemented legislation to legalize and tax recreational marijuana sales.
6 min read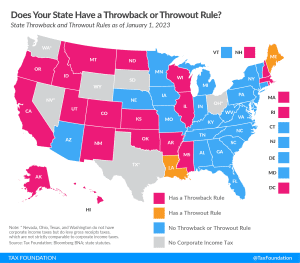
While throwback and throwout rules in states’ corporate tax codes may not be widely understood, they have a notable impact on business location and investment decisions and reduce economic efficiency.
4 min read
Facts & Figures serves as a one-stop state tax data resource that compares all 50 states on over 40 measures of tax rates, collections, burdens, and more.
2 min read