State Individual Income Tax Rates and Brackets, 2026
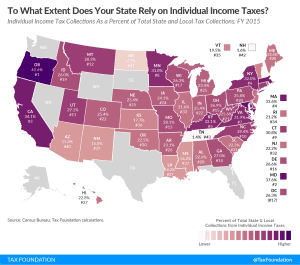
Individual income taxes are a major source of state government revenue, accounting for more than a third of state tax collections. How do income taxes compare in your state?
9 min readProviding journalists, taxpayers and policymakers with basic data on taxes and spending is a cornerstone of the Tax Foundation’s educational mission. We’ve found that one of the best, most engaging ways to do that is by visualizing tax data in the form of maps.
How does your state collect revenue? Every week, we release a new tax map that illustrates one important measure of state tax rates, collections, burdens and more. If you enjoy our weekly tax maps, help us continue this work and more by making a small contribution here.

Individual income taxes are a major source of state government revenue, accounting for more than a third of state tax collections. How do income taxes compare in your state?
9 min read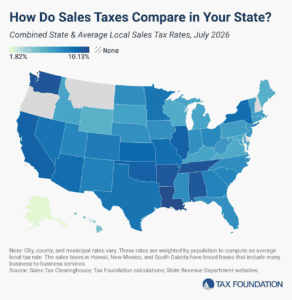
The five states with the highest average combined state and local sales tax rates are Louisiana (10.13 percent), Tennessee (9.61 percent), Washington (9.57 percent), Arkansas (9.48 percent), and Alabama (9.46 percent).
8 min read
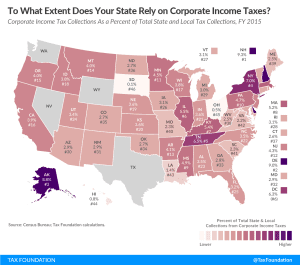
Forty-four states levy a corporate income tax, with top rates ranging from a 2 percent flat rate in North Carolina to an 11.5 percent top marginal rate in New Jersey. Four states—Georgia, Nebraska, North Carolina, and Pennsylvania—reduced their corporate income tax rates effective January 1, 2026.
5 min read
Property taxes are the primary tool for financing local governments. While no taxpayers in high-tax jurisdictions will be celebrating their yearly payments, property taxes are largely rooted in the benefit principle of taxation: the people paying the property tax bills are most often the ones benefiting from the services.
9 min read
Millions of Americans, along with significant amounts of income and economic activity, are moving from high-tax states to those with more competitive tax systems and lower overall costs of living.
8 min read
The amount of revenue states raise through roadway-related revenues varies significantly across the US. Only two states raise enough revenue to fully cover their highway spending.
5 min read
Sales tax holidays are not sound tax policy as they create complexities for all involved, while inserting the political process into consumer decisions.
45 min read
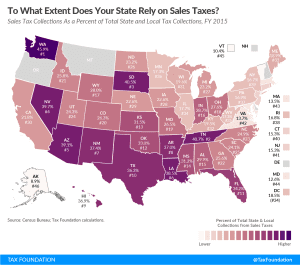
Sales taxes represent a major source of state and local revenue. Click to see how much your state relies on sales taxes and for a state-by-state comparison.
3 min read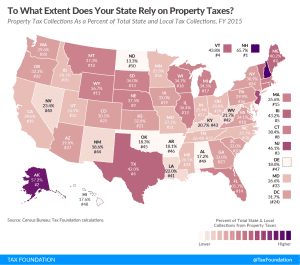
A look at the data & methodology behind the Tax Foundation’s Mapping 2018 Tax Reform project which compares average 2018 tax cuts by congressional district.
3 min read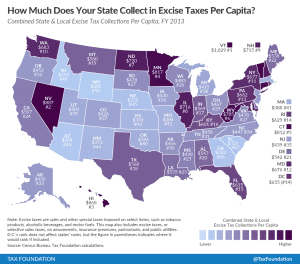
Excise taxes make up a relatively small portion of state and local tax collections—about 11 percent—but per capita collections vary widely from state to state.
3 min read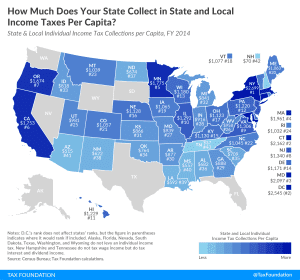
On average, state and local governments collected $1,144 per person from individual income taxes, but collections varied widely from state to state.
2 min read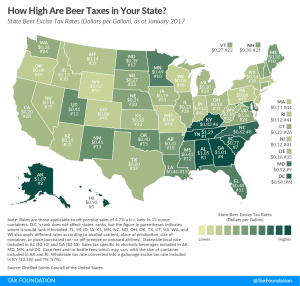
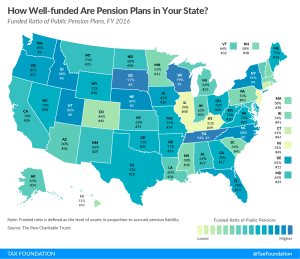
More than half the states have pension plans that are less than two-thirds funded, and five states have pension plans that are less than 50 percent funded.
2 min read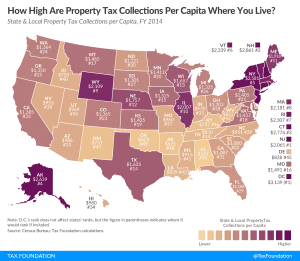
While property taxes inevitably draw the ire of some residents living in high-tax jurisdictions, property values are a relatively good indicator of the value of local services received, such as well-funded roads and schools. At the same time, good local public services can make municipalities more desirable, thereby increasing residential property value.
3 min read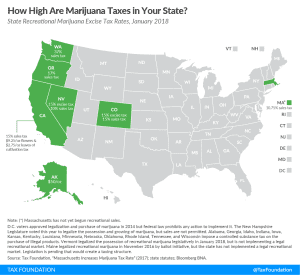
As public opinion increasingly favors the legalization of recreational marijuana, a growing number of states must determine how to structure marijuana taxes.
3 min read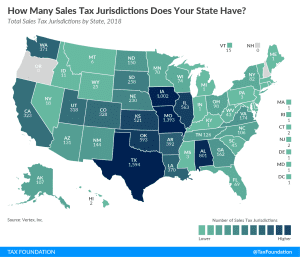
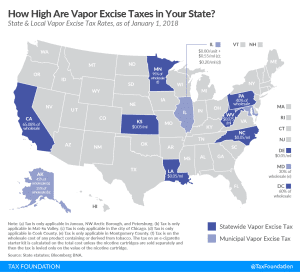
A variety of taxing methods and a wide range of rates indicates that there is little consensus on the best way to levy vapor taxes in the U.S.
3 min read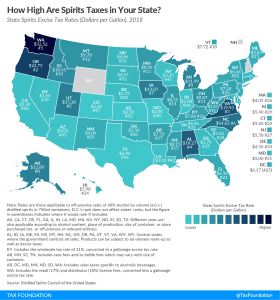

Individual income tax rates and brackets vary widely by state. Keep track of top marginal income tax rates in your state and others with our new guide.
4 min read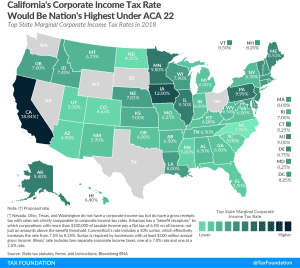

In addition to state-level sales taxes, consumers also face local sales taxes in 38 states. These rates can be substantial, so a state with a moderate statewide sales tax rate could actually have a very high combined state and local rate.
11 min read