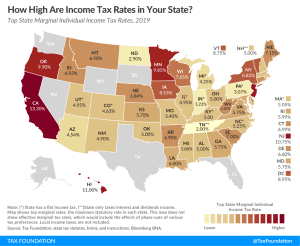
State Individual Income Tax Rates and Brackets, 2026
Individual income taxes are a major source of state government revenue, accounting for more than a third of state tax collections. How do income taxes compare in your state?
9 min readProviding journalists, taxpayers and policymakers with basic data on taxes and spending is a cornerstone of the Tax Foundation’s educational mission. We’ve found that one of the best, most engaging ways to do that is by visualizing tax data in the form of maps.
How does your state collect revenue? Every week, we release a new tax map that illustrates one important measure of state tax rates, collections, burdens and more. If you enjoy our weekly tax maps, help us continue this work and more by making a small contribution here.

Individual income taxes are a major source of state government revenue, accounting for more than a third of state tax collections. How do income taxes compare in your state?
9 min read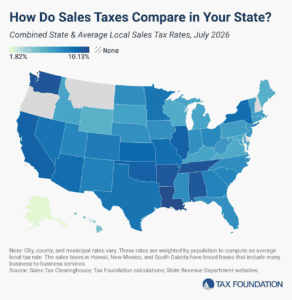
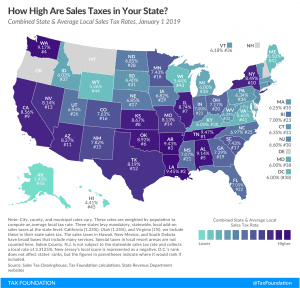
The five states with the highest average combined state and local sales tax rates are Louisiana (10.13 percent), Tennessee (9.61 percent), Washington (9.57 percent), Arkansas (9.48 percent), and Alabama (9.46 percent).
8 min read
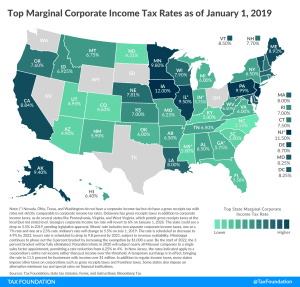
Forty-four states levy a corporate income tax, with top rates ranging from a 2 percent flat rate in North Carolina to an 11.5 percent top marginal rate in New Jersey. Four states—Georgia, Nebraska, North Carolina, and Pennsylvania—reduced their corporate income tax rates effective January 1, 2026.
5 min read
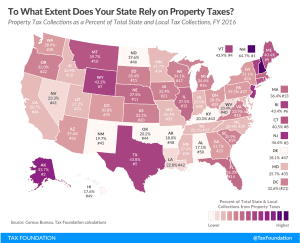
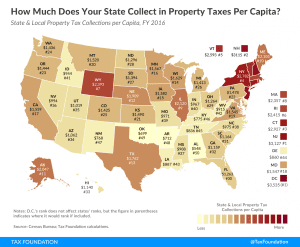
Property taxes are the primary tool for financing local governments. While no taxpayers in high-tax jurisdictions will be celebrating their yearly payments, property taxes are largely rooted in the benefit principle of taxation: the people paying the property tax bills are most often the ones benefiting from the services.
9 min read
Millions of Americans, along with significant amounts of income and economic activity, are moving from high-tax states to those with more competitive tax systems and lower overall costs of living.
8 min read
The amount of revenue states raise through roadway-related revenues varies significantly across the US. Only two states raise enough revenue to fully cover their highway spending.
5 min read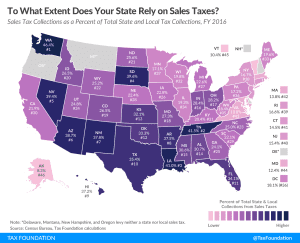
Many states are seeing a significant narrowing of their bases as lawmakers continue to carve out exemptions, and as consumption patterns shift ever more towards relatively-untaxed services.
4 min read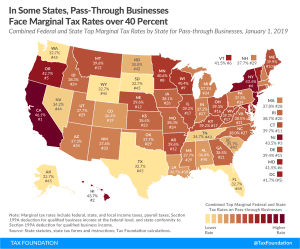
Pass-through businesses are now the dominant business form in the U.S., making up more than half of the private sector workforce in every state. Federal taxes on income set a minimum tax rate for pass throughs, but marginal rates for pass throughs vary based on how states tax individual income.
3 min read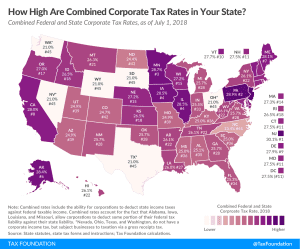
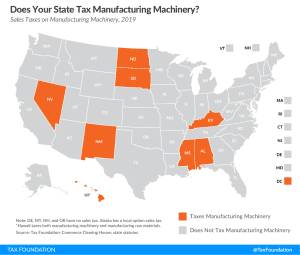
The Tax Cuts and Jobs Act (TCJA) reduced the U.S. federal corporate income tax rate from 35 percent to 21 percent. However, most U.S. states also tax corporate income. These state-level taxes mean the average statutory corporate income tax rate in the U.S., which combines the average of state corporate income tax rates with the federal corporate income tax rate, is 25.8 percent in 2019.
2 min read
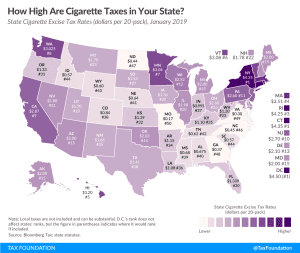
Cigarette taxes around the country are levied on top of the federal rate of $1.0066 per 20-pack of cigarettes. As of 2016, taxes accounted for almost half of the retail cost of a pack of cigarettes.
2 min read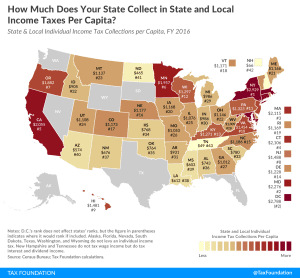
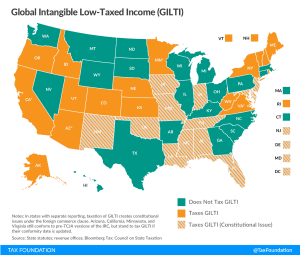
The new federal tax on Global Intangible Low-Taxed Income (GILTI) is something of a misnomer: it’s certainly global and it’s definitely income, but the rest of it is, at best, an approximation. It’s not exclusively levied on low-taxed income, nor just on the economic returns from intangible property. So what is GILTI, why might states tax it, and what’s the problem with that?
8 min read