Every year, millions of Americans pack up and move from one state to another, providing unique insights into what people value when deciding where to live, work, do business, and raise a family. For many years, policymakers, journalists, and taxpayers have debated the role state taxA tax is a mandatory payment or charge collected by local, state, and national governments from individuals or businesses to cover the costs of general government services, goods, and activities. policy plays in individuals’ and businesses’ location decisions. Annual data about who is moving—and where—provide clues about the factors contributing to these moves.
Many factors influence an individual’s or family’s decision to move from one state to another: employment or educational opportunities, proximity to family or friends, and geographic and lifestyle preferences like weather, natural landscape, and population density, to name a few. Cost-of-living considerations, including tax differentials, may not be the primary reason for an interstate move, but they are often one of several factors people consider when deciding whether—and where—to move.
Each year, the IRS releases migration data showing the movements of income taxpayers based on changes in their mailing address between filing one year’s income tax return and the next. The most recent data generally show location changes that occurred between when taxpayers filed their tax year 2020 returns in calendar year 2021 and when they filed their tax year 2021 returns in calendar year 2022. These data, therefore, capture many of the interstate moves made during and in the aftermath of the COVID-19 pandemic.
Non-governmental datasets, U-Haul and United Van Lines, have the advantage of being especially timely, shedding light on moves that occurred even more recently, but the IRS data are by definition more comprehensive and provide important insights into the movement of adjusted gross income (AGI) among states.
Winners and Losers of Interstate Migration: States
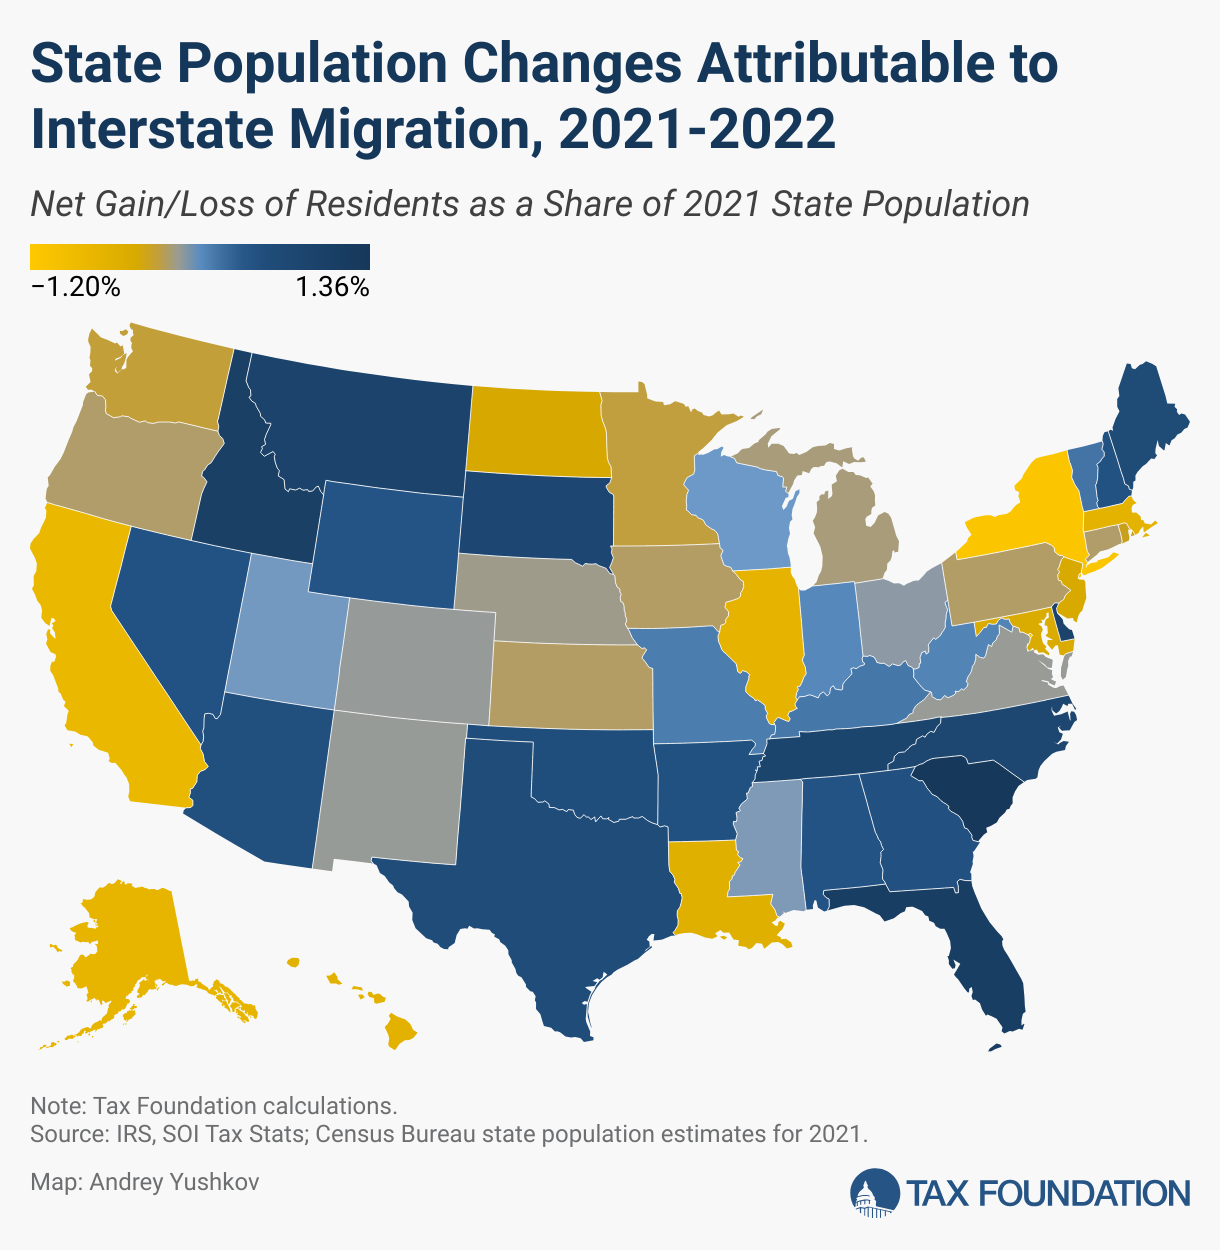
The IRS data show that between 2021 and 2022, 26 states experienced a net gain in income tax filers from interstate migration, led by Florida (+125,551), Texas (+88,216), North Carolina (+43,653), South Carolina (+32,927), and Tennessee (+30,935). Conversely, 24 states and the District of Columbia experienced a net loss, led by California (-144,203), New York (-108,586), Illinois (-45,460), Massachusetts (-26,033), and New Jersey (-20,820).
Indiana and Wisconsin saw a loss in tax returns attributable to interstate migration but a gain in individuals associated with the returns of those who moved in (implying that bigger families moved in, while smaller families moved out). Oregon, Washington, and Colorado, in contrast, saw a gain in tax returns but a loss in the total number of individuals on those returns. States with the highest net adjusted gross incomeFor individuals, gross income is the total of all income received from any source before taxes or deductions. It includes wages, salaries, tips, interest, dividends, capital gains, rental income, alimony, pensions, and other forms of income. For businesses, gross income (or gross profit) is the sum of total receipts or sales minus the cost of goods sold (COGS)—the direct costs of producing goods, including inventory and certain labor costs. gains included Florida at $36.0 billion, Texas at $10.1 billion, and several states (North Carolina, Arizona, Tennessee, and South Carolina) at around $4 billion each. States with the highest net AGI losses included California at -$23.8 billion, New York at -$14.1 billion, Illinois at -$9.8 billion, New Jersey at -$5.3 billion, and Massachusetts at -$3.9 billion.
The map below shows the gains and losses in income tax returns filed, the number of residents on those tax returns, and the AGI attributable to interstate migration for each state.
Winners and Losers of Interstate Migration: Counties
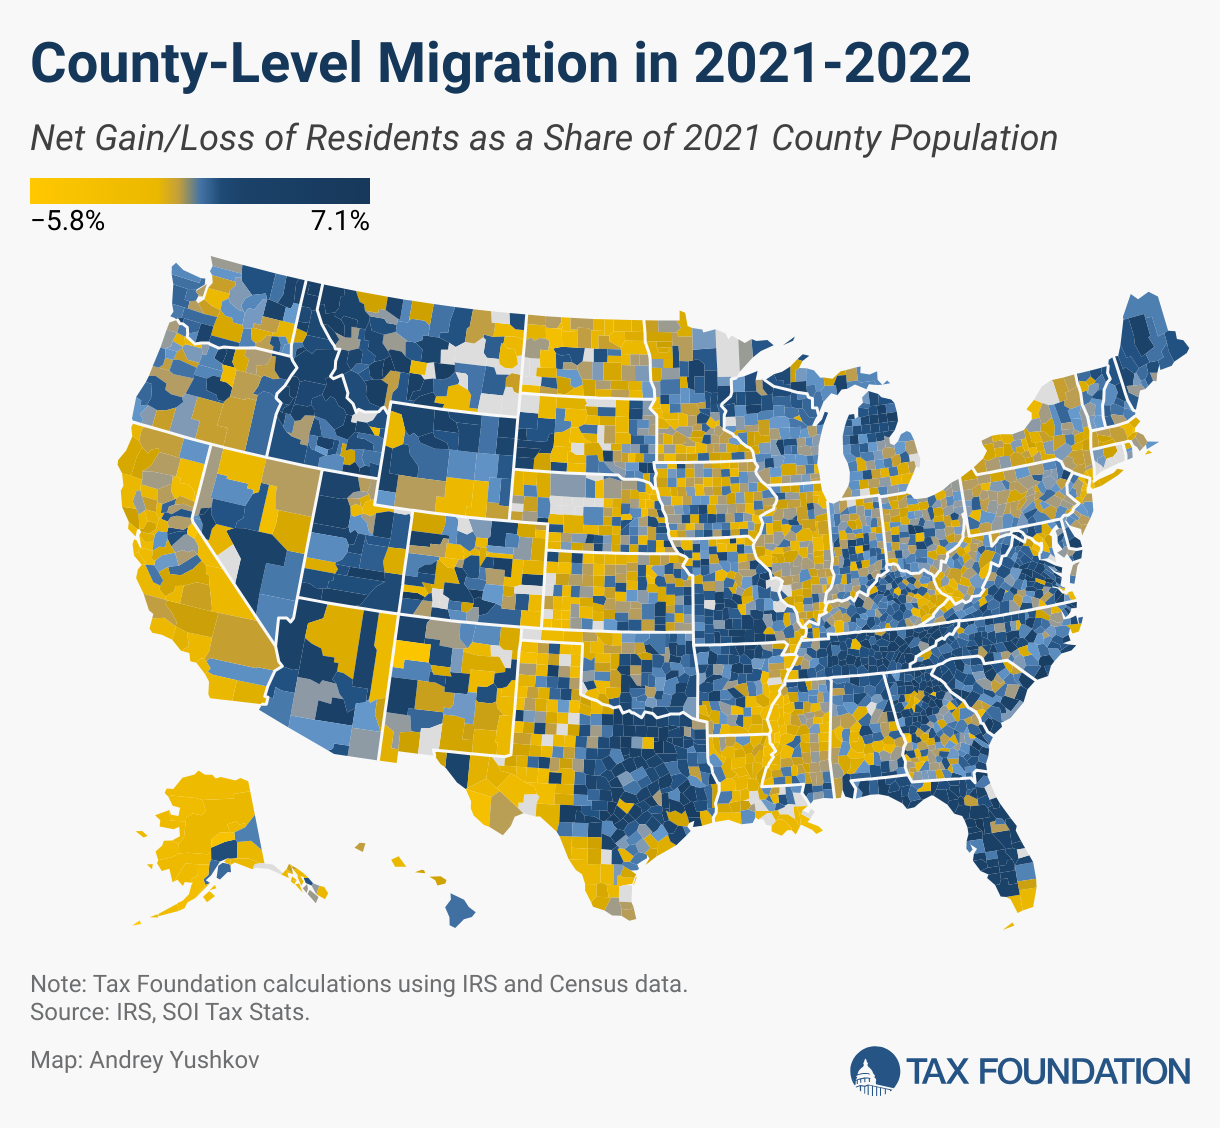
County-level migration patterns reflect the trends observed at the state level. Among the 10 counties with the highest net gains in income tax filers from interstate migration are four Texas counties: Collin County (+8,298), Montgomery County (+8,296), Denton County (+8,221), and Williamson County (+8,206); three Florida counties: Polk County (+12,213), Pasco County (+9,649), and Lee County (+7,987); Clark County, NV (+8,403); Horry County, SC (+7,055); and Maricopa County, AZ (+6,993).
Among the 10 counties with the highest net losses are four California counties: Los Angeles County (-52,921), Orange County (-14,997), Santa Clara County (-12,457), and Alameda County (-11,991); three New York City boroughs (which are coterminous with counties): Queens (-25,056), the Bronx (-23,549), and Brooklyn (-22,467); Cook County, IL (-29,463); Miami-Dade County, FL (-13,998); and Philadelphia County, PA (-9,901).
Three Florida counties gained the most in net AGI: Palm Beach County (+$4.9 billion), Collier County (+$4.4 billion), and Sarasota County (+$2.6 billion). Meanwhile, Cook County, IL (-$7.2 billion) and two California counties, Los Angeles County (-$6.2 billion) and Santa Clara County (-$5.8 billion), lost the most in net AGI. While in-state moves are always common, a disproportionate share of the AGI outflow from Miami moved to elsewhere in Florida.
Interestingly, county-level migration patterns were not homogeneous within some states. For instance, metropolitan areas in Texas, including Austin and Dallas, experienced positive net migration, while rural counties in southwest Texas saw an outmigration of taxpayers. Meanwhile, states like Florida and Tennessee experienced net gains in income tax filers and AGI virtually across the board, whereas Louisiana had virtually no parishes with net gains.
The map below shows county-level migration patterns in 2021-2022 and distinguishes between migration to/from different states and in-state migration.
More Americans Moved to States with Lower Taxes and Sound Tax Structures
As visible in last year’s version of this publication, it is clear from the 2021-2022 IRS migration data that there is a strong positive relationship between state tax competitiveness and net migration. Overall, states with lower taxes and sound tax structures experienced stronger inbound migration than states with higher taxes and more burdensome tax structures.
Of the 10 states that experienced the largest gains in income taxpayers, 4 do not levy individual income taxes on wage or salary income at all. Additionally, 8 of the top 10 states either forgo individual income taxes on wage and salary income, have a flat income tax, or are moving to a flat income tax.
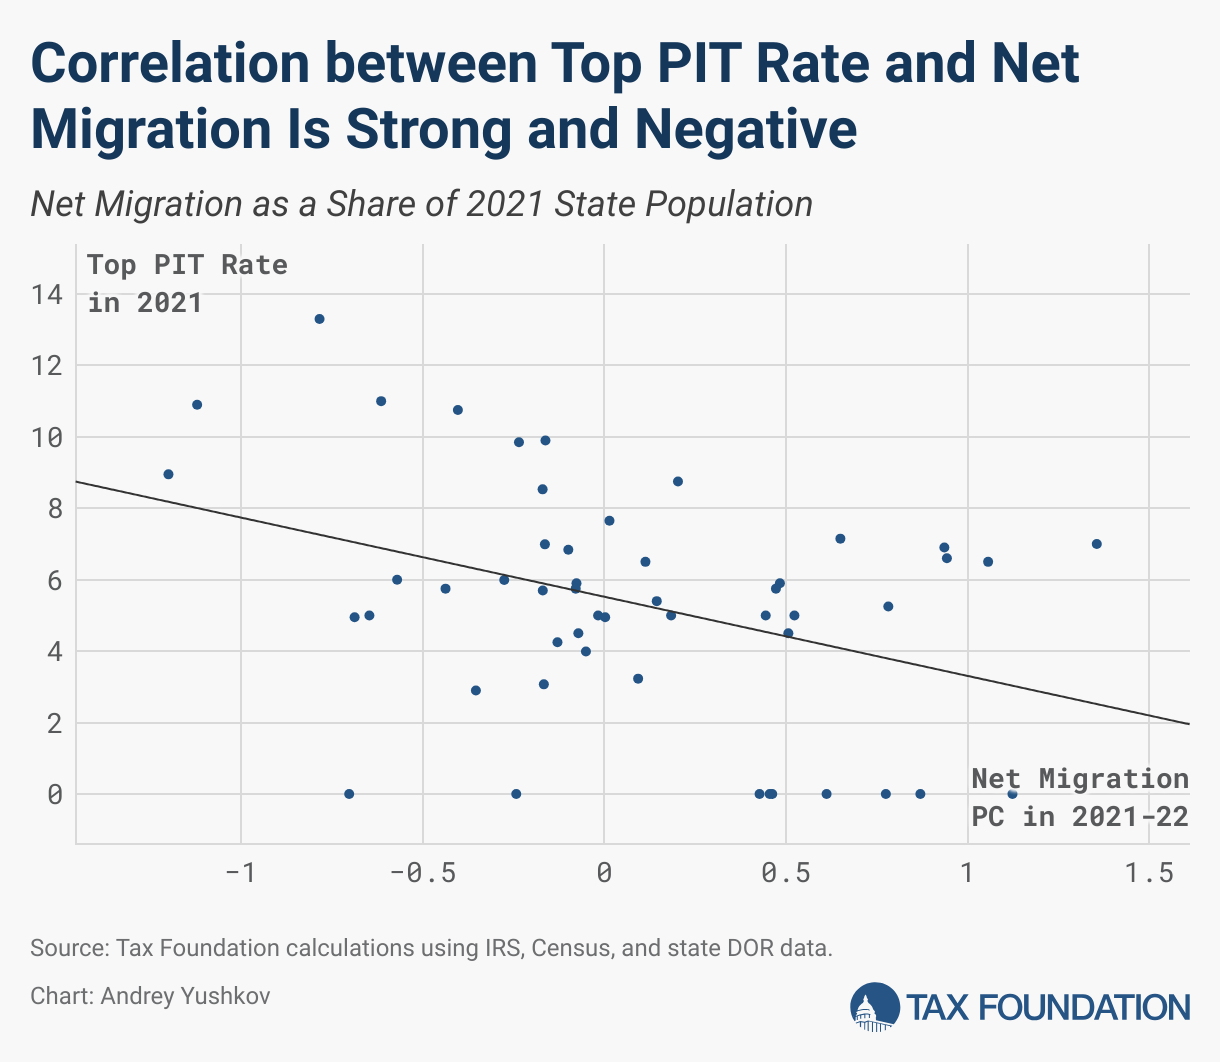
Among the 26 states that experienced net inbound migration of income tax filers, only 10 had a top marginal individual income taxAn individual income tax (or personal income tax) is levied on the wages, salaries, investments, or other forms of income an individual or household earns. The U.S. imposes a progressive income tax where rates increase with income. The Federal Income Tax was established in 1913 with the ratification of the 16th Amendment. Though barely 100 years old, individual income taxes are the largest source of tax revenue in the U.S. rate above the national median, which stood at 5.7 percent in 2021 (and by now has gone down to 5 percent). Meanwhile, among the 24 states (and the District of Columbia) that experienced net outbound migration of income tax filers, 15 states and DC had top marginal rates above the median. In aggregate, states with a top marginal rate at or below the 2021 median of 5.7 percent gained 248,794 net new tax returns (493,662 individuals, including spouses and children). The strong negative relationship between net migration and the top state individual income tax is illustrated in the figure below.
Furthermore, a strong positive relationship exists between states with well-structured tax codes and those that experience net inbound migration. Among the 25 best-ranking states on the 2022 State Business Tax Climate Index, which had a snapshot date of July 1, 2021, 17 states experienced net inbound migration between 2021 and 2022. Meanwhile, among the 25 worst-ranking states on the Index (and the District of Columbia), 18 experienced a net loss of taxpayers to interstate migration.
Why Interstate Migration Matters
One reason policymakers should care about their state’s interstate migration patterns is the effect of interstate migration on tax revenue, economic output, and economic growth over time. Between 2021 and 2022, most states that experienced a net loss in income tax filers attributable to interstate migration also experienced a net loss in income associated with interstate migration, while most states that gained taxpayers also experienced corresponding gains in AGI.
Hawaii and Mississippi were among the states that lost residents on net and yet experienced a net gain in AGI, with new residents bringing in higher AGI per return than departing residents. Meanwhile, four states—West Virginia, Oregon, Washington, and Missouri—saw a net gain in income tax filers but a net loss in AGI, with new residents earning less on average than the people who moved out. Some of this is due to cost-of-living adjustments that tend to occur when individuals leave employment in one state for employment in another. For example, even if their job duties are substantially similar, a registered nurse employed in a high-cost-of-living state is likely to have a higher salary than one employed in a lower-cost-of-living state due to cost-of-living considerations that affect market rate earnings in different parts of the country.
There is evidence, however, that in states like Hawaii, the loss of relatively lower-income residents is somewhat attributable to high taxes and high costs of living causing lower- and middle-income residents to seek more affordable destinations elsewhere. Notably, four of the top five states Hawaii residents moved to—Texas, Washington, Nevada, and Florida—forgo individual income taxes on wage income. Likewise, some of the increase in relatively lower-income residents in Indiana, Kentucky, and Missouri is likely due to the relatively low cost of living in those states compared to other locations. Crucially for economic growth, however, a low-tax environment may encourage investment and entrepreneurial decision-making and attract highly mobile higher earners as well.
Higher-Income Residents Moved to Low-Tax States
The IRS data also show interstate migration broken down by AGI level. Among taxpayers with $200,000 or more in AGI, the most attractive destinations were Florida, Texas, North Carolina, South Carolina, and Arizona, while the least attractive states were California, New York, Illinois, Massachusetts, and New Jersey. On net, Florida gained 29,771 affluent taxpayers with $200,000 or more in AGI (increasing the state’s combined AGI by $28.7 billion), while California lost 24,670 of them (reducing the state’s combined AGI by $16.1 billion). Several of the states losing higher-income taxpayers—especially New York, California, and New Jersey—have highly progressive tax codes under which tax liability rises steeply with income. States that structure their tax codes in this manner have consistently lost higher-income residents to lower-tax states, and not only the residents, but also any associated tax revenue and entrepreneurial activity that goes along with them.
Sometimes taxpayers choose to move to a lower-tax state, at least in part, to reduce their own tax burden. Recent academic research generally supports this claim using modern causal analysis methods. But even those who do not consciously select for lower taxes may indirectly do so when they prioritize job opportunities and other factors related to a state’s economic competitiveness.
While taxes are just one factor influencing the location decisions of individuals and businesses, they are an important factor—and one within policymakers’ control. States that prioritize structurally sound tax policy improvements will reap the economic benefits that come with creating an attractive fiscal landscape in which all individuals and businesses have the opportunity to thrive.
Stay informed on the tax policies impacting you.
Subscribe to get insights from our trusted experts delivered straight to your inbox.
Subscribe