Americans were on the move in 2023, and many chose low-tax states over high-tax ones. That’s the finding of recent U.S. Census Bureau interstate migration data and commercial datasets released last week by U-Haul and United Van Lines.
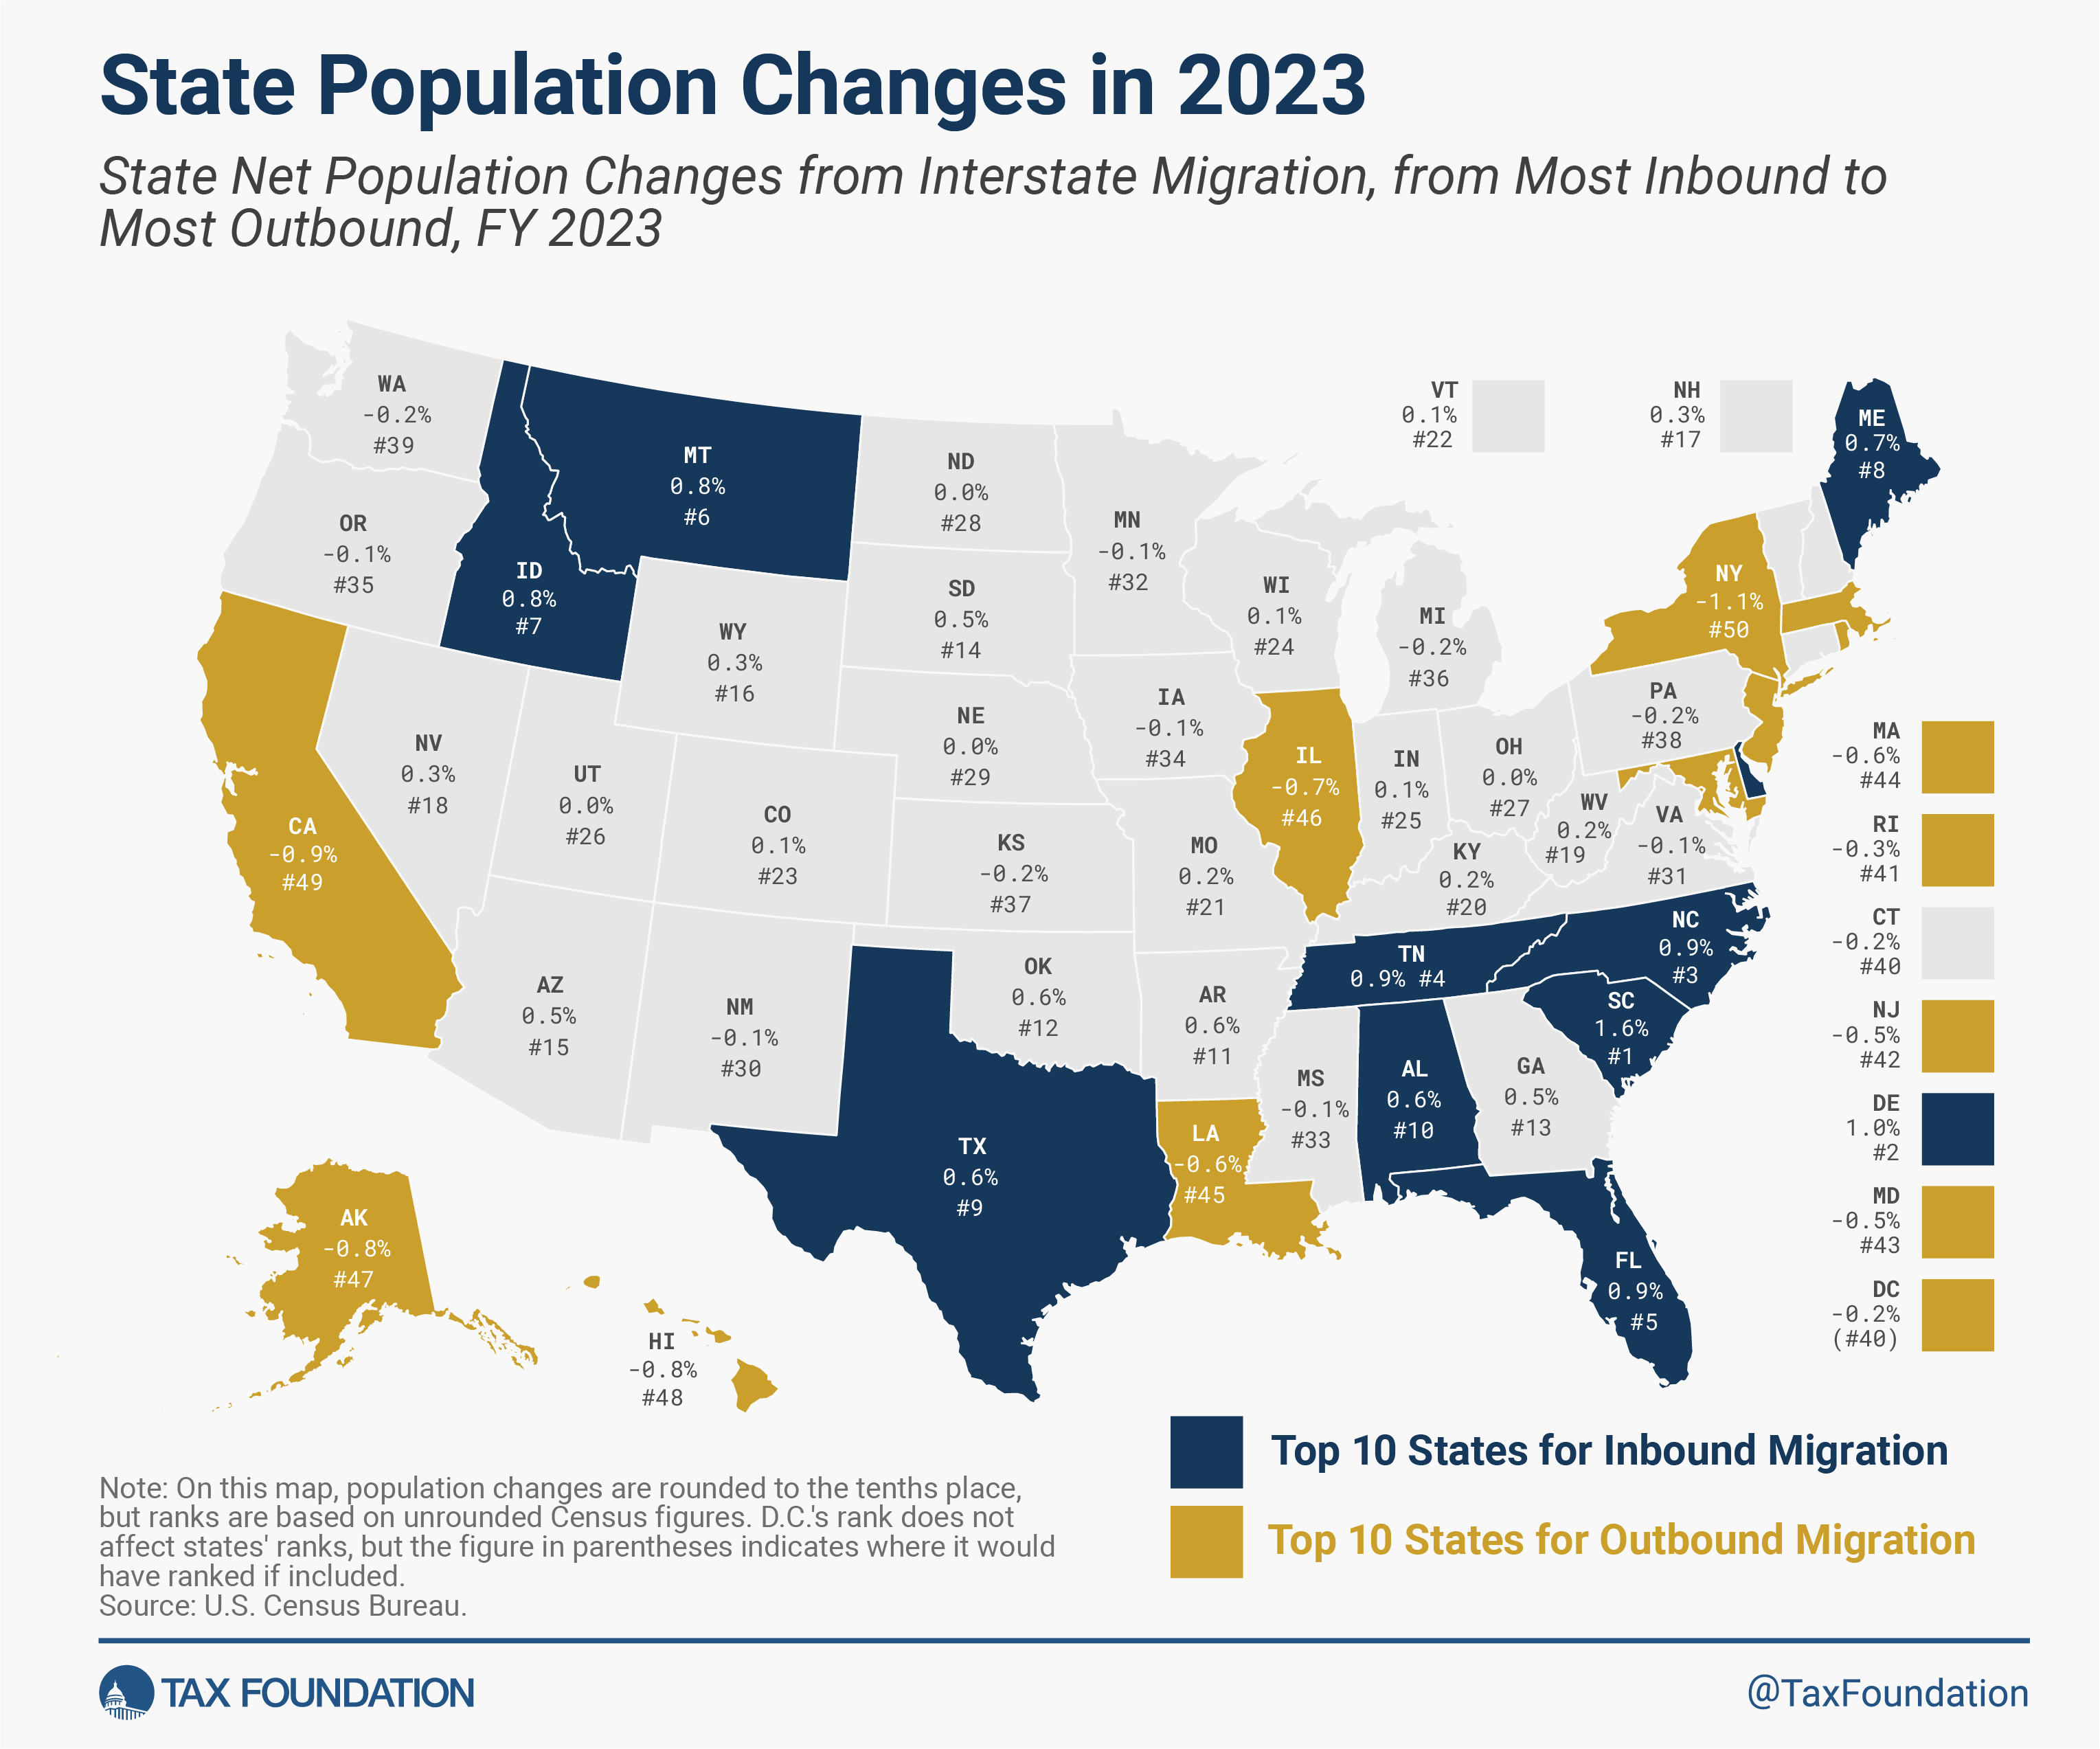
The U.S. population grew 0.49 percent between July 2022 and July 2023, an increase from the previous year’s 0.37 percent. While international migration contributed to population growth at the national level, interstate migration was the key driver of net population changes at the state level. The U.S. Census Bureau’s most recent interstate migration estimates show that New York lost the greatest share of its population (1.1 percent) to other states between July 2022 and July 2023. Not far behind was California, which lost 0.9 percent of its residents, followed by Hawaii (0.8 percent), Alaska (also 0.8 percent), and Illinois (0.7 percent). At the other end of the spectrum, South Carolina saw the greatest population growth from net domestic inbound migration (1.6 percent), followed by Delaware (1.0 percent) and North Carolina, Tennessee, and Florida (all 0.9 percent).
This population shift paints a clear picture: Americans are leaving high-taxA tax is a mandatory payment or charge collected by local, state, and national governments from individuals or businesses to cover the costs of general government services, goods, and activities. , high-cost-of-living states in favor of lower-tax, lower-cost alternatives. Of the 32 states whose overall state and local tax burdens per capita were below the national average in 2022, 24 experienced net inbound migration in FY 2023. Meanwhile, of the 18 states and D.C. with tax burdens per capita at or above the national average, 14 of those jurisdictions experienced net outbound migration.
Though only one component of overall tax burdens, the individual income taxAn individual income tax (or personal income tax) is levied on the wages, salaries, investments, or other forms of income an individual or household earns. The U.S. imposes a progressive income tax where rates increase with income. The Federal Income Tax was established in 1913 with the ratification of the 16th Amendment. Though barely 100 years old, individual income taxes are the largest source of tax revenue in the U.S. is particularly illustrative here. In the top third of states for population growth attributable to domestic migration, the average combined top marginal state income tax rate is about 3.8 percent. In the bottom third (including D.C.), it’s 3.5 percentage points higher, at about 7.3 percent.
Five states in the top third forgo taxes on wage income (Florida, South Dakota, Tennessee, and Texas, as well as Washington, which taxes capital gains income but not wage income). Even the highest top marginal rate in that cohort—Maine’s 7.15 percent—is still lower than the average top rate in the bottom third of states, and lower than many of its Northeastern U.S. peers.
Among the bottom third, five jurisdictions—California, Hawaii, New Jersey, New York, and the District of Columbia—have double-digit income tax rates, and (excepting Alaska, with no income tax), the lowest rate is in Pennsylvania, where a low state rate of 3.07 percent is paired with some of the highest local income tax rates in the country. Six states in the bottom third have local income taxes; only one in the top third does.
Just as states with lower income tax rates—or no income tax at all—have proven highly attractive to interstate movers, so have states with more neutral tax structures. Of the 12 states that levy single-rate, as opposed to graduated-rate, taxes on wage and salary income, all but four (Illinois, Michigan, Mississippi, and Pennsylvania) experienced net inbound migration. It is also worth noting that on the 2023 State Business Tax Climate Index, which evaluated the competitiveness of state tax structures as of July 1, 2022, of the 25 top-ranking states, 20 experienced net inbound migration. Meanwhile, of the 25 lowest-ranking states on the Index, 16 and D.C. experienced net outbound migration.
Data released last week from U-Haul and United Van Lines, while less robust than Census data—and undoubtedly influenced by these companies’ geographic coverage—show similar overall migration patterns. Both companies see states like California, Illinois, Massachusetts, and New Jersey among the biggest losers, and states like South Carolina, North Carolina, Florida, Tennessee, and Texas among the largest net gainers.
Low-Tax States Saw Higher Inbound Migration in 2023
Census Population Data (July 2022 - July 2023) and Industry Moving Data (2023)
| State | Census | U-Haul | UVL |
|---|---|---|---|
| Alabama | 10 | 22 | 8 |
| Alaska | 48 | 34 | n.a. |
| Arizona | 15 | 8 | 18 |
| Arkansas | 11 | 17 | 4 |
| California | 50 | 50 | 44 |
| Colorado | 23 | 9 | 29 |
| Connecticut | 41 | 42 | 36 |
| Delaware | 2 | 15 | 11 |
| District of Columbia | 40 | n.a. | 2 |
| Florida | 5 | 2 | 13 |
| Georgia | 13 | 18 | 19 |
| Hawaii | 49 | 25 | n.a. |
| Idaho | 7 | 6 | 21 |
| Illinois | 47 | 48 | 48 |
| Indiana | 25 | 27 | 15 |
| Iowa | 34 | 24 | 22 |
| Kansas | 37 | 33 | 42 |
| Kentucky | 20 | 29 | 35 |
| Louisiana | 46 | 45 | 41 |
| Maine | 8 | 31 | 26 |
| Maryland | 44 | 44 | 31 |
| Massachusetts | 45 | 49 | 43 |
| Michigan | 36 | 46 | 45 |
| Minnesota | 32 | 20 | 30 |
| Mississippi | 33 | 39 | 32 |
| Missouri | 21 | 28 | 23 |
| Montana | 6 | 21 | 38 |
| Nebraska | 29 | 35 | 37 |
| Nevada | 18 | 11 | 25 |
| New Hampshire | 17 | 40 | 17 |
| New Jersey | 43 | 47 | 49 |
| New Mexico | 30 | 16 | 9 |
| New York | 51 | 43 | 46 |
| North Carolina | 3 | 3 | 6 |
| North Dakota | 28 | 32 | 47 |
| Ohio | 27 | 23 | 28 |
| Oklahoma | 12 | 41 | 34 |
| Oregon | 35 | 37 | 12 |
| Pennsylvania | 38 | 38 | 39 |
| Rhode Island | 42 | 36 | 5 |
| South Carolina | 1 | 4 | 3 |
| South Dakota | 14 | 19 | 7 |
| Tennessee | 4 | 5 | 14 |
| Texas | 9 | 1 | 20 |
| Utah | 26 | 13 | 24 |
| Vermont | 22 | 12 | 1 |
| Virginia | 31 | 10 | 16 |
| Washington | 39 | 7 | 33 |
| West Virginia | 19 | 30 | 10 |
| Wisconsin | 24 | 26 | 27 |
| Wyoming | 16 | 14 | 40 |
These industry studies record total migrations, whereas population data can be put in percentage terms. As such, states like Florida and Texas—which, according to the Census Bureau, had the most population growth in nominal terms—show up prominently in the moving industry data while lower-population states, like Delaware, Montana, and Idaho, are lower on the industry data lists even though they saw population surges.
Another story from the industry data that is less apparent in Census population data is regional competition, even among comparatively high-tax states. Vermont is first in the United Van Lines data but middle-of-the-pack for overall population change because the state benefited from outmigration from densely populated Northeastern cities.
Similarly, U-Haul has relatively few inbound trips to New Hampshire, Oklahoma, and a few other states compared to United Van Lines and, more importantly, to Census data on population growth. Relatively local moves, such as those within the D.C. metropolitan area, can make a jurisdiction like the District of Columbia look like it is doing very well on United Van Lines data even though the Census data shows net outbound, rather than inbound, migration. The industry data has limitations, but it remains informative.
People move for many reasons. Sometimes taxes are expressly part of the calculation, and oftentimes they play an indirect role by contributing to a broadly favorable economic environment. And other times, of course, they don’t factor in at all. The Census data and these industry studies cannot tell us exactly why each person moved, but there is no denying a very strong correlation between low-tax, low-cost states and population growth, as well as a strong correlation between good tax structures and population growth. Given that many states, over the past few years, have responded to robust revenues and heightened state competition by cutting taxes and improving their tax structures—such as by moving from graduated-rate to single-rate income taxes—these trends may only get more pronounced.
The pandemic accelerated changes to the way we live and work, making it far easier for people to move—and they have. As states work to maintain or improve their competitive advantage, they should pay attention to where people are moving, and try to understand why.
Stay informed on the tax policies impacting you.
Subscribe to get insights from our trusted experts delivered straight to your inbox.
Subscribe