Table of Contents
- Executive Summary
- Introduction
- The Current Crisis in Context
- — New York’s Competitive Standing
- — New York’s Recent Reforms
- — New York’s Budget Gap
- — Prospects for Federal Relief
- — The State and Local Tax Deduction (SALT) Cap and New York’s Fiscal Capacity
- — New York’s Convenience Rule and the Future of Remote Work
- Evaluating New York’s Revenue Options
- — Mark-to-Market Taxation of Capital Gains Income
- — Stock Transfer Tax
- — Raising Income Tax Rates
- — Taxing Digital Advertising
- — Taxing Consumer Data
- — Modernizing the Sales Tax
- — Pied-à-Terre Tax
- — Legalizing and Taxing Gaming and Marijuana
- — Revisiting Costly Incentives
- Conclusion
Executive Summary
At first glance, New York faces projected budget shortfalls as arresting as the New York City skyline, and to meet the challenge, some have proposed taxes that would rival that skyline for staggering height. The challenge confronting policymakers is real, though perhaps not as dire as once feared. Its intensity depends on the pace of recovery, the availability of additional federal aid, and the policy choices state officials make in a state that has borne the brunt of the pandemic. State lawmakers will be called upon to navigate between two forbidding shoals, finding a way to meet the state’s revenue needs from a currently diminished tax base without implementing policies that make those economic losses permanent.
It is no easy task, and there are no pat answers. In this publication, we examine the scope of the losses New York confronts and the prospects for—and potential extent of—federal relief in helping alleviate the state’s fiscal crisis. Then, situated in the context of New York’s past efforts to improve its tax competitiveness, and the importance of maintaining the Empire State’s attraction in an increasingly mobile economy, we review many of the proposals for raising additional revenue. Some hold promise, others present economic perils, and a few are legal quagmires.
Recent data from the New York Department of Taxation and Finance suggest four-year tax revenue losses of $20.9 billion in real terms, about a 6.7 percent inflation-adjusted decline across the period, and a challenge above what the figures would indicate for a state that was struggling to balance its budgets even before the COVID-19 pandemic. If federal aid were provided on par with what U.S. House Democrats proposed in May, a state share currently estimated at just under $26.9 billion would cover the gap and then some, while an additional $22.8 billion would benefit New York City and other struggling municipalities, making it easier for them to absorb not only their own revenue losses but also a reduction in state aid.
But these levels are by no means guaranteed, nor are tax revenues the only sources of revenue loss for New York. Further savings, in the form of both budget cuts and revenue increases, may be on the table, particularly if aid to either state or local governments falls well short of earlier proposals, as is quite plausible.
State officials, including Gov. Andrew Cuomo (D), have worried that raising the state’s already-high taxes could jeopardize long-term economic prospects, as New York loses out to more competitive tax environments. New York already imposes the nation’s second-highest tax burdens on individuals and fourth-highest burdens on businesses, leaving policymakers with little room to maneuver. The governor has expressed heightened concern in light of the capped state and local tax (SALT) deduction, though, as we discuss in this publication, the broader effects of the Tax Cuts and Jobs Act (TCJA) meant that the adverse effects on New York’s fiscal capacity were overstated. Furthermore, President-elect Joe Biden’s tax proposal, even if coupled with the repeal of the SALT deduction cap, would not enhance the state’s fiscal capacity.
The SALT deduction notwithstanding, there are in fact legitimate reasons to be worried about tax-influenced outmigration, especially after the pandemic’s forced experiment with remote work ushers in a more flexible, and geographically mobile, way of living and working. For high-net-worth individuals in particular, it has never been easier to move—and to avoid higher taxes, some already have, and more will.
Some revenue options, like broadening the sales tax base or briefly pausing currently scheduled income tax rate reductions, could bridge a revenue gap with limited harm to the state’s economic competitiveness. Similarly, legalization of gaming or marijuana, both of which have been advocated in some quarters, could create new revenue streams, though a legal marijuana market, in particular, would take some time to develop and would not yield significant new revenue immediately. Business incentives which fail to deliver on their promises should also come under greater scrutiny in light of budget shortfalls; a planned reduction in the state’s Excelsior Jobs Program Tax Credits could be accelerated, and costly film tax credits which cost $420 million a year while failing to deliver for the state economically should be on the chopping block.
Other proposals under consideration, like a higher millionaire’s tax that could bring the top state and local combined rate in New York City to nearly 15.7 percent, could accelerate an outmigration that has already cost the state nearly a million residents and about $51 billion in annual adjusted gross incomeFor individuals, gross income is the total of all income received from any source before taxes or deductions. It includes wages, salaries, tips, interest, dividends, capital gains, rental income, alimony, pensions, and other forms of income. For businesses, gross income (or gross profit) is the sum of total receipts or sales minus the cost of goods sold (COGS)—the direct costs of producing goods between 2010 and 2017 (most recent data). Evidence also suggests that authorizing New York City to impose a so-called pied-à-terre tax on second residences within the city, while superficially appealing as a way to export taxes to wealthy nonresidents, could backfire by driving out a subset of taxpayers who impose few costs on the city while contributing substantially to its tax base.
Then there are proposals that simply may not work at all. A mark-to-market proposal designed to accelerate the collection of capital gains tax may be virtually unworkable, because it would require regular valuations of unpriced business interests and could require the liquidation of business assets to pay taxes on unrealized gains. A stock transfer tax could easily raise nothing at all, while depressing other sources of tax collections, by causing New York-based exchanges to relocate—a seismic shift that is nonetheless quite feasible in today’s highly interconnected economy, and which would be devastating for New York. The major exchanges have already indicated that they would relocate their servers to avoid a proposed New Jersey tax on processing the transactions; a relocation of the exchanges themselves, and the jobs that go with them, is a greater undertaking, but an increasingly viable one. And taxes on data and digital advertising, in addition to their many implementation challenges, run headlong into constitutional constraints.
Policymakers must manage a balancing act, meeting the state’s budgetary needs without getting in the way of economic recovery. Taxpayers, especially the high earners who are responsible for the lion’s share of state tax collections, are less geographically tethered than ever before; lawmakers must contend with higher mobility for businesses and individuals alike. But there’s still something special about New York, and always will be—something that will bring people back, if policymakers will allow it. The decisions made in Albany will influence what New York’s recovery looks like. This publication seeks to inform the important deliberations ahead by examining the magnitude of the revenue crisis and outlining the trade-offs policymakers must take into account as they craft their solutions.
Introduction
New York is a state of superlatives. It is the Empire State—even if no one is quite sure why. Certainly, however, no observer can deny New York’s claims to greatness. It is a state characterized by high energy, high hopes, high skylines, high culture, high frequency trading, and, yes, high taxes. It is, moreover, the kind of state that can get away with—justify, even—higher than average tax burdens. Whatever else they may be, taxes are part of the cost of living, and New York is undeniably a place that commands a premium.
New Yorkers have been willing to put up with higher-than-average tax burdens. They may grumble about them, but there is a degree to which they are an accepted cost of living in a desirable location with a large, active government sector. That does not, however, mean that the state faces no fiscal constraints. And as many in upstate New York have increasingly realized, a tax code that is manageable for wealthy New York City residents and businesses can prove incredibly burdensome elsewhere.
Some tax proposals, of course, might be unmanageable from almost any point of view. One advocacy effort suggests raising an additional $35 billion a year from the wealthiest New Yorkers, including $5.5 billion a year from a tax that targets about 120 people: an average of $46 million per taxpayer a year on a very small set of highly mobile individuals whose current presence in the state contributes immensely to existing revenues.[1] It is not so much a question of whether New York’s billionaires have the ability to pay—it is that many of them would have the ability not to, and would deprive the state of other much-needed revenue with their departure.
As a high-tax state, New York’s fiscal capacity is more constrained than some of its peers; remaining revenue options are more disruptive than the ones available to states which had exhausted or maxed out fewer revenue streams entering the COVID-19 pandemic. Taxes targeting the financial sector, which is at the heart of the state’s economy, could prove particularly damaging—catastrophic, even, if some of the more aggressive proposals led to an exodus of traders and exchanges. The financial sector is to New York what the technology sector is to California or agriculture to Nebraska. At the same time, however, the state’s budget gap is very real, and—absent generous federal assistance, which many policymakers continue to count on—exceeds the state’s realistic capacity to close through cuts alone.
This publication examines New York’s budget outlook and the tax competition the state faces. It explores New York’s revenue options—none of them good, but some better than others—as policymakers search for answers to the state’s budget crisis. Some proposals may have merit, if approached carefully:
- Modernizing the sales tax base could stabilize collections and generate additional revenue, particularly from higher-net-worth New Yorkers who are more likely to consume currently untaxed personal services;
- A temporary pause in scheduled income tax rate reductions can help offset immediate revenue losses while still assuring taxpayers of a downward, not upward, rate trajectory;
- The legalization and taxation of new markets in gaming and marijuana can be a welcome, if modest, source of additional tax revenue; and
- A reappraisal of the state’s corporate tax incentives can yield savings by reducing or eliminating underperforming credits.
Other proposals would prove considerably more harmful:
- Mark-to-market taxation would be virtually impossible to implement at the state level, and, if enacted, would break up many businesses whose owners have insufficient liquidity to pay taxes on the unrealized appreciation of their business interests;
- A stock transfer tax in such an interconnected, digitally-focused era could easily displace the major stock exchanges, and much of the state’s vital financial services sector with them;
- A higher “millionaire’s tax,” after failing to allow the current one to expire as planned, would undermine the state’s tax competitiveness and accelerate outmigration in an increasingly mobile economy;
- Taxation of digital advertising or consumer data is fraught with legal and practical pitfalls, and much of the burden would be borne by in-state businesses; and
- Authorization of a city pied-à-terre, which has been proposed as both a revenue-raiser and a disincentive for nonresidents to maintain a place in New York City, would see these goals in tension, as fewer high-net-worth individuals spend time in—and pay taxes—to the city and state.
This publication also argues that lawmakers should preserve the progress the state has made in recent years, not using the current crisis as an impetus for dramatic long-term tax experiments. Public officials from Gov. Andrew Cuomo on down have identified the economic perils of overreach, and that has never been truer than it is now.
New York is still a special place, and rumors of New York City’s demise are greatly exaggerated. Great cities are resilient; they bend, but do not break. The cavernous feel of the city’s great thoroughfares is temporary: people will return.
But not all of them.
Even before a global pandemic which ravaged New York and prompted an urban exodus, New York was losing more people (and income) to migration than it gained each year. Technology that brings us closer together was already eroding the need for physical proximity. Now, the telework experience is upending our conception of the workplace, or at least rapidly accelerating an existing trend. Most office workers will return, in time, but not all. Most businesses will retain their prior office locations, but not all. And in that “not all” there is a credible threat to New York’s finances. We have never had this much mobility before, and the advantages of being at the center of it all have never been weaker. Those eulogizing America’s great cities have arrived far too soon, but those unwilling to acknowledge symptoms and summon a doctor are far too sanguine.
The Current Crisis in Context
New York’s Competitive Standing
New York’s motto, “Excelsior,” means “higher,” but is commonly expressed as “ever upward.” In the Longfellow poem of that name, an intrepid young explorer braves a forbidding climate to complete his quest, but does not make it: he is found, having succumbed to unfavorable conditions, “still grasping in his hand of ice that banner with the strange device, Excelsior!”[2] The fate of New York businesses is not, perhaps, so dramatic, but the tension is there: New York is a state of ingenuity and innovation, but with a business climate that can be cold to the risk-takers that have so long defined the state.
New York ranks 48th in the 2021 edition of the Tax Foundation’s State Business Tax Climate Index, which measures tax structure, not rates or collections. On structure, the state does reasonably well on corporate taxes after the reforms of the past decade, but poorly on all other categories. At the same time, New York ranks 27th in CNBC’s most recent Top States for Business ranking, buoyed by high scores on access to capital (2nd), technology and innovation (4th), education (7th), and quality of life (13th) but dragged down by a high cost of doing business (42nd), a high cost of living (48th), and a lack of business friendliness (49th).[3] This encapsulates the tension of New York for businesses and individuals alike: the state has so much to offer, but sometimes the price of entry can be prohibitive.
| Component | Rank |
|---|---|
| Overall Rank | 48 |
| Corporate Taxes | 15 |
| Individual Taxes | 48 |
| Sales and Excise Taxes | 43 |
| Property and Wealth Taxes | 45 |
| Unemployment Insurance Taxes | 38 |
| Source: Tax Foundation. | |
Measured in nonbusiness taxes as a percentage of personal income, New York has the nation’s second-highest tax burden on individuals (an 8.1 percent effective rate), trailing only Hawaii (8.4 percent). The national average is 5.7 percent, making personal tax burdens more than 40 percent higher in New York than they are nationally. Propelled by top city and state combined income tax rates as high as 12.696 percent, along with above-average property and other tax burdens, these individual burdens are much higher than in other high-tax states in the region and are uncompetitive with most of New York’s peers nationwide.
| Nonbusiness State and Local Tax Burdens as a Percentage of State Personal Income, 2019 | |
|---|---|
| State | Personal Taxes as a % of Personal Income |
| New York | 8.1% |
| U.S. Average | 5.7% |
| Neighboring States | |
| Connecticut | 7.5% |
| Massachusetts | 6.5% |
| New Jersey | 6.6% |
| Pennsylvania | 5.8% |
| Rhode Island | 6.9% |
| Vermont | 5.8% |
| Select National Competitors | |
| California | 6.7% |
| Florida | 3.5% |
| Illinois | 6.2% |
| North Carolina | 5.6% |
| Texas | 3.7% |
| United States | 5.7% |
| Virginia | 5.4% |
| Washington | 4.9% |
| Sources: Council on State Taxation; U.S. Bureau of Economic Analysis; Tax Foundation calculations. | |
Businesses fare no better. They face the fourth-highest business taxes per employee in the country at $10,400 per employee, according to the Council on State Taxation, the cumulative effect of a panoply of state and local taxes on corporate income (imposed, unusually, by New York City in addition to the more traditional state-level tax), property, commercial rent, property transfers, business-to-business sales, and more. The only states with higher business taxes per employee—North Dakota, Wyoming, and Alaska, in that order—generate much of their tax revenue from capital-intensive oil and natural gas operations. Of states with broader economies, New York is without peer, in a bad way. Nationally, business taxes run about $6,500 per employee, putting New York’s taxes at a 60 percent premium.
| Business Tax Burdens Per Employee, 2019 | |
|---|---|
| State | Business Taxes Per Employee |
| New York | $10,400 |
| U.S. Average | $6,500 |
| Neighboring States | |
| Connecticut | $6,300 |
| Massachusetts | $5,900 |
| New Jersey | $8,800 |
| Pennsylvania | $6,200 |
| Rhode Island | $5,900 |
| Vermont | $8,400 |
| Select National Competitors | |
| California | $7,700 |
| Florida | $5,700 |
| Illinois | $6,800 |
| North Carolina | $4,300 |
| Texas | $7,700 |
| Virginia | $5,900 |
| Washington | $8,000 |
| Source: Council on State Taxation. | |
Some of the differences, for both individuals and businesses, can be explained by differences in these states’ respective economies, but such analysis only goes so far. New York’s concentration of high earners generates more revenue than the same rate structure would in a less affluent state, but this capacity does not go very far in explaining why New York requires such levels. A strong corporate presence in New York City provides the state with a large corporate tax base that other states may lack, but here too, this better explains the how than the why—and that “how” is dependent on New York’s ability to retain its businesses and high earners. Here, there is cause for concern.
Between 2010 and 2017 (most recent data), New York lost a net 963,182 residents to outmigration and, in aggregate, about $51 billion in annual adjusted gross income in current dollars, reflecting a state gross income loss of 5.4 percent.[4] About one-fifth of those leaving the state decamped to Florida, where they are shielded from both harsh winters and an individual income taxAn individual income tax (or personal income tax) is levied on the wages, salaries, investments, or other forms of income an individual or household earns. The U.S. imposes a progressive income tax where rates increase with income. The Federal Income Tax was established in 1913 with the ratification of the 16th Amendment. Though barely 100 years old, individual income taxes are the largest source.[5]
Separately, the New York City Comptroller reports that the City’s population declined for the third consecutive year in 2019, losing 1.6 percent of its population over a three-year stretch in which the national population increased by 1.6 percent.[6] The COVID-19 pandemic, meanwhile, has likely both accelerated existing long-term outmigration trends and created some share of residents whose temporary relocations will become permanent, especially as remote work becomes more feasible.
In January, New York’s unemployment rate was 3.8 percent, only modestly higher than the national average of 3.6 percent. In September, the state’s rate stood at 9.7 percent, substantially higher than the national rate of 7.9 percent. (By October, the national rate had declined further, to 6.9 percent, but new state-level figures have not been released as of the date of this publication’s release.)[7] New York is strong, but New York is not invincible. The trends were already cutting against the state, and the pandemic and its aftermath will make them worse.
Taxes are only one of many considerations for businesses and individuals when they decide where to locate (or relocate). New York’s taxes are quite high, however, and contribute to the high cost of living and high cost of doing business. The financial sector, in particular, is essential to New York, generating almost 30 percent of gross state product, and higher taxes—particularly ones targeted at financial activity—could shift many of those jobs out of state, and tax dollars with them. As we enter into an era of greater mobility and flexibility, policymakers cannot afford to ignore the risks of an uncompetitive tax code, particularly one that so heavily targets a single industry.
New York’s Recent Reforms
Gov. Andrew Cuomo has left his mark on the tax code, convening two state tax relief commissions and implementing several of their recommendations earlier in his administration.[8] New York remains a high-tax state, but these reforms have improved the state’s competitiveness at a time when peer states like Massachusetts were also shedding their reputations for exorbitant taxation, and as taxpayer mobility increased.
Gov. Cuomo has overseen the reduction of the corporate income taxA corporate income tax (CIT) is levied by federal and state governments on business profits. Many companies are not subject to the CIT because they are taxed as pass-through businesses, with income reportable under the individual income tax. rate from 7.1 to 6.5 percent, its lowest rate since 1968. The corporate tax code was also improved through the elimination of the corporate alternative minimum tax, one of four tax bases under which the tax was then calculated, while beginning a phaseout of another base, measured by capital stock. That tax base is scheduled for repeal in 2021, the culmination of a six-year phasedown. The state also dramatically improved its treatment of corporations’ net operating losses, bringing its code in line with those of other states.[9]
The state improved 15 places on the corporate tax component of the Tax Foundation’s State Business Tax Climate Index, which measures tax structure, during the first four years of corporate tax reform,[10] though some of those gains have been lost in relative terms as other states have made more recent reforms.
Many individuals, meanwhile, have benefited from individual income tax rate cuts for the middle brackets, which will ultimately reduce the marginal rate on income below $80,650 ($161,550 for married filers) to 5.5 percent.[11] The state also adopted inflation indexingInflation indexing refers to automatic cost-of-living adjustments built into tax provisions to keep pace with inflation. Absent these adjustments, income taxes are subject to “bracket creep” and stealth increases on taxpayers, while excise taxes are vulnerable to erosion as taxes expressed in nominal dollars, rather than rates, slowly lose value. in 2011, ensuring that taxpayers do not see their effective rates increase due to bracket creepBracket creep occurs when inflation, or real income growth, pushes taxpayers into higher income tax brackets. Bracket creep results in an increase in income taxes without an increase in real income. Many tax provisions—both at the federal and state levels—are adjusted for inflation. Over time, bracket creep can increase how much income tax people owe as their income grows, either due to inflat. A property taxA property tax is primarily levied on immovable property like land and buildings, as well as on tangible personal property that is movable, like vehicles and equipment. Property taxes are the single largest source of state and local revenue in the U.S. and help fund schools, roads, police, and other services. limitation regime, meanwhile, has kept the growth of local tax revenues in check,[12] and the state raised its formerly low estate taxAn estate tax is imposed on the net value of an individual’s taxable estate, after any exclusions or credits, at the time of death. The tax is paid by the estate itself before assets are distributed to heirs. thresholds.[13] At the same time, however, lawmakers chose to make the 8.82 percent top marginal rate permanent; it was originally scheduled to expire after 2017.[14]
The state’s higher top marginal rate notwithstanding—and it is a major caveat in an era of increased mobility—New York has, under Gov. Cuomo, recognized the role of tax competition and the risks associated with taxes that drive out the state’s top earners, who are also, of course, the drivers of state revenue. In 2016, tax filers earning less than $50,000 a year were responsible for less than 3 percent of income tax receipts, while filers earning more than $200,000 generated 63 percent of all income tax collections.[15]
| Individual Income Tax Liability by Income Class, Tax Year 2016 | ||
|---|---|---|
| Income Class | % of Filers | % of Liability |
| $0 – $49,999 | 64.1% | 2.8% |
| $50,000 – $99,999 | 19.7% | 14.8% |
| $100,000 – $199,999 | 11.1% | 20.0% |
| $200,000 + | 5.2% | 62.8% |
| Source: New York State Comptroller, “Comprehensive Annual Financial Report for Fiscal Year Ended March 31, 2019.” | ||
Although more recent data are not yet available, the gap will only have widened since then, as the “millionaire’s tax” rate has remained in place while other rates have been reduced. Many other state taxes are also disproportionately—or in the case of the estate tax, entirely—remitted by the highest-income New Yorkers. The temptation to generate additional revenues from the state’s wealthiest residents, particularly given the current downturn, must be tempered by a sober acknowledgment of how much state coffers stand to lose if too many of those wealthy taxpayers left.
New York Budget Gap
New York’s tax collections, though down from last year, do not look especially dire at first glance. The vacant office buildings of Manhattan tell a different story, one that is keeping state officials up at night. As of September 18th, only 10 percent of Manhattan office workers had returned, compared to 25 percent of office workers nationwide and even higher proportions in other large metropolitan areas, like Dallas (40 percent) and Los Angeles (32 percent), according to the commercial real estate services firm CBRE.[16] The Partnership for New York City published similar numbers in its late October survey, and reported that responding businesses expect only 48 percent of their employees to return by July 2021.[17] The result is devastating for businesses serving downtown employees (to say nothing of tourists), as well as to city revenues. They are also worrying to state officials who wonder, with reason, whether some of these workers—and their tax dollars—are gone for good.
Between January and September of 2020, New York collected 2.5 percent less in taxes and fees than it did in the same nine months in 2019.[18] Tax revenues plummeted in April, when they fell nearly 69 percent, the combination of a decline in taxable activity (e.g., sales, tourism, withholdingWithholding is the income an employer takes out of an employee’s paycheck and remits to the federal, state, and/or local government. It is calculated based on the amount of income earned, the taxpayer’s filing status, the number of allowances claimed, and any additional amount the employee requests., nonresident income, and business profits) and the decision to delay the income tax filing deadline to July. A 137 percent spike in July collections made up for the latter, as taxes owed on 2019 income belatedly flowed to the state. By September, with delayed collections in the rearview mirror, monthly receipts were 4.4 percent higher than they were in the prior year.[19]
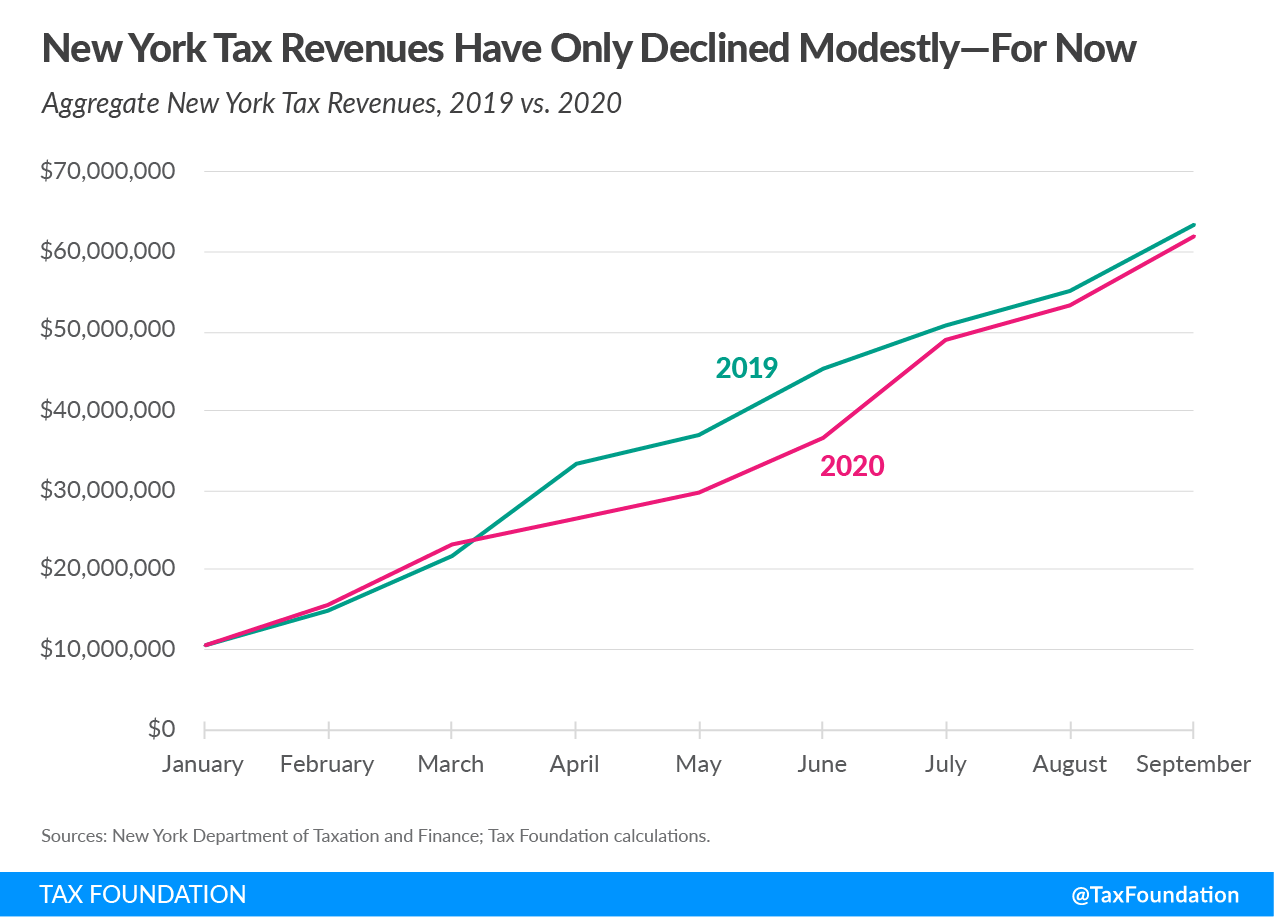
These revenue trends are not enough, on their own, to predict the crisis that state officials envision. To be sure, revenue collections will get worse before they get better: in New York as in the rest of the country, the full damage to income tax collections will not be realized until next April, the filing deadline for 2020 tax returns. And unlike in much of the country, where sales and excise taxAn excise tax is a tax imposed on a specific good or activity. Excise taxes are commonly levied on cigarettes, alcoholic beverages, soda, gasoline, insurance premiums, amusement activities, and betting, and typically make up a relatively small and volatile portion of state and local and, to a lesser extent, federal tax collections. receipts have recovered to pre-recession levels, New York’s heavy reliance on still-absent tourists, office workers, and other nonresidents has made a serious dent. Still, income tax withholding is fairly stable, which provides reason for optimism.
Yet, where many other states anticipate manageable losses, New York predicts crisis: in August 2020, the Division of the Budget anticipated total losses of $62.09 billion between Fiscal Years 2021 and 2024.[20] After accounting for enhanced federal matching assistance for Medicaid, the allocation of some spending to moneys received from the federal Coronavirus Relief Fund, and other savings and offsets, most notably a dramatic curtailment in local aid payments, the budget division expects the four-year gap to be a still daunting $27.4 billion.[21] At the same time, moreover, the reductions in local aid will intensify the fiscal crisis for municipalities.
New York, which had to close a $6.1 billion budget gap for FY 2021 before anyone had even heard of the novel coronavirus,[22] has been banking on revenue growth to help patch over its structural challenges and ever-growing budget. Before Gov. Cuomo offered a budget plan rolling back much of the planned growth of government this fiscal year, the FY 2021 budget was poised to be 7 percent larger than the prior year’s, with 9.4 percent growth in the general fund. This was entirely unsustainable even before the pandemic, and still worse, its baseline was an anomalously good year for revenue collections.
Tax receipts grew 9.7 percent in FY 2020, a dramatic leap from prior years. The individual income tax, for instance, generated $53.7 billion in FY 2020, compared to $48.1 billion the previous year. Adjusting for inflation, collections consistently hovered around $50 billion a year previously with no significant growth, before soaring to $53.7 billion in FY 2020, an increase that was likely the result of income-shifting in response to the Tax Cuts and Jobs Act (TCJA) and not reflective of actual economic growth. Because New York’s fiscal years end in March, the most important revenue month for FY 2020 was April 2019, when final taxes on 2018 income were collected—a lengthy lookback which means that FY 2020 collections were substantially influenced by taxpayers who deferred earnings from tax years 2017 to 2018 to take advantage of the TCJA’s lower rates. This increase, therefore, is not real or sustainable; the FY 2019 figures were too low, and the FY 2020 figures too high, relative to the state of the actual economy.
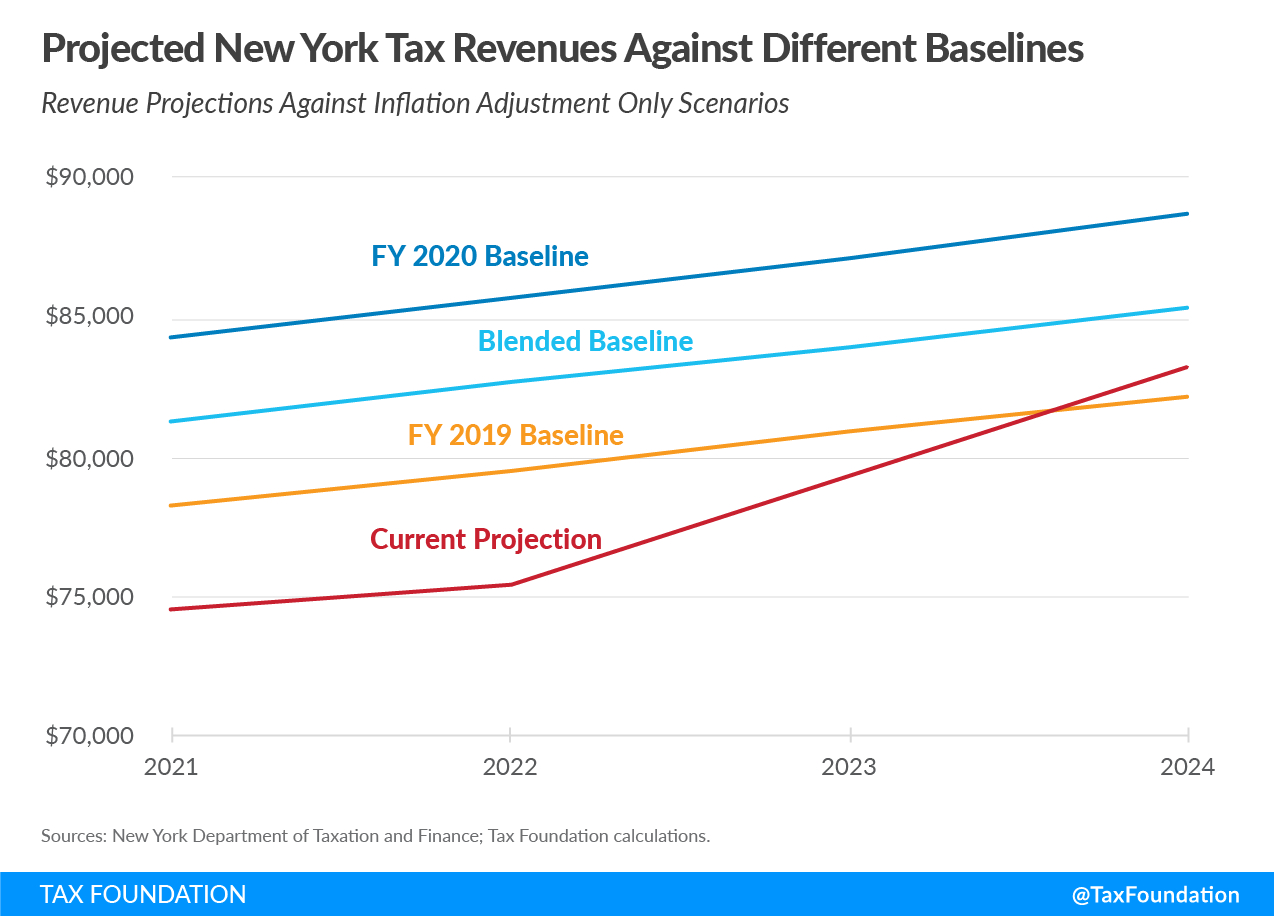
The dramatic projected decline in tax revenues looks, in part, like a reversion to the mean. In nominal terms, total tax revenues were $75.6 billion in FY 2019 and are projected to be $74.5 billion and $75.3 billion in FYs 2021 and 2022 respectively, a decline that looks less steep if the $82.9 billion figure from FY 2020 is not regarded as the new normal, which was already highly unrealistic. A blended baseline may be the most responsible approach, and suggests a four-year tax revenue loss of $20.9 billion compared to a scenario at which revenues had continued to grow at the rate of inflation, representing about a 6.7 percent inflation-adjusted decline across the period.[23]
Figure 2 shows projected revenues against each of these baselines, showing how projected revenues compare to three scenarios. Under the first, FY 2019 collections continue, rising only at the rate of inflation. Because of income shifting into FY 2020, this likely represents too low a baseline. The third, the FY 2020 baseline, benefits from that income shifting, and is therefore likely too high. The blended baseline averages the two years and inflation adjusts from that starting point.
Contributing to revenue estimators’ fears is the dreadful uncertainty of how, and where, people will work when the pandemic subsides. The novelist John Updike defined a true New Yorker as someone who secretly believes that people living anywhere else have to be, in some sense, kidding[24]—but right now, a fair percentage of New Yorkers themselves are living somewhere else, and they may not be kidding.
Many will return; offices will not be vacant forever. But a virus has upended the ways we live and work, and some of these changes will endure, with the pandemic accelerating nascent trends, like greater acceptance of telework and flexible working arrangements. “People are mobile. They will go to a better tax environment. That is not a hypothesis. That is a fact.”[25] These were Gov. Cuomo’s words in 2019, long before the country’s forced experiment in large-scale remote work. They look especially prescient, and worrisome, now.
A growing number of jobs can be performed from anywhere, and even for those that do remain office-bound, the benefits of being located in one of the country’s most expensive metropolitan areas may not be as strong as they once were. New York needs to prepare for this possibility and must take care not to rush headlong into tax plans that might accelerate these trends.
Prospects for Federal Relief
One likely bulwark against both spending reductions and tax increases is a new round of federal assistance. Anticipating the size, scope, and timing of any future federal aid to states is an uncertain proposition at best, particularly with the continuation of divided government with the election of Joe Biden as President but, pending the outcome of runoff elections, the retention of a Republican Senate disinclined to approve an additional relief package on the scale of the one favored by congressional Democrats. Some additional federal aid, however, appears likely, and may prove extremely helpful as the state weathers the current crisis. It is important to recognize, however, that any federal relief is definitionally temporary, and cannot be relied upon to address broader structural issues. New York’s expenditure trajectory vastly exceeded its anticipated growth in tax collections long before the COVID-19 pandemic, and, unless adjustments are made, will continue to do so long after any federal aid has run out.
Arguably one reason for the generosity of the Health and Economic Recovery Omnibus Emergency Solutions (HEROES) Act introduced by House Democrats in the spring of 2020, which would have extended state and local aid substantially in excess of the multiyear losses of these governments, is that creating a formula that could make a serious dent in the budget holes faced by a state like New York, which was hit particularly hard and faced pre-pandemic fiscal challenges, meant appropriating a total amount that looks vastly inflated compared to the needs of most other states.
The HEROES Act would have provided $540 billion in flexible aid to state governments and another $375 billion to local governments, in addition to about $81 billion in further enhanced Medicaid funding that would free up an equivalent amount in states’ budgets. This yields a total of at least $996 billion in flexible aid, plus $100 billion more for expenses arising from the COVID-19 pandemic.[26] About 54 percent of the flexible state aid calculation was based on population, while 37 percent is pegged to the state’s share of overall unemployment, and the remainder is tied to coronavirus cases, both (in the original bill) as of the spring of 2021.
When the bill was introduced in May, New York’s shares of both COVID-19 cases and total unemployment were much larger, and had the snapshot date for the formula been at that time, the Empire State would have been in line for $42.5 billion in aid. But the snapshot date was always for early 2021, and as time has passed and the virus’s damage is more keenly felt elsewhere (even if New York still bears disproportionate costs), the proportions—and pro rata shares—have changed. Using the latest data, New York’s share would be just under $26.9 billion. Another $22.8 billion would be available to New York municipalities, much of it flowing to New York City, and this calculation is not dependent upon economic or health data.
State and local aid under the HEROES Act was extremely generous. Not only was the bill introduced before officials had the advantage of second- and third-quarter economic and revenue data, but it was also drafted as a starting point in negotiations which quickly faltered. With aggregate state FY 2020 revenues only slightly down, little evidence of most states’ worst fears being realized,[27] and a significant decline in unemployment (to 6.9 percent in October,[28] compared with earlier projections that year-end unemployment would be around 10 percent), it is reasonable to expect that state relief would be smaller than what was embodied in the HEROES Act—even before divided government is taken into account. It is possible, however, that any future relief package may be more narrowly targeted, focusing more on economic indicators (like unemployment levels), which would favor New York in relative terms.
Even with generous federal assistance, however, New York may still be required to make its own further adjustments in the short term, and has no choice but to do so in the long term. The default governmental growth trajectory is unsustainable at present. Cuts not only in the rate of growth, but actual reductions in outlays, are necessary under the circumstances. Additional revenues, however, are also sure to be on the table, and are already the subject of strenuous debate. Be they income tax increases, a stock transfer tax, mark-to-market treatment of capital gains, digital services taxes, sales tax base broadening, marijuana and gaming legalization and taxation, or any of a host of other proposals, policymakers will have much to consider.
This publication explores those options, examining revenue projections, economic considerations, and, where applicable, legal constraints. It highlights several potentially viable options for additional revenue, while sounding notes of caution about others which would put the state at a greater competitive disadvantage. Before doing so, however, it makes a detour to consider the effect of the state and local tax (SALT) deductionThe state and local tax (SALT) deduction permits taxpayers who itemize when filing federal taxes to deduct certain taxes paid to state and local governments. The Tax Cuts and Jobs Act (TCJA) capped it at $10,000 per year, consisting of property taxes plus state income or sales taxes, but not both. on New York’s fiscal capacity and risks surrounding New York’s so-called “convenience of the employer” income tax sourcing rule.
The State and Local Tax Deduction (SALT) Cap and New York’s Fiscal Capacity
Gov. Cuomo and several other Northeastern governors have identified the $10,000 cap on the state and local tax (SALT) deduction, a feature of the Tax Cuts and Jobs Act (TCJA) of 2017, as an impediment to their ability to raise revenue. In the process, the governor has articulated a particularly aggressive theory of tax flight, positing that this limitation on the tax code’s prior subsidy for high earners in high-tax states makes New York’s high taxes less attractive, exposing the state to more competition from lower-tax peers and thereby risking significant tax migration.
At a theoretical level, the governor is correct. “Tax the rich, tax the rich, tax the rich and now what do you? The rich leave,”[29] he declared, and this is correct—at some level. Without the cap, New York is, in his estimation, at a “long-term competitive disadvantage.”[30]
The federal tax code’s constraints on state fiscal capacity can be understood in both absolute and relative terms. An absolute constraint is imposed when federal taxes reduce income or investment in a way that reduces the state’s taxable base, or when they are high enough that taxpayers’ willingness to accept state levies is reduced. In an extreme case, the top federal income tax rate reached 92 percent in 1952, even though very few Americans had any income exposed to that rate.[31] Were this still in force today, New York’s current top marginal rate of 8.82 percent would yield a combined marginal rate in excess of 100 percent for some taxpayers in the absence of a deduction. But even in considerably less extreme cases, an increase in federal tax liability may diminish taxpayers’ appetite for state taxes.
A relative constraint, by contrast, is one that does not reduce a state resident’s ability to pay, but instead accentuates the competitive differences across different state tax regimes. The TCJA imposed a relative, not absolute, constraint on New York’s revenue options, because on net it represented a reduction in New Yorkers’ federal tax burdens—increasing ability to pay—but the tax savings were less pronounced in New York than they were in states with lower tax burdens.
Most taxpayers experienced tax savings in every state, including in New York, where federal income taxes paid by residents decreased by almost $3.4 billion in 2018, the first year the TCJA was in effect.[32] But while New Yorkers experienced tax savings, the benefit they could gain from relocating to a lower-tax jurisdiction also increased.[33] The SALT cap subsidy served to smooth out some of the differences in state tax liability for high earners; with the cap, the distinctions between state tax systems matter more.
Importantly, the reduction in federal taxes under the TCJA lowers the value of the SALT deduction. Because the TCJA lowered individual rates, the benefit of the SALT deduction would have been less even if uncapped. The legislation also repealed a provision called the Pease Limitation, which added a surcharge for some taxpayers, and reformed the alternative minimum tax (AMT), both of which reduced liability, with AMT reform making the SALT deduction available to some taxpayers for whom it was previously denied altogether.
President-elect Biden has unveiled a tax plan which, in addition to raising the top marginal rate from 37 percent to 39.6 percent, would restore the Pease Limitation and create a so-called “donut hole” where the Social Security payroll taxA payroll tax is a tax paid on the wages and salaries of employees to finance social insurance programs like Social Security, Medicare, and unemployment insurance. Payroll taxes are social insurance taxes that comprise 24.8 percent of combined federal, state, and local government revenue, the second largest source of that combined tax revenue., which currently only applies to the first $137,700 of wage income, applies to all further marginal income above $400,000 as well.[34] His campaign has also signaled willingness to consider lifting the SALT cap, instead subjecting the deduction to a 28 percent overall cap, though this is not part of his official plan and would necessitate further adjustments to generate the same amount of revenue.
As Table 5 illustrates, the highest marginal rate New Yorkers currently face on combined federal and state income taxes is 48.17 percent, which is actually 0.2 percentage points lower than their pre-TCJA rate and 9.98 percentage points less than what they would pay under the Biden plan (7.52 percent if the SALT deduction were restored).[35] In this respect, the TCJA actually increased New Yorkers’ capacity to pay state taxes, since the reduced SALT deduction was more than offset by the rate cut and elimination of the Pease limitation. Those also subject to New York City taxes, however, face about a 1.31 percentage-point higher top marginal rate under current law than they did pre-TCJA, but still significantly less than they would face under the Biden plan.
Table 5 shows high earners’ top marginal rates in New York City and the much lower-tax Massachusetts (5.0 percent income tax rate), a state with which New York is frequently in competition for businesses, under current law, prior law, and the Biden plan with and without a SALT deduction cap. Under the Biden plan as outlined during the campaign, the top marginal all-in rate in New York City would reach 62.03 percent.
| Combined Top Marginal Rates in New York City and Massachusetts Under Multiple Systems | ||||||||
|---|---|---|---|---|---|---|---|---|
| Current Law (TCJA) | Prior Law (Pre-TCJA) | Biden Plan | Biden Plan + SALT | |||||
| NY | MA | NY | MA | NY | MA | NY | MA | |
| Federal Income Tax Rate | 37.00% | 37.00% | 39.60% | 39.60% | 39.60% | 39.60% | 39.60% | 39.60% |
| Medicare Taxes (Employee) | 2.35% | 2.35% | 2.35% | 2.35% | 2.35% | 2.35% | 2.35% | 2.35% |
| Social Security Donut Hole | — | — | — | — | 6.20% | 6.20% | 6.20% | 6.20% |
| Pease Limitation | — | — | 1.188% | 1.188% | 1.188% | 1.188% | 1.188% | 1.188% |
| Effective State Rate | 8.82% | 5.00% | 5.33% | 3.02% | 8.82% | 5.00% | 6.35% | 3.60% |
| Effective City Tax Rate | 3.876% | — | 2.341% | — | 3.876% | — | 2.791% | — |
| State-Only Effective Rate | 48.17% | 44.35% | 48.40% | 46.09% | 58.16% | 54.34% | 55.69% | 52.87% |
| State and City Effective Rate | 52.05% | 44.35% | 50.74% | 46.09% | 62.03% | 54.34% | 58.41% | 52.87% |
| NY / MA Tax Differential | 7.70% | 4.65% | 7.70% | 5.54% | ||||
| Source: Tax Foundation calculations. | ||||||||
While the TCJA yielded lower combined federal and state rates (but somewhat higher rates for those also subject to New York City taxes), by reducing the subsidy for high state and local taxes, it also accentuated the difference between states’ tax regimes. New Yorkers’ federal and state tax burdens are lower than they were previously—but the marginal rate differential between Massachusetts (to choose just one example) and New York rose by more than 1.5 percentage points. For New York City taxpayers, the tax differential with Massachusetts has risen from 4.65 to 7.7 percent.
Were Biden’s plan implemented, the combination of a higher rate, the restored Pease limitation, a Social Security donut hole payroll tax, and (assuming its inclusion for sake of argument) a larger but not unlimited SALT deduction would yield higher combined rates than New Yorkers saw either before or after implementation of the TCJA—58.41 percent, compared to 52.05 percent now and 50.74 percent under prior law. (Without the benefit of an uncapped SALT deduction, the Biden plan would increase New York City taxpayers’ top marginal rate to 62.03 percent.) The taxpayers’ marginal cost of living in New York rather than another state, however, would shrink somewhat compared to current law.
Should the Biden plan plus an uncapped SALT deduction, or something like it, become law, it will be tempting for state lawmakers to say that there is room to raise taxes because the SALT cap has been restored. It is important to be clear on what this means. It emphatically does not mean that federal burdens are lower, giving states the ability to raise rates to restore the status quo ex ante. Instead, it means that taxpayers’ burdens would be higher, but that the benefit of outmigration would be moderately lower—at least assuming that taxpayers only care about relative gains, and that aggregate levels do not give them sticker shock and provide the impetus for a move. If the concern is that combined federal taxes are already high, a plan which would increase those burdens would be a curious justification for raising New York’s taxes as well, even if the relative increase in other states’ burdens is even higher.
The Cuomo administration is, therefore, right to acknowledge that a capped SALT deduction means that the entire cost of higher income tax rates will be borne by New York taxpayers,[36] though the effect is not as pronounced as the governor has sometimes cautioned.[37] It would be a mistake, however, to conclude that only the SALT deduction cap matters. If, under policies implemented in the Biden presidency, high-income New Yorkers face higher federal taxes than they did either pre- or post-TCJA, an increase in state taxes will have an even more profoundly adverse economic effect and could accelerate outmigration even if the relative differences between states are slightly attenuated. That is particularly true if the cost of leaving has declined as workforces become more mobile.
New York’s Convenience Rule and the Future of Remote Work
Should remote work remain at elevated levels even after the pandemic subsides, New York will have a short-term revenue advantage over many of its peer states—albeit one that may come under increasing legal and political scrutiny, and one which may backfire in the long term, chasing employers out of the state. The policy in question is a relatively obscure one, an income tax sourcing rule called the “convenience of the employer” rule which has the effect of sourcing an employee’s income to New York if her office is located in-state, even if she conducts most or all of her work elsewhere.[38] As firms increasingly position themselves to be friendly to remote work, the effect of this policy could easily shift from one of maintaining revenues even as employees disperse to one of driving employers out of state as relocation becomes more attractive for their employees’ tax burdens as well as their own. Firms which remain, moreover, may find it more difficult to attract and retain talent.
Under most state systems, protections exist to avoid double taxation when a taxpayer earns income in more than one state. A taxpayer’s domiciliary state—the place where they live—begins with a baseline of taxing all income from all sources, whether earned there or elsewhere, while other states may tax that individual on income earned within their borders. Domiciliary states then provide a credit for taxes paid to other states (frequently, but not always, capped at the amount the taxpayer would have paid on that income in their home state), avoiding double taxationDouble taxation is when taxes are paid twice on the same dollar of income, regardless of whether that’s corporate or individual income..
If, for instance, a Mainer earned half her income in Vermont, her Maine taxable income would include income earned in both states, while her Vermont taxable incomeTaxable income is the amount of income subject to tax, after deductions and exemptions. Taxable income differs from—and is less than—gross income. would be half that amount. Maine would then give her a credit for the amount she paid in Vermont, ensuring that tax owed is never more than the higher of the two states’ rates on any given income stream. That, at least, is how it is supposed to work. New York and six other states with convenience rules (or similar sourcing rules) complicate things substantially, to the detriment of taxpayers.
Under so-called convenience rules, an employee is treated as if they work in their employer’s state if their work is performed elsewhere for what is termed the “convenience of the employer”—but convenience is defined very broadly, and the exceptions tend to be quite narrow. States have not always done a good job of spelling out what is meant by “convenience,” but generally the only exceptions are for when an employee’s work legitimately could not be carried out in the employer’s state.
For example, a technician servicing a New York company’s products in Vermont could not, by definition, do her job in New York, so that is not for the convenience of the employer. But a financial advisory firm’s work theoretically could be performed in the employer’s state, no matter how inconvenient or even impossible that might be for a given employee. New York and other states with convenience rules claim that income even if the employee never sets foot in the state.[39]
The convenience rule, by sourcing income to New York based on an office location, can deny taxpayers the ability to avail themselves of other states’ credits for taxes paid to other states, since, from the standpoint of those states, the taxpayer both lived and worked in their state. A company which authorizes telework, while based in New York, could frequently see its employees subject to two different state income taxes, with no offsets.
When this does and does not happen is complex and varies based on states’ interpretations and applications of their laws. Some statutes, like Vermont’s, are explicit: for a taxpayer to merit the credit, the income must be earned while physically present in the other state. Most other state statutes are silent on this point; nothing in, say, Rhode Island law expressly spells out what is required for income to be determined to be derived from New York.
Generally, however, the taxpayer’s domiciliary state is likely to assert that income earned while both living and working in their state is rightfully theirs to tax, concluding that just because an employee’s office is in another state does not mean that her income is “derived from sources outside the state.” So when a state with a convenience rule steps in and asserts the right to tax it as well, the result is double taxation.
The following table outlines three scenarios to demonstrate how tax liability is affected by convenience rules. In the first instance, a taxpayer commutes into a New York office from a New Jersey residence, with the income earned from employment in New York included in both states’ bases, but with New Jersey offering a credit that wipes out liability. In the second scenario, the New Jersey resident conducts all her work remotely in New Jersey, even though her business maintains an office in New York (and she is not assigned to an office somewhere else). In this case, she is denied New Jersey’s credit, and is exposed to double taxation. Finally, we imagine a scenario in which New York repeals its convenience rule; here, the taxpayer pays taxes to New Jersey, but not to New York.
| Commute Into New York Office from New Jersey | New Jersey Remote Work with Convenience Rule | New Jersey Remote Work without Convenience Rule | |
|---|---|---|---|
| New York Liability | $5,458 | $5,458 | $0 |
| New Jersey Pre-Credit Liability | $4,182 | $4,182 | $4,182 |
| New Jersey Tax Credit | ($4,182) | $0 | $0 |
| Total Liability | $5,458 | $9,640 | $4,182 |
| Sources: State tax schedules; Tax Foundation calculations. | |||
Crucially, this is, in 2020, a hypothetical where New Jersey is concerned. The Garden State has temporarily waived several nexus and income tax sourcing rules for the duration of the COVID-19 pandemic, and is allowing taxpayers who normally commute into New York to retain the benefit of the credit for taxes paid to other states even if they no longer actually commute to New York.[40] This is a generous, taxpayer-friendly policy that avoids double taxing residents by forgoing tax revenue to which New Jersey has a far stronger claim than New York does. It is, however, a temporary policy. Once the pandemic subsides, a remote worker based in New Jersey would face double taxation if her office were located in New York, as was the case before the pandemic.
A New Yorker might well ask why he should care: even if the outcome is unfair to remote workers who reside outside the state, it is certainly consistent with the late Sen. Russell Long’s dictum (“Don’t tax you, don’t tax me, tax that man behind the tree!”),[41] and with the general popularity of exporting taxes to nonresidents. The potential concerns are twofold: one, that the tax regime might end abruptly either through federal legislation or an adverse court ruling, and two, that over time, it will drive businesses out of state.
New York’s convenience rule has existed for years, but its significance will be much greater as businesses continue to embrace telework even after it is possible for all workers to return to their offices. It is increasingly likely that companies’ unplanned experiment in telework will yield a long-term shift in how we conceptualize the workplace. In March and April alone, over 420,000 people left New York City.[42] Through October, nearly 300,000 households—not individuals—have filed change-of-address forms designating a new address outside the city,[43] a statistic that almost certainly understates the extent of the exodus. Some of those who left may never return.
In the short term, New York and the six other states with such rules[44] will be tempted to maintain them to stave off revenue declines as workers relocate elsewhere. Such rules, however, render states incredibly unattractive for businesses that wish to develop a remote work culture. By locating their offices in such a state, businesses can expose many of their employees to double taxation. This becomes an incentive to locate (or relocate) elsewhere.
Convenience rules sever whatever tie exists between a tax and the government services it funds. While most taxes (unlike some fees) fund a broad array of services and cannot be understood as a strictly user-pays arrangement, there is at least some connection between the taxpayer and the expenditure of the funds. Taxpayers pay for the governance of the area where they work—a place from which they derive some direct benefit. Taxing people who never set foot in a state, under a vague and inconsistently applied notion that they are availing themselves of the state’s market simply because their company has an office there, has scant justification.
States have broad latitude to tax in-state activity as they wish, subject to a few constitutional constraints. Aggressive tax structures which seek to tax activity that takes place wholly or almost entirely beyond the state’s borders, however, represent bad tax policy, raising constitutional questions and, as their salience increases, drawing greater attention from federal lawmakers and peer states that might be willing to challenge these rules in court.[45] New Hampshire has already entered a motion for leave to bring suit against Massachusetts before the U.S. Supreme Court over the latter’s sourcing rules[46]—a case in which any adverse ruling would also implicate New York’s regime—and a bipartisan New Jersey bill would open the door to similar litigation against New York as well.[47]
Evaluating New York Revenue Options
Some policymakers have approached the revenue question with trepidation, others with gusto. For some, the pandemic-induced revenue crunch represents an ideal time to move forward with sweeping tax policy changes; for others, it is a time for caution, balancing immediate revenue needs with the recognition that budgets can only be made whole if the economy roars back to life.
Those counseling caution have the better end of the argument. New York’s tax burdens are already the highest in the nation, with state and local taxes claiming 13.9 percent of New York personal income, compared to a national average of 9.8 percent. Even other high-tax jurisdictions like New Jersey (10.8 percent), Connecticut (10.7 percent), and Illinois (10.6 percent) are below New York levels of taxation.[48] New Yorkers’ capacity for higher taxes is not unlimited, and sensitivity to tax burdens has doubtless increased as remote work becomes considerably more feasible.
New York has netted a loss of nearly a million residents the most recent seven years for which data are available, reducing annual AGI by more than $50 billion (5.4 percent). By the standards of most of the rest of the country, these are staggering losses. New York has endured them for now, buoyed by the sheer size and vigor of its economy. The potential losses now, as businesses and individuals decide whether to return to New York, and in what capacity, could dwarf prior outmigration, and aggressive new taxes could put a thumb on the scale for some taxpayers considering their options—typically those with the largest contributions to the state’s coffers.
The remainder of this publication reviews a range of tax proposals—some with promise, others deeply fraught. Policymakers face difficult choices in the months and years ahead, but whatever decisions are made, it is important that they are reached in light of a serious analysis of the effect of proposed tax changes on the state’s competitive standing. That competitive standing has never been more important.
Mark-to-Market Taxation of Capital Gains Income
Some state lawmakers, led by Sen. Jessica Ramos (D), have proposed what is known as mark-to-market taxation of capital gains income. The so-called “Billionaire Mark to Market Tax Act” (S.8277),[49] sponsored by Ramos, would treat unrealized capital gains on billionaires’ assets as taxable income, and would begin with a first-year catchup period in which all existing realized gains are taxed (with an optional 10-year payment schedule, with a 7.5 percent penalty). Proponents believe it could raise up to $5.5 billion a year, and more than four times that the first year, which is intended to capture years of previously accumulated gains.[50] The tax would have a dramatic impact on New York’s financial sector and its investor class—a highly mobile group of taxpayers.
The proposal involves an annual tax on the appreciated value of a wide range of assets, including stocks and bonds; interests in private equity or hedge funds; ownership interests in S corporations, partnerships, or other closely-held or noncorporate businesses; cash, deposits, and options; futures contracts; real property; art and collectibles; pension funds; and other assets. The tax falls on such property wherever it is sitused (it need not be in New York) if it is owned by the taxpayer, their spouse, their minor children, or any estate or trust of which they are the beneficiary. Notably, it also applies to assets held by private foundations (including charities) to which they are a substantial contributor,[51] and to gifts they give, which are taxed as if they were still owned by the taxpayer.[52]
Although it has been branded a wealth taxA wealth tax is imposed on an individual’s net wealth, or the market value of their total owned assets minus liabilities. A wealth tax can be narrowly or widely defined, and depending on the definition of wealth, the base for a wealth tax can vary., it technically is not one, because it only taxes the increased value of assets, not the total value, each year. Nevertheless, it has enough in common with wealth taxes to replicate some of their economic pitfalls—and the legal ones as well.
New York’s state constitution categorically prohibits a wealth tax as commonly understood, providing that “[i]ntangible personal property shall not be taxed ad valorem nor shall any excise tax be levied solely because of the ownership or possession thereof, except that the income therefrom may be taken into consideration in computing any excise tax measured by income generally,” and that “[u]ndistributed profits shall not be taxed.”[53]
The entire article on state tax powers, adopted by the Constitutional Convention of 1938 and ratified by a popular vote that year, is sufficiently clear that even the most ardent proponents of wealth taxation concede that a traditional wealth tax is impossible in the state absent a constitutional amendment. Some, however, have suggested that a mark-to-market system of taxation, which would tax unrealized investment gains, could serve as a modified wealth tax, and that it would comply with the state constitution. That argument is dubious. To appreciate why, an understanding of classes of property is necessary.
At the highest level, property is bifurcated into real and personal property classes. Real property refers to land and improvements—essentially real estate and structures. Personal property is a catch-all class for everything else, though the terminology can be confusing, because “personal” does not tell us anything about the owner of the property. Both businesses and individuals possess personal property. Your television is personal property; so is a construction company’s heavy machinery.
Personal property, moreover, can be further divided into two types: tangible and intangible personal property. As the name suggests, tangible property refers to types of (non-real estate) property that can be touched and moved: machinery, equipment, vehicles, household goods, artwork, and the like. Intangible property refers to items of value that are not physical in nature—stocks, bonds, patents, or an ownership stake in a partnership, for instance. Under New York’s constitution (and the constitutions of most states), tangible property can be taxed under the property tax, but intangible property is exempt from taxation. New York and its localities cannot tax the value of intangible assets, and a wealth tax falls apart without that, since most wealth is concentrated in businesses and investments.
Proponents contend that accumulated but unrealized gains, which would be subject to taxation under the Billionaire Mark to Market Tax Act, are income, not wealth, and can be taxed as such without violating the state constitution. But while we might conceptualize them as economic income, this is a concept, not a taxable flow. Economists speak of the imputed rent the owner of a house receives from living in (and therefore gaining the benefit from) a house she owns, but no one mistakes this concept for the actual payment of rent. Similarly, the economic income associated with unrealized gains are not contemplated by the New York constitution’s authorization of income taxes, which fall on actual cash flows.[54] The constitutional gymnastics necessary to justify the tax may be enough to table it, but they are not the only concern.
Under current law—at both the national and state levels—capital gains are not taxable until a taxpayer sells an asset. Its rising (but unrealized) value on paper is not taxed. Some federal lawmakers have contemplated what is known as a mark-to-market system that taxes capital gains annually, whether or not those gains are realized,[55] though New York’s S.8277 represents the first meaningful consideration of such a proposal at the subnational level.
Mark-to-market taxation would result in a more accurate measure of fluctuations in wealth from year to year, but it is also exceedingly complex, requiring the annual valuation of assets that lack a sales price. It is also potentially quite economically damaging, necessitating the liquidation of some assets (including business investments) to pay taxes on valuation increases that are unmatched by income flows.[56] Taxpayers are obligated to remit actual taxes on paper gains.
It is important to note that mark-to-market taxation does not change the ultimate taxability of capital gains; it changes the timing of that taxation. But time is money—literally. Under the current deferral-based system of capital gains taxation, taxpayers benefit compared to a mark-to-market system where they must pay on gains more quickly. Additional revenue from such a proposal, therefore, is not due to taxing what was once untaxed, but by accelerating payment and benefiting from the time value of money. J. Wellington Wimpy would gladly pay you Tuesday for a hamburger today; some New York lawmakers, by contrast, would gladly accept your payment today for a gain realized years or even decades from now.
Consider an investment which appreciates at a constant rate of 5 percent a year for 20 years, producing $100 million in capital gains income,[57] and assume New York’s 8.82 percent rate applies to all that income. Under both systems, the taxpayer remits $8.82 million in tax—8.82 percent of the $100 million in gains. But under deferral, the entire amount is remitted in year 20, whereas under mark-to-market, payments are made every year. In present value, mark-to-market payments are worth $1.84 million more to the state than a single payment upon realization in 20 years.[58]
In one important respect, taxing capital gains at ordinary income tax rates already overtaxes these gains, particularly under a mark-to-market regime, because inflation is included in gains. At an inflation rate of 2 percent per year, for instance, the real rate of return on this hypothetical investment would only be 3 percent, but all 5 percent would be taxed. Deferral is a counterweight to the effects of inflation.
This hypothetical, at least, involves an asset with measurable appreciation. It is rarely that simple. Even with publicly traded assets, ownership through trusts and holding companies can complicate valuation, but privately held business assets, artwork, and other items in the portfolios of the wealthiest New Yorkers defy easy valuation. Nationally, publicly traded assets only account for one-fifth of the assets held by the top 1 percent, while private business assets account for more than half.[59] The lopsidedness would be even more acute when limited to New York’s roughly 120 billionaires. The value of many privately held businesses is unknown until they are sold.
Take a recent example from the tech world, where PayPal acquired an online coupon-clipping company called Honey in 2019. Before its acquisition, the 200-person company had raised about $41 million in venture capital and was likely generating good, if not necessarily phenomenal, income for its founders. After the acquisition, its two cofounders and two other high-ranking employees split $4 billion.[60] The co-founders are both billionaires now, but would anyone have valued their assets at anywhere near that level prior to the sale? And if they had, how would the owners have been able to pay?
The assessment process would, therefore, be highly speculative and legally contentious. Even the federal government would struggle with the task. When the Joint Committee on Taxation analyzed such a proposal, it observed the magnitude of the challenge: “Many mandatory convertible securities may not have a readily ascertainable fair market value, e.g. where they are not actively traded on an exchange. Determining a value at which to mark the securities to market each year could present challenges for both taxpayers and the IRS in those circumstances.”[61]
Taxing unrealized income, moreover, can easily disrupt the source of that income. When an asset is taxed upon realization, the realization event itself produces liquid assets from which the tax can be paid. Even taxing unrealized gains from publicly traded assets is relatively straightforward, since some portion of the shares could be sold in satisfaction of tax liability. (This would, of course, still have consequences for some wealthy investors who are trying to maintain a controlling interest, and conflicting treatment of capital gains at the federal and state levels would create confused incentives.) But with private business assets, the tax can be much more consequential: some portion of the company or its assets may have to be sold to pay taxes on gains that only exist on paper. The owners are asset rich but cash poor.
Such a highly complex, costly tax will undoubtedly change behavior. Research indicates that the long-run elasticity of capital gains with respect to taxation is between -0.6 and -0.79, meaning that a 10 percent increase in tax rates on capital gains would lead to an approximately 7.9 percent reduction in capital gains.[62] If proponents’ revenue estimates are correct (and they may be seriously inflated), they would represent more than a doubling of capital gains effective rates on actual realizations.[63] In addition to potentially changing investment decisions and reducing the overall amount of capital invested (cutting into future taxable returns), the tax could easily drive some of New York’s wealthiest taxpayers out of state—depriving the state of their existing income tax payments (including on capital gains), along with other taxes they remit, ultimately including estate taxes in many cases.
No tax system anywhere in the world has ever used mark-to-market taxation. New York is often an innovator, but implementing such a system at the state level would be incredibly daunting and economically uncompetitive even if it did not raise major constitutional concerns.
Stock Transfer Tax
For over two centuries, a single street has been almost synonymous with the financial sector. Wall Street is more than a street; it is a metonym for the entire American financial services industry. It is, nevertheless, still a street, a stretch of real estate incorporating the New York Stock Exchange, major investment banks, and other financial services companies. For years, however, conceptual Wall Street has burgeoned beyond the bounds of geographic Wall Street—and a stock transfer tax, which has generated interest in some quarters, could strike a heavy blow against New York’s centrality in the financial sector.
Legislation introduced by Assemblyman Phil Steck (D) and Sen. James Sanders (D)—A.7791 and S.6203, respectively—would revive a long-abandoned stock transfer tax at rates of up to 5 cents per share (1.25 cents for stocks worth less than $5), intended to raise as much as $13 billion per year. This could easily drive trading out of New York and deal a devastating blow to the state’s financial sector, which powers so much of the New York economy.
New York’s position as a global financial capital is rooted in the geographical and political advantages of 18th and 19th century markets. Such advantages build on themselves, and New York is an undisputed beneficiary of two centuries of agglomeration effects. Even a few decades ago, it would have been almost unthinkable to operate major parts of the global financial services industry outside a few major cities like New York, London, and Shanghai. But the world has changed.
In an increasingly interconnected global economy, where financial transactions can be processed anywhere and traders can work any place with a sufficiently fast internet connection, the importance of the major exchanges being located in New York City has attenuated. Given enough of a push, they could relocate—to Chicago, to Boston, to Denver, to anywhere, really.
The major exchanges have already signaled their willingness to relocate servers from New Jersey to some other state to avoid a proposed New Jersey tax on the digital processing of the transaction. Moving the exchanges entirely is a more serious undertaking, but not an unrealistic one. There are costs to moving: transition costs, certainly, to say nothing of the appeal of New York City for many of the industry’s high earners. Yet whereas it was once almost unfathomable that the financial services industry could operate from other locales, the industry’s need of New York City is clearly in decline.
The same cannot be said for New York’s (city or state) need of the financial services industry, which directly employed 8 percent of all employees in the city and generated about 20 percent of gross city product (2015 figures)[64]. This, moreover, does not take into account the indirect contribution from jobs and industries sustained by New York’s financial services sector.
Financial activities more broadly defined account for 29.1 percent of gross state product,[65] and by the more narrow banks and brokers measure, the industry is responsible for about 17 percent of state tax revenue[66]—but at both the city and state level, the industry is in decline. A New York City comptroller’s report covering economic performance through the final quarter of calendar year 2019 (fully prior to the pandemic) noted that the financial industry had seen employment declines for five consecutive quarters, citing lower interest rates, technological innovation, and “the relocation of jobs to lower cost geographies.”[67] The relocation floodgates could open if New York chose to impose punitive taxes on one of its most important, and increasingly most mobile, industries.
When they cannot be avoided, financial transaction taxes raise both implicit and explicit transaction costs, reducing trading volume and lowering asset prices. This is bad for markets overall, because higher transaction costs disfavor the rebalancing of portfolios, decrease liquidity, and discourage investment in lower-return instruments, while decreasing what is termed “price discovery,” the mechanism by which new information is incorporated into asset prices.[68]
At the country level, Germany, Japan, the Netherlands, and Sweden have repealed their financial transaction taxes in recent decades. In Sweden, the adoption of a financial transaction tax in 1983 led to a market decline of 5.3 percent in the month leading up to the tax’s imposition,[69] and ultimately, 30 percent of all trading in Swedish companies shifted from Stockholm to London in response.[70] An International Monetary Fund (IMF) analysis concluded that stock transfer taxes (STTs) “create many distortions that militate against using an STT to raise revenue,” since they reduce trading volume (elasticities between -0.4 and -2.6), reduce the value of securities, raise the cost of capital, and, consequently, reduce liquidity and slow price discovery. The IMF also concluded that, in addition to such taxes’ inefficiency as revenue tools, they were poorly suited to the regulation of financial markets, and that their costs would be borne not only by wealthy investors but also by pensions, mutual funds, and other vehicles of middle-class savings.[71]
No such tax has existed in the United States[72] since New York’s stock transfer tax was functionally eliminated in 1981 with the adoption of a 100 percent rebate, which remains in place today. In the intervening four decades, both national and international competition have skyrocketed, making a state-level financial transaction tax—which could be avoided by relocating to another state—particularly counterproductive.
New York had a functioning stock transfer tax from 1905 to 1981, when it was eliminated due to fears that the New York Stock Exchange would leave the state, a threat that is far more realistic now than it was four decades ago. Today, the tax is still technically levied on each share sold, at rates ranging from 1.25 to 5 cents depending on the cost per share, but the tax—which is paid through the purchase of tax stamps—is fully refunded by filing a claim with the state tax department.[73] In practice, money never changes hands. The system in place is a nuisance but ultimately carries only compliance costs, not actual tax liability.
That would change under A.7791, which would repeal the rebate and dedicate revenue to the general fund through the end of FY 2023, after which the revenue would be dedicated to infrastructure and housing programs. Assemblyman Steck estimates that the tax will raise $13 billion annually, ostensibly based on the amount of rebates currently issued,[74] though reported amounts (all automatically rebated) were $5.48 billion in FY 2019 and $4.04 billion in FY 2020.[75] Furthermore, since no money actually changes hands at present, these are functionally informational returns; there is no incentive for either the ostensible taxpayers or the state tax administrators to care about accuracy. Even more important is the question of what that figure would be if the major exchanges responded to the tax.
In 2003, the New York City Independent Budget Office (IBO) studied the impact of the restoration of the tax at half the prior rates and concluded that the tax would increase transaction costs by 23 percent, eliminate nearly 60,000 private sector jobs, and reduce trading volume by 18 percent. The current proposal is for twice the rate contemplated by the IBO study. An economic analysis commissioned by the Partnership for New York City concluded that every 10 percent decline in trading volume would increase securities industry employment by 6.1-6.4 percent.[76] When Wall Street sneezes, New York City catches a cold.
Studies of stock transfer taxes elsewhere, moreover, indicate that a 23 percent increase in transaction costs would reduce daily market returns by 1 percent, affecting markets across the country and, given the importance of U.S. exchanges, across the world.[77] The nature of that impact, of course, raises a different possibility, one contemplated in the IBO report as well: instead of accepting these losses, the exchanges could just leave. In 2003, the IBO noted that “[d]esertion of the city-based stock exchanges may be a real threat, particularly with the increasing competitiveness of electronic exchanges.”[78] Seventeen years later, that threat has never been more real.
In an October survey of Manhattan employers, those in the finance and insurance industries only expect 52 percent of their employees to return to the city by July 2021,[79] and the forced experiment with remote work is clearly demonstrating that traders and analysts need not be in New York City to do their jobs effectively. And in a globally interconnected age, the benefits of location are greatly reduced.
Thirty percent of publicly listed stocks in Sweden switched to the London exchange, which actually required listing in another country, and this in the early 1980s when the technological tools of remote work were still in their infancy. How much easier would it be for the major exchanges in New York City to relocate to some other state, and for those who make their living in the industry to follow, or, for that matter, to work from just about anywhere? With Wall Street associated with over one-sixth of all New York state revenues, a tax which could drive the industry elsewhere would be an extraordinary gamble at a time when officials are already fretting about a potential for post-pandemic economic decline.
Raising Income Tax Rates
New York is currently in the midst of implementing the second of two rate reductions for middle-income taxpayers since 2011. The first reduced the marginal rate for most middle-income filers from 6.85 percent to 6.65 percent while reducing rates for the upper middle class. The second, which phases in reductions between 2018 and 2025, will ultimately reduce the top rate on income below $80,650 (in 2020 dollars) to 5.5 percent. At the same time, however, the state has extended a temporary “millionaire’s tax” four times, undermining the state’s tax competitiveness and establishing a top marginal rate that cannot go substantially higher without damage to the state’s economy. Not that some will not try: a 3 percentage-point increase is on the table, which would bring top rates for New York City residents to nearly 16 percent.
Notably, New York has recapture provisions—which it shares only with Connecticut—which create an upper-middle-income “rate bubble” that gradually unwinds some of the benefit of the lower tax bracketsA tax bracket is the range of incomes taxed at given rates, which typically differ depending on filing status. In a progressive individual or corporate income tax system, rates rise as income increases. There are seven federal individual income tax brackets; the federal corporate income tax system is flat.. Beginning at $107,650 in taxable income, a single filer begins to lose the benefit of the rate on income under $80,650 (currently 6.09 percent), and beginning at $157,650, she begins to lose the benefit of the rate that theoretically applies to all income below $215,400 (currently 6.41 percent), with all the income below these thresholds ultimately taxed at 6.85 percent.[80] A similar recapture provision exists for New York’s highest income taxpayers, ultimately subjecting the entirety of their income—not just the marginal amount above $1,077,550—to the top rate of 8.82 percent.[81]
Through 2020, with the first three reductions of the second middle-income tax cut already in place, taxpayers are receiving an estimated $1.8 billion in relief compared to the prior rate structure. Reductions will continue to phase in a price tag of about an additional half billion dollars each year, through 2025, when a further $2.4 billion in annual savings will have been implemented, for an annual reduction of $4.2 billion compared to the pre-reform rate schedules. These tax cuts, which have been touted by Gov. Cuomo and legislative leaders, provide valuable relief to middle-income filers, but have less of an effect on migration, investment, or other economically-driven decisions than do the state’s high top marginal rates. Especially given the routine delays in the expiration of the millionaire’s tax, one option to raise revenue would be a temporary pause in further reductions, delaying implementation of the remaining scheduled rate reductions for perhaps two years, or until state revenues have recovered to an established level. Table 7 shows the phase-in of middle- and upper middle-income tax relief to date, and as scheduled to continue through 2025.
| Income Range | 2017 | 2018 | 2019 | 2020 | 2021 | 2022 | 2023 | 2024 | 2025 |
|---|---|---|---|---|---|---|---|---|---|
| $21,401-$80,650 | 6.45% | 6.33% | 6.21% | 6.09% | 5.97% | 5.85% | 5.73% | 5.61% | 5.50% |
| $80,650-$215,400 | 6.65% | 6.57% | 6.49% | 6.41% | 6.33% | 6.25% | 6.17% | 6.09% | 6.00% |
|
Notes: Bracket widths are shown for single filers. New York’s brackets are inflation-adjusted; income ranges are expressed in terms of the 2020 tax year. Source: N.Y. Tax Law § 601. |
|||||||||
The state’s so-called millionaire’s tax created a new top rate of 8.97 percent in 2009, during the Great Recession, atop the state’s prior top rate of 6.85 percent. Originally set to expire in three years, its sunset was extended in 2011 at a slightly lower 8.82 percent rate, then extended three more times, most recently through 2024. The tax brings in an estimated $4.5 billion a year, slightly more than the middle-income tax cuts are expected to forgo when fully phased in.[82]
In 2018, the top 1 percent of filers were responsible for 41.8 percent of tax liability, while the top 5 percent brought in 60.9 percent, as Table 8 shows. Notably, in 2007, before the millionaire’s tax was implemented and the highest earners faced lower marginal rates, these figures were actually higher, with 46.4 percent of liability accruing to the top 1 percent and 65.1 percent to the top 5 percent.[83] All else being equal, the millionaire’s tax and the first stage of middle-income tax relief should have increased the top 1 percent’s share to about 51.4 percent, but the share actually declined by 4.6 percent rather than increasing by 5 percent—almost the mirror image of what one might have expected.
| New York Individual Income Tax Liability by Income Distribution, 2007 and 2018 | ||
|---|---|---|
| Distribution | 2007 | 2018 |
| Top 1% | 46.4% | 41.8% |
| Top 5% | 65.1% | 60.9% |
| Top 10% | 75.2% | 71.5% |
| Top 25% | 90.2% | 87.6% |
| Source: New York Executive Budget, FY 2021. | ||
In short, New York increased the progressivity of its rates but saw a decrease in the (still exceedingly high) progressivity of its collections. Highly progressive tax structures can discourage investment and economic growth and promote outmigration. When the progressivity of the structure increases but the progressivity of tax liability goes in the opposite direction, that may be an indication that this is already happening, and that the high rates are beginning to backfire.
Between 2010 and 2017 (most recent data), New York lost a net 963,182 residents to outmigration and, in aggregate, about $51 billion in annual adjusted gross income in current dollars, reflecting a state gross income loss of 5.4 percent.[84] About one-fifth of those leaving the state decamped to Florida, where they are shielded from both harsh winters and an individual income tax.[85] The COVID-19 pandemic, meanwhile, has likely both accelerated existing long-term outmigration trends and created some share of residents whose temporary relocations will become permanent, especially as remote work becomes more feasible. It is in this environment that some have proposed a further increase in the top marginal rate, from 8.82 to 11.82 percent.
Most economists consider the individual income tax to be the second-most economically costly of the major taxes, after the corporate income tax, because income taxes fall on labor and investment, decreasing the supply of labor while increasing its cost, while reducing the return to savings. The strongest economic impact is at higher income levels, because of the outsized role of the economic decisions of high earners, their greater incentive (and ability) to adjust their activity to reduce tax liability, and their far greater mobility, which may entail the opportunity to move out of the state altogether to avoid unduly high taxes. Significantly, pass-through businesses (S corporations, partnerships, LLCs, and sole proprietorships) are taxed through the individual income tax, meaning that that high top marginal rates substantially impact small businesses.
This is why economic analysis shows that highly progressive taxA progressive tax is one where the average tax burden increases with income. High-income families pay a disproportionate share of the tax burden, while low- and middle-income taxpayers shoulder a relatively small tax burden. structures discourage economic growth,[86] while less progressive structures and lower rates are beneficial to growth. One important study found that a 1 percentage-point cut in the average personal income tax rate raises real GDP per capita by 1.8 percent.[87] Pass-through businesses, moreover, show elasticities of -0.2 to -0.4 percent with respect to individual income tax rates, meaning that a 1 percentage-point increase in the individual income tax rate reduces the number of pass-through businesses by up to 0.4 percentage points.[88] Crucially, filers with more than $1 million in taxable income represent only 0.6 percent of taxpayers but report 15.2 percent of all small business income in New York, and 74.3 percent of all capital gains income.[89]
For New York City residents—and the overwhelming majority of those subject to the top rate live in the city—adding 3 percentage points to the top rate would yield a combined state and local income tax rate maxing out at 15.696 percent, the highest such rate in the nation. It would significantly outstrip the top rates in California (13.3 percent) and neighboring New Jersey (10.75 percent),[90] neither of which allow local income taxes, though Newark, New Jersey has a 1 percent payroll tax which brings the combined top rate to 11.75 percent on earned income.[91] New York State Budget Director Robert Mujica has called attention to the importance of considering New York City’s local tax in comparisons with New Jersey’s top rate.[92]
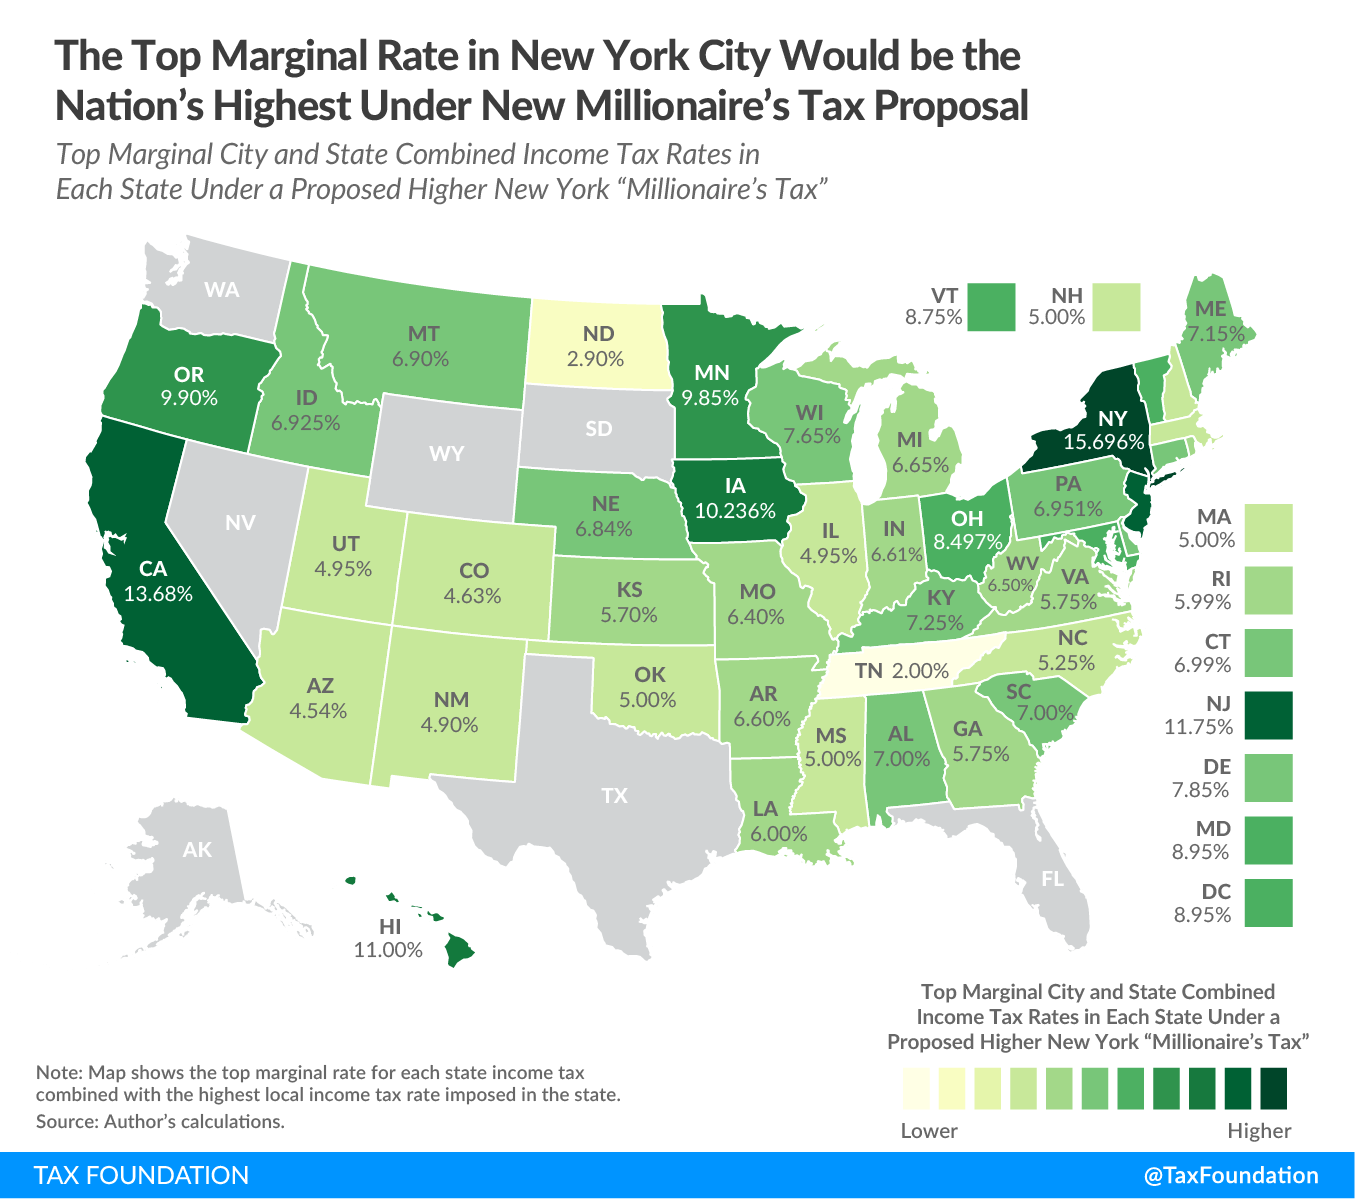
Neighboring New Jersey has increased its income tax rates twice in the past two decades. Before the recent imposition of a top marginal rate of 10.75 percent, the state raised its top marginal rate from 6.37 to 8.97 percent in 2004, with the rate increase falling on income above $500,000. A New Jersey Department of Treasury analysis in 2011 concluded that between 2004 and 2009, the tax increase resulted in a loss of 20,000 taxpayers and $2.4 billion in gross income.[93]
Separately, the state experienced a dramatic decline in wealth inflow in the five years following the tax increase. According to research conducted at the Center on Wealth and Philanthropy at Boston College, in the five years between 1999 and 2003 (inclusive), New Jersey saw a net inflow of $98 billion in household wealth from other jurisdictions, while from 2004 to 2008 the state saw a net outflow of $70 billion.[94] The crucial change, which is separate from the findings of the Treasury study about tax effects on outmigration, is that the state’s wealth in-migration came to a screeching halt. Wealth inflow dropped 61 percent after the tax increase, while outflows continued.[95] Although the study’s authors did not attempt to identify the reasons for this decline, the state’s reduced tax competitiveness compared to its peers was certainly a contributing factor. Little wonder that many New York policymakers have been wary of following (or exceeding) New Jersey yet again.
If the Biden federal income tax plan were adopted in addition to the implementation of a higher millionaire’s tax the all-in top marginal rate for a New York City resident would reach 65.03 percent, compared to 52.05 percent now and 50.74 percent prior to the TCJA’s introduction of a cap on state and local tax (SALT) deductions. New York officials, who continue to campaign for the elimination of the SALT cap, overestimated its impact on outmigration, but given the level of alarm over a 1.31 percentage-point increase over 2017 combined rates, the prospects of rates 14.29 percentage points higher than they were pre-TCJA should be of great concern.
Taxing Digital Advertising
Digital taxation has emerged as the cause célèbre of the international tax community in recent years, and the notion—if not the practice—has caught the attention of some domestic tax policy advocates as well. In Europe, where the idea of digital services taxation first caught on, the idea, while flawed, arose to address a problem: the value-added tax (VAT) structure that predominates in European taxation means that digital services are harder to tax in the jurisdiction where the service is received. That problem does not exist in the United States, where these companies’ profits are already apportioned to states and taxed. The internet is not an untaxed market, and companies buying and selling digital advertising have not escaped the reach of state tax collectors. The lack of a loophole to patch, however, has not eliminated interest in the idea in New York and elsewhere.
Digital taxation proposals in the United States have taken several forms: they have been conceptualized as a tax on a broad array of digital services, as a tax specifically on digital advertising, and as a tax on the use of consumer data associated with in-state residents. In each case, the proposals constitute an excise tax above and beyond existing taxes on the profits of the associated business activity (income taxes) and on the transaction itself (sales taxes, where applicable).
In New York, policymakers appear most interested in a digital advertising tax, similar to one vetoed in Maryland.[96] A more sweeping data tax remains more speculative, though the idea has been advanced by several elected officials.[97] Both ideas predate the pandemic, but have gained additional support in some quarters during the crisis due both to enhanced revenue needs and the perception that the tech industry is faring well and has the capacity to absorb additional tax burdens.
Proponents of a digital advertising tax for New York have modeled their proposal on Maryland S.B. 2 (later incorporated into H.B. 732). New York’s S.8056, introduced in March 2020 by Sen. Michael Gianaris (D), is virtually identical to the Maryland proposal, utilizing the same definitions almost word-for-word, adopting the same rate structure, and even utilizing the same internally contradictory approach to apportionment, changing only the office responsible for determinations—from Maryland’s comptroller to New York’s tax commissioner.
Future consideration of a digital advertising tax may or may not proceed along the lines of S.8056, but since this approach has proven somewhat of a model thus far, its contours are worth considering. Like the bill from which it was cribbed, S.8056 proposes taxing gross revenues derived from digital advertising within the state by all companies with at least $1 million in revenues attributable to New York and $100 million or more in global revenues.
New York taxable revenues would be subject to different rates based on global annual gross revenues for the broader business, not just advertising revenues, let alone just revenues attributable to New York. Rates range from 2.5 to 10.0 percent. However, since the largest global digital advertising networks (like Google AdWords or the Facebook or Amazon advertising platforms) are used by everyone from the largest corporations to the smallest “mom-and-pop” stores, the 10 percent rate is likely to apply to a large share of all advertising in New York, regardless of the size of the company placing the ad. Major advertising platforms have already responded to European digital advertising taxes by announcing surcharges;[98] the same can be expected in New York or any other state which adopts a similar tax.
Notably, these rates—like Maryland’s proposed rates—are not graduated or progressive, meaning that the higher rates do not just fall on marginal revenue but all revenue. This is inherent in the unusual structure by which all global revenues, and not just New York taxable revenues, determine the taxable rate. If a company with $5 billion in global sales has $5 million in New York-targeted advertising, it will face a higher rate than a company with slightly less in global sales but $10 million in New York advertising.
| Rate | Global Annual Gross Revenues |
|---|---|
| 2.5% | $100 million to $1.0 billion |
| 5.0% | $1.0 billion to $5.0 billion |
| 7.5% | $5.0 billion to $15.0 billion |
| 10.0% | More than $15.0 billion |
| Source: NY S.8056 (2020). | |
In Maryland, lawmakers struggled with how to determine whether advertising was served to someone in the state. The introduced bill used Internet Protocol (IP) addresses indicating that a user’s device was located in the state or, in the alternative, a determination that a user is “known or reasonably suspected to be using the device in the state.” Ultimately recognizing the shortcomings of this approach, lawmakers adopted substitute language that is now mirrored in New York’s bill. Unfortunately, the new approach does not solve the challenges around geofencing advertising activity (that is, setting or determining the location where the advertising is served to users) so much as punts on it, leaning the design and implementation up to a state official—in New York’s case, the state tax commissioner.
ApportionmentApportionment is the determination of the percentage of a business’s profits subject to a given jurisdiction’s corporate income tax or other business tax. US states apportion business profits based on some combination of the percentage of company property, payroll, and sales located within their borders. is even more confusing. Again borrowing from Maryland’s legislation, the New York bill uses an approximation of formulary apportionment which makes little sense in an advertising context. Traditional corporate income tax apportionment is intended to address situations where businesses have economic activity in multiple states but profits are not clearly allocated among them, using factors like the business’s workforce, investment, or transactions (in apportionment terminology, its payroll, property, and sales factors) to divvy profits across states.
But here, the tax base is gross revenue from advertising into New York, so the challenge is not one of apportionment but of definitions (determining whether advertising is really being displayed on New York devices). Consequently, the formula devised becomes an exercise in circular reasoning, with the apportionment factor (gross advertising revenue) identical with the tax base.
Under the proposal, tax administrators would simply take the percentage of U.S. gross revenue that is attributable to New York, then multiply it by all U.S. gross revenue. If we set x to gross advertising revenue in New York and y to gross advertising revenue nationwide, the formula is (x/y) * y, which is to say: x. The formula begins exactly where it started, with the taxation of gross advertising revenue in New York. In many respects, the bill as it currently exists is more of a thought experiment than a viable tax, though that could change in future drafts.
But if much about how such a tax would work is unknown, one thing is perfectly clear: much of the tax would be borne by in-state companies and individuals. While the bill’s revenue thresholds are designed to target large, out-of-state companies (which raises legal concerns), legal and economic incidence are not the same thing. The tax is imposed on revenue from digital advertising served to people in New York, which will drive up the cost of advertising to New Yorkers. The advertisers will bear most of the additional cost—some of which they will pass along to consumers—and many of those advertising to New York residents will be New York-based businesses. The revenue thresholds may be designed around companies like Google and Facebook, but New York businesses and their customers bear the brunt of the bill. It is ultimately a tax, not on Google, but on a pizza parlor in Brooklyn, and not on Facebook, but on a bed and breakfast in the Adirondacks.
Because the tax is on gross receipts, it is not predicated on ability to pay. And because the rates are based on the characteristics of the advertising platform and not the advertiser, this approach yields the curious outcome that a large multinational business advertising on a local news site may face no tax, while a local restaurant purchasing keyword advertising on a search engine would bear the costs of a tax imposed at the 10 percent maximum rates. Although no digital advertising tax has yet been implemented in the United States, a study of a French digital advertising tax concluded that 55 percent of the costs would ultimately be passed along to consumers.[99]
Such proposals also raise legal concerns. An excise tax on digital advertising that does not equally apply to traditional forms of advertising likely runs afoul of the Permanent Internet Tax Freedom Act, which prohibits discriminatory taxes on electronic commerce. Constitutionally, moreover, states are forbidden from imposing taxes which discriminate against interstate commerce, and taxes on multistate businesses must be reasonably related to their in-state activity to pass legal muster. The tax rate schedule proposed in S.8056, which is based on extraterritorial receipts, is constitutionally infirm,[100] and even setting a threshold designed to exclude New York-based advertising platforms is constitutionally suspect.[101]
These are only a few of the constitutional challenges this or any other digital advertising tax might face.[102] An inadequate method for determining that the taxed advertising was actually served to in-state users—an issue glossed over in the bill—could fail the Complete Auto test for the taxability of interstate commerce.[103] And insofar as the U.S. federal government continues to threaten or impose retaliatory tariffs over the adoption of digital services taxes in other countries, or include agreements about them as a key point in trade negotiations, a state digital advertising or digital services tax could prevent the U.S. from “speaking with one voice” in regulating foreign trade, contrary to a Supreme Court ruling that “a state tax on the instrumentalities of foreign commerce must not prevent the Federal government from speaking with one voice when regulating commercial relations with foreign governments,”[104] raising the possibility that a state digital advertising tax could even conflict with Congress’ power to regulate commerce with foreign nations.[105]
Finally, such a tax could hurt consumers in other ways, by constraining consumer choice. By discriminating against advertising-supported content, the proposal favors a gated internet, in which more content is behind paywalls. The obliteration of ad-supported models of free online content was the explicit aim of the economist whose arguments spurred first the Maryland and now the New York proposals, even though it conflicts with the aims of bill proponents, who presumably do not want to eliminate online advertising to New Yorkers, which would defeat the proposal’s revenue-generating purpose.[106]
Taxing Consumer Data
Separately from other digital taxation proposals, some lawmakers, including Sen. Andrew Gounardes (D), have proposed a tax on data.[107] While details are limited, proponents have unveiled a broad framework under which such a tax could operate. It would first require quantifying the amount of data generated by New Yorkers and commercialized for profit and creating a regulatory system through which entities selling or transferring New Yorkers’ data for commercial purposes register and disclose their transactions. This accomplished, it would impose a tax on those transfers, either as a transaction fee or percentage of net revenue, and allocate the revenue between state and local governments.[108]
Implementing any such proposal would be exceedingly challenging, not least because assessing the value of New Yorkers’ data is so daunting. Even defining data is endlessly complex. Addresses are data, as are purchase histories, socioeconomic condition about consumers, browsing habits, and the like.
Notably, while some consumer datapoints are new, collecting and utilizing consumer data is not. Store loyalty cards have long enabled retailers to learn about their customers’ purchase patterns and better market to them, for instance, and obtaining the addresses and phone numbers of customers or prospects—also data—is certainly not a recent innovation. Valuation, moreover, is nebulous; even valuing something as simple as an address is challenging, as its potential value differs radically based on whose possession it is in and how it is used.
Much consumer data, moreover, cannot even be easily ascribed to particular consumers—nor is it intended to. Stores, for instance, pay close attention to changes in consumer preferences, and often experiment with different products or sales approaches. This creates data, and it might well be data from New Yorkers, but it is not data about any specific New Yorker. If some of these findings are transferred, does that constitute data generated by New Yorkers, and how would value be assessed?
Nor are data simply discrete pieces of information. The real value is how data comes together. A person’s contact information on its own is not terribly valuable, else telephone directories would be worth their weight in gold. Rather, the value comes when additional data are appended—when a profile of preferences and habits is built up. The sum is more valuable than the whole. So, for one company, a certain dataset might have modest value, while for another it might complete an important puzzle and be of immense value. And its value is in datasets that intermingle the data of New Yorkers and other customers across the country or even the world, which would be almost impossible for state authorities to grapple with.
Furthermore, creating a regulatory system requiring the disclosure of any transaction involving a New Yorker’s data would be incredibly onerous. Data transactions are not typically broken out by state, though they can be. Typically, a company is not purchasing “New Yorkers’ data,” just data. For online marketing purposes, moreover, they may well be renting lists or advertising to a third-party list. A company that advertises on social media, for instance, will benefit from algorithmic targeting of their marketing to select New Yorkers even if they did not choose to run a geographically targeted ad campaign in the state. Does this amount to a transfer of data for commercial purposes, or does it only count when the underlying data are transferred? If the former, the burdens are enormous; if the latter, the law would place a thumb on the scale favoring models in which companies never take possession of the underlying data but instead contract with third-party networks for such marketing.
It is easy to imagine legal challenges to such a regulatory scheme, which could considerably burden interstate commerce. And if the tax is on the transfer, or on a company’s net revenue, rather than on an estimate of the portion of a sale that can be attributed to New York data (which has its own problems), there are serious constitutional issues at play, with the tax likely impermissibly discriminating against out-of-state companies by overtaxing businesses for which New York-derived data play a more modest role in overall net revenues.
As with digital advertising taxes, a data tax has little theoretical justification. There is no loophole being exploited at present, as these companies’ profits are already apportioned to states and taxed. A data tax would simply represent another layer of tax, one imposed on a business input—in conflict with the broad consensus against taxing intermediate transactions, since this results in tax pyramiding, layering tax upon tax.
Modernizing the Sales Tax
New York prides itself on the many ways in which it stands apart, but its sales tax is not one of them. Like most of its peers, it imposes its sales tax on a base that consists of many goods—with economically significant policy carveouts—and relatively few services. The state exempts most personal services, such as dry cleaning, fitness classes, haircuts, and tax preparation. It exempts residential utilities, like water and electricity.[109] And it exempts select, but economically significant, tangible goods, like groceries, clothing (for purchases up to $110), and digital goods.[110] If lawmakers are looking for ways to raise revenues without undermining the state’s economic competitiveness, modernizing the state’s sales tax would be a good place to begin.
Base broadeningBase broadening is the expansion of the amount of economic activity subject to tax, usually by eliminating exemptions, exclusions, deductions, credits, and other preferences. Narrow tax bases are non-neutral, favoring one product or industry over another, and can undermine revenue stability. is more attractive than rate increases both because it rectifies an existing structural flaw in the state tax code and because combined state and local sales tax rates in New York are already high. The state rate is quite modest, at 4 percent, but the average combined state and local rate in New York is 8.52 percent, the tenth-highest rate nationwide.[111]
The starting point for sales taxes in New York—the sale of tangible property—is largely an accident of history, a relic of the Great Depression-era economy into which sales taxes were born, and from which most later ones, including New York’s, have been copied with only gradual subsequent evolution. With limited exceptions, sales taxes fall on appliances but not apps, and light fixtures but not landscaping. When sales taxes were first devised, services comprised a far smaller share of the economy, and it was administratively simpler to focus almost entirely on retail sales.
This is not, however, a reflection of today’s economy. We subscribe to streaming services rather than buying DVDs, VHS tapes, CDs, or records (all of which were taxable); we purchase e-books (untaxed) rather than paperbacks (taxable); we obtain programs and games through digital downloads rather than physical media (disks or cartridges). Increasingly, younger generations in particular purchase “experiences” more than tangible goods—and most of those experiences involve services, whether fitness classes or cooking lessons or excursions.
But it is not just new services; it is also a matter of older services taking on greater importance in the modern economy. Domestic help has all but vanished, but increasingly, there is an app for that, or at least a number to call: house cleaning services, dog walking and pet-sitting, ridesharing as an alternative to car ownership, or landscaping services in lieu of buying a lawn mower, to name just a few. The mower was taxed; its replacement (the lawn care service) is not. It is a story that can be told many times over. It is the story of a sales tax code built around an economy that no longer exists.
Changing consumption patterns, along with exemptions adopted by policymakers, are eroding the sales tax base, and New York’s has eroded more than most. In 2019, the state’s sales tax applied to just under 34 percent of the total value of theoretically taxable personal consumption.[112]
Separately, some scholars examine sales tax bases by calculating the value of taxed transactions as a percentage of personal income. Under this measure, Hawaii, for instance, has a sales tax breadth of 107 percent of state income.[113] The state exempts some transactions which arguably should be taxed, but double taxes others. New York also exposes some transactions to multiple levels of taxation but omits far more transactions altogether. New York’s sales tax breadth, as a percentage of state income, was a mere 27 percent as of 2017 (most recent data). A robust sales tax base would not reach 100 percent, as not all income is consumed in any given year, but, based on personal consumption data, should be just shy of 77 percent of state income in New York. Fifty years ago, the state’s sales tax breadth was 56 percent of personal income.
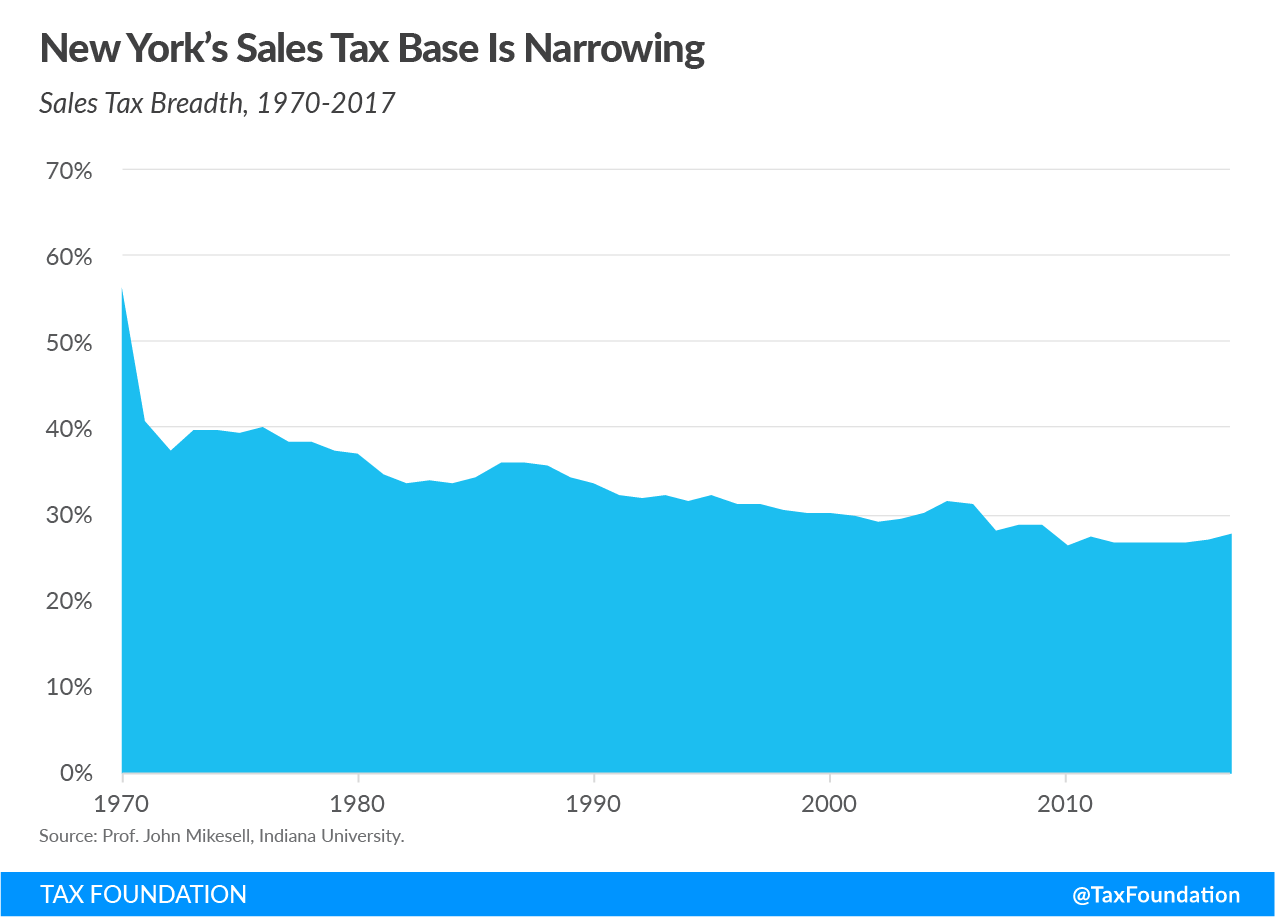
The poor structure of most states’ sales tax codes belies an overwhelming consensus among public finance scholars and policy researchers, who affirm the late tax scholar John Due’s maxim that “sales tax structure should produce a uniform distribution in consumption, should be neutral regarding methods of production and distribution, and should be collected at a reasonable cost.”[114] Broadly speaking, most scholars agree that an ideal sales tax is imposed on all final consumption, both goods and services, while excluding intermediate transactions (business inputs) to avoid tax pyramidingTax pyramiding occurs when the same final good or service is taxed multiple times along the production process. This yields vastly different effective tax rates depending on the length of the supply chain and disproportionately harms low-margin firms. Gross receipts taxes are a prime example of tax pyramiding in action., where the sales tax is embedded multiple times in the final price of the product.
Broadening New York’s sales tax base could make the revenue stream more stable, reversing its erosion in recent years—generating additional revenue by modernizing the structure to reflect the modern economy. As an added perquisite, broadening the sales tax base would yield additional revenue from tourists and business travelers once the pandemic subsides.
Some base-broadening options are transparently progressive, like taxing more personal services, which tend to be consumed by wealthier individuals. Others tend to be seen as more regressive or otherwise controversial, like taxing prescription drugs. And some are assumed to be regressive, but with little evidence. Taxing groceries and—especially in New York—clothing could fall into this latter category.
The exclusion of unprepared foods from New York’s sales tax base is intended as a progressive measure, though there is reason to believe it may not be terribly effective, since prepared foods are taxed at the standard rate and most of the progressivity of taxing unprepared foods is addressed by the exemption for SNAP (food stamps) and WIC purchases. In fact, while not enough work has been undertaken to establish a consensus, there is research finding that lower-income taxpayers would actually be better off if groceries were fully included in sales tax bases (while retaining the federally-indicated exemption of SNAP and WIC purchases) and revenue-neutral adjustments made to the tax rate.[115] Even without a rate reduction, inclusion of groceries (with continued carveouts for SNAP and WIC purchases) could be an equitable way to raise revenue.
The clothing exemption is similar. Capped at $110 per purchase, it is designed to keep clothing purchases free of sales tax for most people, while still taxing more expensive purchases. This is undoubtedly progressive at the margin, though it can sometimes lead to arbitrage (think more affordable “suit separates,” where jackets and trousers are sold separately, each individually under the threshold). The savings for a typical household, however, are modest, while the exemption is equally available to tourists buying T-shirts or businessmen buying costly neckties.[116] The state has frequently suspended the exemption in the past when budgets are tight.[117]
If desired, policymakers could divert a portion of the additional revenue from base broadening that includes groceries or clothing into refundable income tax credits or other assistance for low-income households, converting a broad and inefficient benefit into one more targeted at low-income populations, while generating additional revenue from higher-income taxpayers.
The following table provides estimates, mostly derived from the state’s annual tax expenditure report, for revenues forgone through select existing exemptions to the sales tax base. Although not all are politically feasible, it is valuable to understand their cost; together, this list, which is far from exhaustive, totals nearly $6 billion.
| Exemption | Cost |
|---|---|
| Groceries (excluding SNAP and WIC purchases) | $1,650 |
| Drugs, Medicine, and Medical Supplies | $1,565 |
| Clothing and Footwear (below $110 per item) | $915 |
| Residential Energy | $724 |
| Cable Television Service | $461 |
| Eyeglasses, Hearing Aids, and Prosthetic Aids | $256 |
| Admission Charges (Non-Charitable) | $114 |
| Laundering, Tailoring, Shoe Repair, and Similar Services | $104 |
| Digital Goods (e-books, music, and streaming) | $60 |
| Newspapers & Periodicals | $43 |
| College Textbooks | $28 |
| Vending Machine Sales | $20 |
| Municipal Parking | $13 |
| Total of Above-Specified Exemptions | $5,953 |
|
Note: An estimate for digital goods was obtained by scaling estimates from other states, in the absence of an estimate in New York’s tax expenditure report. Sources: New York tax expenditure report, FY 2020; author’s estimate (digital goods). |
|
Pied-à-Terre Tax
Some lawmakers have proposed authorizing New York City to impose what is known as a pied-à-terre tax on expensive second homes located within city limits. The appeal of a tax on wealthy nonresidents is obvious, but there are good reasons why similar proposals have come up short in the past. And whatever revenue the tax might raise for the city, its incentive structure could prove costly to the state by driving out some high-net-worth individuals—and their state tax dollars.
As a global capital of business, finance, and entertainment, New York regularly attracts wealthy nonresidents, some of whom work in the city or visit frequently enough to maintain a condominium or other second home. Some of these can be modest, at least by New York City standards; a few have carried price tags large enough to generate headlines. The current legislative vehicle for pied-à-terre taxation is S.44, which would authorize New York City to impose an additional tax, above and beyond the traditional property taxes, on certain condominiums and one- to three-family residences that are not primary residences.
For such condominiums with an assessed value of $300,000 or more, the additional tax could range from 10.0 to 13.5 percent of the value above $300,000. For one- to three-family residences, the threshold is higher: a five-year average market value in excess of $5 million. These properties could face an additional tax of 0.5 to 4.0 percent on value above $5 million. Both tax increases are substantial, but condominium owners—starting at much lower price points, even accounting for the fact that the assessed value of condos is often significantly lower than market value—would face substantially larger burdens.[118]
The previous attempt to impose such taxes on non-primary residences faltered over a legal hitch: how to impose a surtax based on the value of an individual condo unit and whether its occupant made it his or her primary residence when the taxes themselves were imposed on the cooperative apartment organization.[119] In its present iteration, the legislation solves this problem by establishing assessed value attributable to a given tenant-stockholder and obliges the co-op to bill the appropriate tenants. The viability of this approach continues to be the subject of debate.
A 2013 tax change in New York City provides a natural experiment on the elasticity of nonresident demand under targeted property taxation. In that year, the City denied the benefit of an abatement for owners of condos and cooperative units if they did not make the property their primary residence. A study found an elasticity of ownership of -0.6, meaning that for each one percentage-point increase in tax liability for nonresidents, the number of units owned by nonresidents declined by 0.6 percent. Notably, the results were highly stratified: for units worth less than $1 million, the effect was about half the -0.6 average elasticity, whereas for units worth more than $5 million, it was about twice the average, meaning that the number of units owned declined by more than a percentage point for each percentage-point increase in tax liability for the higher-value units.[120]
Studies elsewhere have scrutinized the effect of nonresident property surtaxes on vacation properties, which do not have identical purchasing incentives as do New York City pieds-à-terre but are similar enough for findings to be suggestive. A Michigan study, for instance, found that a $100 annual property tax increase is associated with a 0.73 percent increase in the probability of primary residents over the age of 50 moving within two years, and would also cause an 8.5 percent decrease in vacation homeowner density in the state.[121]
Crucially, both the city and state benefit from nonresidents maintaining second homes in New York City. Owners of second homes pay property taxes but consume far fewer public services than residents. They also pay other taxes, including income and sales taxes, while living and working from these locations. Vacation homes have been found to reduce tax prices for permanent residents because they reduce the share of expenditures that must be covered by their own tax dollars, without much increase in demand for those services coming from nonresidents. A 1 percent increase in the share of the tax base derived from vacation homes is associated with a 0.23 percent increase in the amount that can be spent on permanent residents, and a 1 percent increase in the concentration of vacation homes yields a 1.5 percent increase in per capita spending.[122]
While there are differences between vacation homes and units owned by nonresidents in New York, the principle is the same: they tend to be owned by high-net-worth individuals who are significant net taxpayers, not beneficiaries, and whose earnings and expenditures while in the city are also taxable. Policies to tax their properties at a higher rate would be counterproductive if they drove too many people to forgo a pied-à-terre altogether. For the state, moreover, which would receive no fiscal benefit from a city tax, any reduction in time that wealthy nonresidents spend in the state represents a hit to state coffers.
Legalizing and Taxing Gaming and Marijuana
In October, the governor and legislative leaders signaled that marijuana legalization and taxation would be included in the subsequent year’s budget, and a regulated and taxed sports betting market is not far behind. In sports betting, New York is looking to reclaim a market from New Jersey, which moved aggressively to establish itself as a sports betting state. In marijuana, both states are competing to establish a market. Legal markets in both realms can produce additional revenue, but establishing new markets can take time, especially when importation of products from other states is restricted, so policymakers should recognize that these proposals are for future years and will not immediately plug budget holes.
In his original FY 2021 budget proposal, Gov. Cuomo proposed a mixed excise tax system for marijuana, with cultivation taxed at $1 per dry weight gram of flower, $0.25 per dry weight gram of trim, and $0.14 per gram of wet cannabis, in addition to a 20 percent tax on dispensaries on the wholesale price and a 2 percent county sales tax.[123] Separately, legislation introduced by Sen. Liz Krueger (D) called for a retail tax of 18 percent, to which would be added a 4 percent sales tax, 1 cent going to the county and the other three to the city, town, or village in which the dispensary is located.[124] The governor’s plan could raise an estimated $300 million a year once fully implemented, but only about $20 million in the first year.[125]
Lawmakers would do better to consider an alternative tax structure should they choose to legalize and tax marijuana. Ad valorem taxes on marijuana have proven popular with lawmakers despite being unusual in the realm of excise taxation; taxes on tobacco, alcohol, motor fuel, and other products tend to be specific taxes, denominated by volume (e.g., 45.03 cents per gallon of gasoline or $4.35 per pack of 20 cigarettes), because volume is a better determinant of externalities created by the transaction than is price.
The price-based approach to taxing marijuana (an 18 or 20 percent tax on retail or wholesale price) may represent an attempt to address different potency levels in marijuana and marijuana-infused products, as a simpler way of imposing the tax than relying on THC content, weight, or some other measure. Ultimately, however, such a tax structure fails to correspond to harms and costs associated with the product. When imposed at the wholesale level, it adds significant complexity for vertically integrated companies which are forced to estimate a taxable wholesale value when no actual transaction takes place as the product moves through the production process.
And perhaps most importantly for states looking for reliable sources of revenue, it is sensitive to price fluctuations, with the likelihood that marijuana prices will plummet if and when a national legal market exists. Market rates in Colorado have fluctuated between a high of $2,007 per pound of bud in January 2015 and a low of $759 per pound in October 2018 (the current price, as of October 2020, is $1,316),[126] and this is just the result of more competitive markets in a single state. Federal legalization could see prices fall dramatically, cutting deeply into revenues from states which impose ad valorem rather than specific excise taxes. [127]
In Illinois, taxable legal sales began a mere seven months after passage of legislation, because the state enabled growers from the existing medical marijuana industry to ramp up their operations in anticipation of legalization.[128] New York has about 128,000 registered medical marijuana patients as of October 2020,[129] compared to about 87,000 in Illinois when that state adopted legalization—relatively similar on per capita basis.[130] Other states have often taken significantly longer to get marijuana sales off the ground; whether New York can duplicate Illinois’ success is an important question, but half a year is likely the minimum time necessary for sales to begin, and even then, most states—including Illinois—have struggled with the necessary regulatory regime well after legalization.
The legalization of sports betting takes less time, if for no other reason than the absence of a need for a growing season. Although companies would have to establish themselves in New York, they could do so based on models they have used in other states, including neighboring New Jersey. Newly legal under the U.S. Supreme Court’s 2018 decision in Murphy v. National Collegiate Athletic Association, sports betting has proven a popular new source of revenue for many states, with 23 states and the District of Columbia now offering legal wagering in some form.[131] These legalized sports books allow states to cut into, and tax, an estimated $150 billion black market in illegal bets,[132] though, as with marijuana taxation, doing so effectively requires setting competitive tax rates that can help undercut these illicit markets.
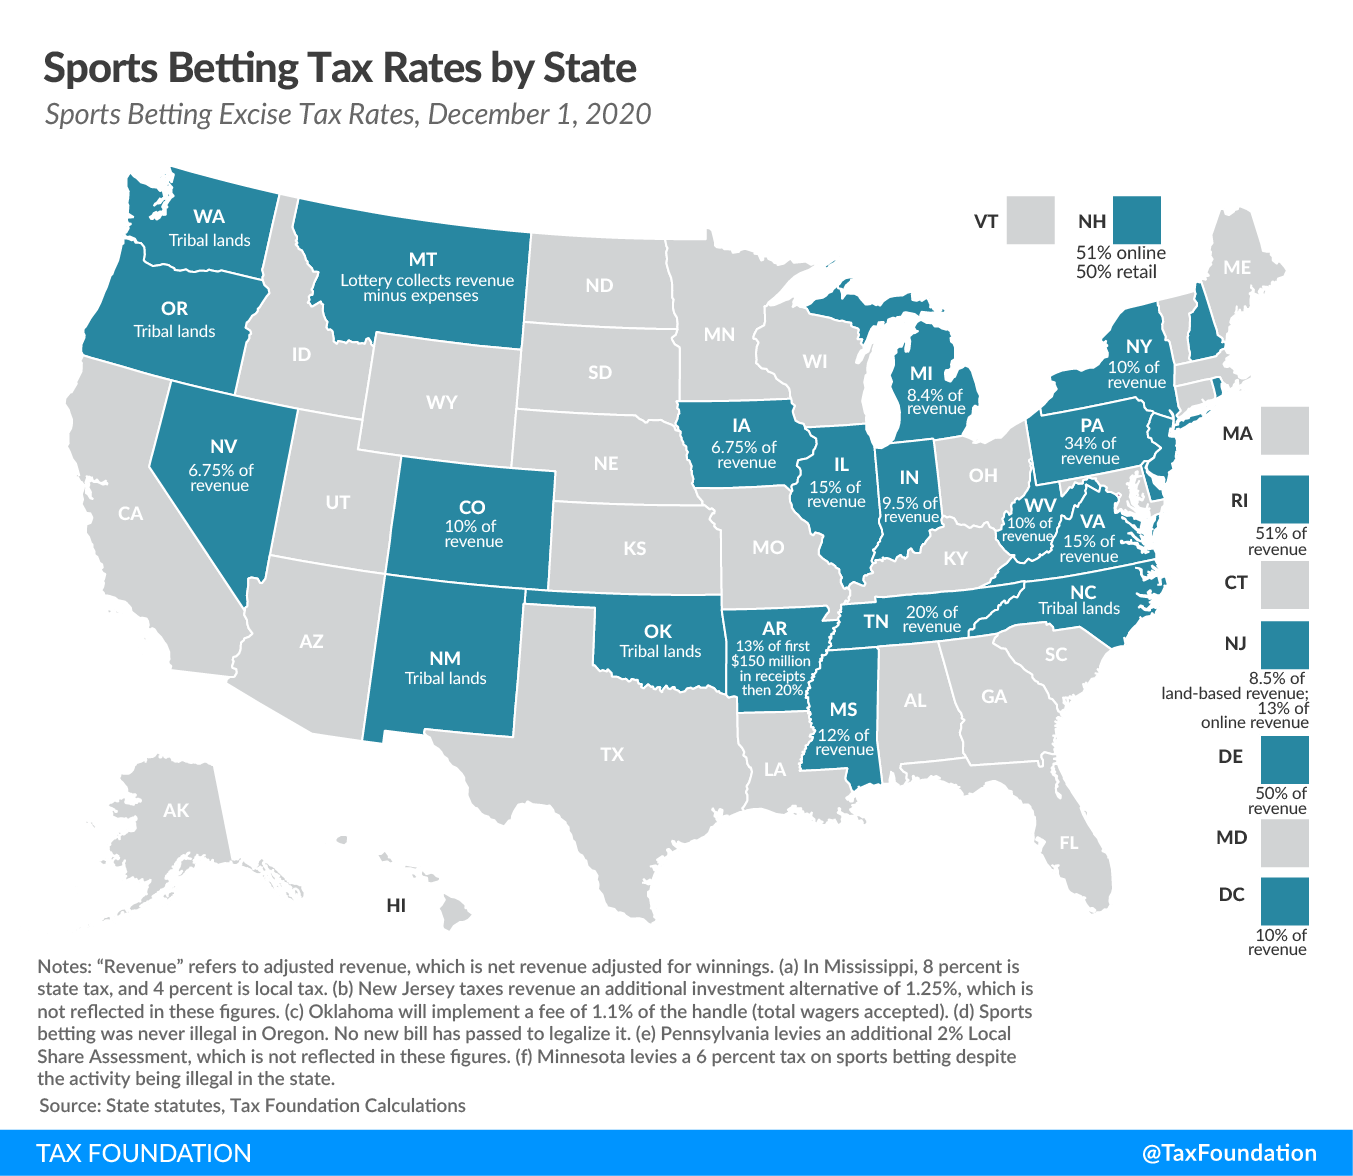
Revisiting Costly Incentives
Scaling back obsolete or targeted tax incentives is another means of raising revenue in an equitable, and relatively less economically harmful, manner. New York’s film tax credits, in particular, have a Hollywood fairy tale quality to them; according to the state, the credits have been responsible for 966,854 new hires between 2011 and 2019,[133] a period when total New York employment rose by 1.17 million[134] but employment in the state’s motion picture and sound recording industry rose by only 5,400.
In 2010, 54,700 New Yorkers were employed in the motion picture and sound recording industry, according to state data. By 2019, the total had climbed to 60,100, reflecting just under 10 percent growth in the industry’s employment totals over the decade. This is, of course, positive news for New York, but seems less impressive when you consider that the decade of incentive-fueled growth represents almost precisely one-third of the total employment growth in the industry over the past three decades, with the strongest growth coming before New York had any film tax incentives on the books.[135]
This is not to say that the film incentive has no effect; it clearly does. New York’s film industry saw considerable growth in the 1990s but declined in the early-to-mid 2000s, a decline the incentives were meant to reverse, with incentives introduced in 2004 and revised in 2011. In this they succeeded, but at enormous cost, currently about $420 million a year. In fact, over a decade the state has forgone an estimated $3.9 billion in tax revenue due to film tax credits, or just under $4.2 billion in current dollars.[136] Even if we attribute every one of the 5,400 additional jobs in the motion picture and sound recording industry over the past decade to the credits, which is implausible, this represents a cost of $775,000 per job over the decade.
Proponents would argue that, while not all those 5,400 jobs are attributable to the credits, other jobs are—in hospitality, for instance, and food services and construction. This is true, but these so-called multiplier effects are vastly overstated. New York’s film tax incentives have indeed dramatically increased the number of projects filmed in the state, which is one measure of success, but for about $4 billion in forgone tax dollars, residents have a right to demand an economic benefit as well. And there, the program is sorely deficient.
State studies of their film tax credit programs, at least when conducted by revenue offices and not economic development offices, invariably find them lacking. The Massachusetts Department of Revenue found that the Commonwealth spent more on credits than the industry actually spent in Massachusetts, that the Commonwealth only recouped 11 cents on the dollar in tax revenue, and that the average new job created cost nearly $119,000 in credits. A Maryland legislative study found that recovery of 6 percent of revenue forgone was their best-case scenario, while in Connecticut the figure was 7 percent. A Michigan study, meanwhile, found that the average job “created” by film tax credits lasts 23 days, since even working a single day as a film extra counts as a job created. Studies by California, Louisiana, New Mexico, Pennsylvania, and other states have found similarly disappointing results: such incentives can bring big studio projects to a state, but they are incredibly inefficient at creating jobs or economic growth.[137]
New York has spent more than twice as much on film credits in the past two decades than has any other state, and at $420 million per year, it is a price tag that New York can no longer justify, especially since 13 states have reduced or eliminated their own film tax incentives over the past decade, even before the outbreak of a global pandemic.[138] Gov. Cuomo briefly floated ending the program when the Amazon headquarters deal for the borough of Queens fell through in 2019.[139] However serious that proposal was at the time, it deserves to be taken seriously now.
Other incentives are also worthy of reconsideration. The state’s Excelsior Jobs Program Tax Credits cost an estimated combined $161 million in 2020, providing credits for job creation, investment, and research and development, out of a possible $200 million authorization.[140] Under the program’s current terms, the cap on tax credit amounts will begin to decline in 2022, reduced to $150 million that year, then $100 million in 2023 and $50 million in 2024 before expiring in 2025 unless reauthorized by the legislature.[141] Although these broader credits are more defensible than the state’s film tax incentives, economic development incentives have a poor track record, narrowing the tax base, driving up effective rates for companies that do not quality, distorting investment decisions, and often failing to achieve economic growth.[142]
Even if policymakers are wary of eliminating these incentives entirely during a recession, one consideration could be an acceleration of the existing phasedown schedule. A stable, well-structured tax code with competitive rates for all comers is the best economic development incentive. Far better to roll back some targeted incentives than to tinker with structural provisions to raise additional revenue, as, for instance, California has done.[143]
Conclusion
The magnitude of New York’s budget shortfall will depend substantially on what, if any, short-term aid the state can expect from its federal government—a question that may be answered soon. Some of the most alarming figures regarding the state’s losses, moreover, are not a good representation of the state’s actual (and still quite large) budget hole. But balancing New York’s budget has been a difficult undertaking in the best of times, and it is an unenviable task now. There are no good options; there are only trade-offs.
Some revenue options, like reviving the stock transfer tax, creating a top marginal income tax rate of nearly 15.7 percent in New York City, or taxing consumer data, have serious drawbacks and could impede the return of many taxpayers who have temporarily relocated during the pandemic while further undermining the state’s competitiveness and overall business climate. Others, like modernizing the sale tax base, excise taxes on newly legalized markets in marijuana or gaming, or a short-term pause in scheduled tax rate phasedowns, hold more promise.
It is, as always, a balancing act—but it has rarely been more precarious than this. Taxpayers, especially the high earners who are responsible for the lion’s share of state tax collections, have never been less geographically tethered. There is still something special about New York, and there always will be. Mobility, though, is the watchword of a post-pandemic economy. For the Empire State to retain its pride of place, policymakers must prioritize sustainable, economically efficient revenue decisions, meeting the needs of the present with an eye to the future.
Stay informed on the tax policies impacting you.
Subscribe to our free newsletter to get the latest tax data, news and analysis.
Subscribe[1] “Make Billionaires Pay,” https://makebillionairespay.info/.
[2] Henry Wadsworth Longfellow, “Excelsior,” The Complete Poetical Works of Longfellow, Horace Elisha Scudder, ed. (Boston: Houghton Mifflin Co., 1922), 19.
[3] CNBC, “Top States 2019: Overall Ranking, 27. New York,” https://www.cnbc.com/2019/07/09/top-states-for-business-new-york.html.
[4] Internal Revenue Service data; Tax Foundation calculations.
[5] E.J. McMahon, “Where Are New Yorkers Headed?” Empire Center, Jan. 1, 2020, https://www.empirecenter.org/publications/wherearenewyorkersgoing/.
[6] New York Office of the Comptroller, “Comprehensive Annual Financial Report of the Comptroller for the Fiscal Year Ended June 30, 2020,” 396, https://comptroller.nyc.gov/wp-content/uploads/documents/CAFR2020.pdf.
[7] U.S. Bureau of Labor Statistics, “Unemployment Rates for States, Seasonally Adjusted,” Local Area Unemployment Statistics, September 2020, https://www.bls.gov/web/laus/laumstrk.htm.
[8] New York State Tax Reform and Fairness Commission, “Final Report, November 2013, https://www.governor.ny.gov/sites/governor.ny.gov/files/archive/assets/documents/greenislandandreportandappendicies.pdf.
[9] Joseph Bishop-Henchman, “New York Corporate Tax Overhaul Broadens Bases, Lowers Rates, and Reduces Complexity,” Tax Foundation, Apr. 14, 2014, https://taxfoundation.org/new-york-corporate-tax-overhaul-broadens-bases-lowers-rates-and-reduces-complexity/.
[10] Jared Walczak and Janelle Cammenga, “2021 State Business Tax Climate Index,” Tax Foundation, Oct. 21, 2020, 19, https://taxfoundation.org/2021-state-business-tax-climate-index/.
[11] Jesse McKinley, “Cuomo’s Tax Cuts, Boon for Middle Class, Come with Risk,” The New York Times, Apr. 11, 2016, https://www.nytimes.com/2016/04/12/nyregion/cuomos-tax-cuts-boon-for-middle-class-come-with-risk.html.
[12] Jared Walczak, “What Can Connecticut Learn from its Neighbors About Property Tax Limitations?,” Tax Foundation, July 15, 2020, https://taxfoundation.org/connecticut-property-tax-limitations/.
[13] Joseph Bishop-Henchman, “New York Corporate Tax Overhaul Broadens Bases, Lowers Rates, and Reduces Complexity.”
[14] E.J. McMahon, “How the Tax Cut Stacks Up,” Empire Center, Apr. 1, 2016, https://www.empirecenter.org/publications/how-the-tax-cut-stacks-up/.
[15] New York State Comptroller, “State of New York Comprehensive Annual Financial Report for Fiscal Year Ended Mar. 31, 2019,” 226, https://www.osc.state.ny.us/files/reports/finance/pdf/2019-cafr.pdf. Distributional data are only available through 2016.
[16] Peter Grant and Emma Tucker, “Manhattan Offices Are Nearly Empty, Threatening New York City’s Recovery,” The Wall Street Journal, Sept. 29, 2020, https://www.wsj.com/articles/manhattan-offices-are-nearly-empty-threatening-new-york-citys-recovery-11601371800.
[17] Partnership for New York City, “Return to Office Survey Results Released – October,” Oct. 28, 2020, https://pfnyc.org/news/return-to-office-survey-results-released-october/.
[18] For the first six months of the current fiscal year, which began in April, New York’s revenues were down 6.5 percent. New York is unusual in beginning its fiscal year in April rather than July, as most states do.
[19] New York Department of Taxation and Finance, “Monthly Tax Collections Reports” (multiple years), https://www.tax.ny.gov/research/collections/monthly_tax_collections.htm.
[20] New York Division of the Budget, “FY 2021 First Quarterly Update,” 14, https://www.budget.ny.gov/pubs/archive/fy21/enac/fy21-fp-q1.pdf.
[21] Id.
[22] Vivian Wang, “New York Progressives Meet Immovable Object: A $6 Billion Budget Gap,” The New York Times, Dec. 20, 2019, https://www.nytimes.com/2019/12/20/nyregion/democrats-progressive-ny-budget.html.
[23] If revenues grew at the anticipated rate of inflation beginning in FY 2019, then projected tax revenues for the four affected years (FYs 2021-2024) would be down $8.3 billion in real terms due to the pandemic. Using FY 2020 as a baseline, however, tax revenue losses are projected to be $33.5 billion lower than an inflation-adjusted no-growth scenario. Both scenarios are misleading in their own way, given income shifting across the two baseline years. Using a blended average of the two years as a baseline is, therefore, a more defensible approach, and against this blended baseline, four-year projected tax revenue losses are $20.9 billion.
[24] John Updike, “Family Ways,” The New Yorker, 52 (Mar. 29, 1976), 110-112. The cover of this issue of The New Yorker was Saul Steinbeck’s famous “View of the World from 9th Avenue.”
[25] Editorial Board, “Andrew Cuomo’s Tears of SALT,” The Wall Street Journal, Feb. 11, 2019, https://www.wsj.com/articles/andrew-cuomos-tears-of-salt-11549930778
[26] Jared Walczak, “Under the HEROES Act, State Budgets Could Soar as the Economy Suffers,” Tax Foundation, May 13, 2020, https://taxfoundation.org/heroes-act-state-budgets-soar-economy-suffers/.
[27] Jared Walczak, “New Census Data Shows States Beat Revenue Expectations in FY 2020,” Tax Foundation, Sept. 18, 2020, https://taxfoundation.org/state-tax-revenues-beat-expecations-fy-2020/.
[28] U.S. Bureau of Labor Statistics, “Employment Situation Summary,” USDL-20-2033, Nov. 6, 2020, https://www.bls.gov/news.release/empsit.nr0.htm.
[29] Karen DeWitt, “Cuomo Warns of $2.3 Billion Deficit,” North Country Public Radio, Feb. 5, 2019, https://www.northcountrypublicradio.org/news/story/37969/20190205/cuomo-warns-of-2-3-billion-deficit.
[30] Gerald B. Silverman, “Has Latest New York ‘Tax Flight’ Begun?” Bloomberg Tax, June 6, 2018, https://news.bloombergtax.com/daily-tax-report-state/has-latest-new-york-tax-flight-begun.
[31] Effective rates for high earners were higher in the 1950s than they were today, but not by nearly so much as the top marginal rate would have suggested. See Erica York, “Income Taxes on the Top 0.1 Percent Weren’t Much Higher in the 1950s,” Tax Foundation, Jan. 31, 2019, https://taxfoundation.org/income-taxes-on-the-rich-1950s-not-high/.
[32] Internal Revenue Service, “SOI Tax States – Historic Table 2,” 2018, https://www.irs.gov/statistics/soi-tax-stats-historic-table-2.
[33] E.J. McMahon, “New Yorkers Paid Less in Federal Taxes in First Year of New Federal Tax Law,” Empire Center, Sept. 3, 2020, https://www.empirecenter.org/publications/new-yorkers-paid-less-in-federal-taxes-in-first-year-of-new-federal-tax-law/.
[34] For more detail on these provisions, see Jared Walczak, “Top Rates in Each State Under Joe Biden’s Tax Plan,” Tax Foundation, Oct. 20, 2020, https://taxfoundation.org/top-tax-rates-under-biden-tax-plan/.
[35] For New York City residents subject to the top municipal rate of 3.876 percent, the cap reversed the effect, increasing liability at the very top. The Biden plan, rather than reversing this change, would slightly accentuate it, yielding a top marginal rate of 49.93 percent, up from the current law basis of 49.7 percent.
[36] In their legal incidence, at least. Other taxpayers across the country may share in this burden indirectly (the “economic incidence”), but this contrasts with the effect of the SALT deduction, which shifts federal income tax liability from high-tax, high-income states to those with lower taxes and lower income.
[37] Jared Walczak, “Governor Cuomo’s Aggressive Theory of Tax Flight—And Why He’s Wrong About How to Stop It,” Tax Foundation, Feb. 15, 2019, https://taxfoundation.org/cuomo-salt-deduction/.
[38] N.Y. Comp. Codes R. & Regs., tit. 20, § 132.18(a) (2007).
[39] Jared Walczak, “Teleworking Employees Face Double Taxation Due to Aggressive ‘Convenience Rule’ Policies in Seven States,” Tax Foundation, Aug. 13, 2020, https://taxfoundation.org/remote-work-from-home-teleworking/.
[40] Jared Walczak, “New Jersey Waives Telework Nexus During COVID-19 Crisis,” Tax Foundation, Mar. 31, 2020, https://taxfoundation.org/new-jersey-waives-telework-nexus-covid-19-crisis/.
[41] John H. Cushman Jr., “Russell B. Long, 84, Senator Who Influenced Tax Laws,” The New York Times, May 11, 2003, https://www.nytimes.com/2003/05/11/us/russell-b-long-84-senator-who-influenced-tax-laws.html.
[42] Kevin Quealy, “The Richest Neighborhoods Emptied Out Most as Coronavirus Hit New York City,” The New York Times, May 15, 2020, https://www.nytimes.com/interactive/2020/05/15/upshot/who-left-new-york-coronavirus.html.
[43] Melissa Klein, “New States Reveal Massive NYC Exodus Amid Coronavirus, Crime,” New York Post, Nov. 14, 2020, https://nypost.com/2020/11/14/new-stats-reveal-massive-nyc-exodus-amid-coronavirus-crime/.
[44] In addition to New York, they are Arkansas, Connecticut, Delaware, Massachusetts, Nebraska, and Pennsylvania.
[45] Jared Walczak, “Teleworking Employees Face Double Taxation Due to Aggressive ‘Convenience Rule’ Policies in Seven States.”
[46] “Motion for Leave to File Bill of Complaint,” State of New Hampshire v. Commonwealth of Massachusetts, Oct. 19, 2020, https://www.governor.nh.gov/sites/g/files/ehbemt336/files/documents/nh-v-ma-action.pdf.
[47] New Jersey S-3064 (2020).
[48] U.S. Census Bureau, “Annual Survey of State and Local Government Finances,” 2018; Tax Foundation calculations.
[49] New York S.8277 (2020).
[50] James Nani, “Group Calls for NY ‘Mark-to-Market’ Tax to Raise $5.5B,” Law360, Aug. 12, 2020, https://www.law360.com/tax-authority/articles/1300630/group-calls-for-ny-mark-to-market-tax-to-raise-5-5b.
[51] Generally defined as being responsible for more than 2 percent of the total contributions in a given year. See IRC § 4958.
[52] NY S.8277 (2020).
[53] NY Const, art XVI, § 3.
[54] E.J. McMahon, “AOC’s Favorite State ‘Billionaires Tax’ Bill Would Run Afoul of NY Constitution,” Empire Center, July 16, 2020, https://www.empirecenter.org/publications/aocs-favorite-state-billionaires-tax-bill-would-run-afoul-of-ny-state-constitution/.
[55] Taylor LaJoie and Hauqun Li, “Analysis of Capital Gains TaxA capital gains tax is levied on the profit made from selling an asset and is often in addition to corporate income taxes, frequently resulting in double taxation. These taxes create a bias against saving, leading to a lower level of national income by encouraging present consumption over investment. Proposals Among Democratic Presidential Candidates,” Tax Foundation, March 18, 2020, https://taxfoundation.org/2020-capital-gains-tax-proposals/; Taylor LaJoie, “Evaluating Senator Wyden’s ‘Mark-to-Market’ Capital Gains Tax,” Tax Foundation, Sept. 9, 2019, https://taxfoundation.org/senator-wyden-mark-to-market-capital-gains-tax/.
[56] Scott Eastman, Taylor LaJoie, and Chad Qian, “Evaluating Mark-to-Market Taxation of Capital Gains,” Tax Foundation, Dec. 17, 2019, https://taxfoundation.org/mark-to-market-taxation-of-capital-gains/.
[57] At a 5 percent annual rate of return, the initial investment would be about $60.5 million.
[58] Tax Foundation calculations, assuming a discount rate of 5 percent.
[59] Lily L. Batchelder and David Kamin, “Taxing the Rich: Issues and Options,” New York University School of Law, Sept. 11, 2019, http://dx.doi.org/10.2139/ssrn.3452274.
[60] Tom Metcalf and Julie Verhage, “Coupon Duo Now Worth $1.5 Billion After Honey’s Sale to PayPal,” Jan. 29, 2020, https://www.bloombergquint.com/onweb/coupon-duo-now-worth-1-5-billion-after-honey-s-sale-to-paypal.
[61] Joint Committee on Taxation, “Present Law and Analysis Relating to the Tax Treatment of Financial Derivatives,” JCX-21-08, Mar. 4, 2008.
[62] Scott Eastman, “JCT Report Shows Capital Gains are Sensitive to Taxation,” Tax Foundation, Sept. 25, 2019, https://taxfoundation.org/jct-report-shows-capital-gains-are-sensitive-to-taxation/; Joint Committee on Taxation, “Estimating Taxpayer Bunching Responses To The Preferential Capital Gains Tax Rate Threshold,” JCX-42-19, Sept. 10, 2019.
[63] Tax Foundation calculations. In lieu of information specifically on billionaires, we examined the net capital gains income of all filers with more than $10 million in annual income in the most recent year, yielding $50.37 billion in net gains and about $4.44 billion in estimated tax liability. Proponents assume annual revenue increases on the order of $5 billion a year, not counting the catch-up revenue from prior accumulated unrealized capital gains.
[64] Partnership for New York City, “At Risk: New York’s Future as the World Financial Capital,” June 2015, https://pfnyc.org/wp-content/uploads/2015/06/2015-06-world-financial-capital.pdf.
[65] Office of the New York State Comptroller, “2020 Financial Condition Report,” Economic and Demographic Trends, https://www.osc.state.ny.us/reports/finance/2020-fcr/economic-and-demographic-trends.
[66] Susan Arbetter, “A Return of the Stock Transfer Tax: Are There Unintended Consequences?” Spectrum News, Aug. 13, 2020, https://spectrumlocalnews.com/nys/central-ny/politics/2020/08/05/the-return-of-the-stock-transfer-tax–nightmare-or-easy-money-.
[67] Office of the New York City Comptroller, “NYC Quarterly Economic Update Q4 2019,” Mar. 6, 2020, https://comptroller.nyc.gov/reports/new-york-city-quarterly-economic-update/.
[68] Colin Miller and Anna Tyger, “The Impact of a Financial Transaction Tax,” Tax Foundation, Jan. 23, 2020, https://taxfoundation.org/financial-transaction-tax/.
[69] Thornton Matheson, “Taxing Financial Transactions: Issues and Evidence,” IMF Working Paper, March 2011, https://www.imf.org/external/pubs/ft/wp/2011/wp1154.pdf.
[70] Daniel Waldenström, “Why are securities transactions taxed? Evidence from Sweden, 1909-1991,” Financial History Review 9:2 (October 2002).
[71] Thornton Matheson, “Taxing Financial Transactions: Issues and Evidence,” 36-38.
[72] Not counting small taxes and transfer fees intended to finance the U.S. Securities and Exchange Commission.
[73] New York State Department of Taxation and Finance, “Stock Transfer Tax – Rebate Program,” TSB-M-82 6(M), July 9, 1982, https://www.tax.ny.gov/pdf/memos/stock_transfer/m82_6m.pdf.
[74] Phil Steck, “New York State Assembly Memorandum in Support of Legislation, A.7791,” https://nyassembly.gov/leg/?default_fld=&leg_video=&bn=A07791&term=0&Summary=Y&Memo=Y.
[75] New York Department of Taxation and Finance, “Fiscal Year Tax Collections: 2019-2020,” https://www.tax.ny.gov/research/collections/fy_collections_stat_report/2019_2020_annual_statistical_report_of_ny_state_tax_collections.htm.
[76] Jonathan A. Schwabish, “Estimating Employer Spillover Effects in New York City with an Application to the Stock Transfer Tax,” Public Finance Review 33:6 (Nov. 1, 2005), https://citeseerx.ist.psu.edu/viewdoc/download?doi=10.1.1.948.7479&rep=rep1&type=pdf.
[77] Shing-yang Hu, “The Effects of the Stock Transaction Tax on the Stock Market—Experience from Asian Markets,” Pacific Basin Finance Journal 6 (August 1988).
[78] New York City Independent Budget Office, “Reviving the New York Stock Transfer Tax: Revenues and Risks,” Background Paper, November 2003, 6, https://ibo.nyc.ny.us/iboreports/stocktransfertax.pdf.
[79] Partnership for New York City, “Return to Office Survey Results Released – October.”
[80] Jared Walczak, “Recapture Provisions Still Hide in State Income Tax Codes,” State Tax Notes, Apr. 22, 2019, https://www.taxnotes.com/tax-notes-state/tax-reform/recapture-provisions-still-hide-state-income-tax-codes/2019/04/22/29bqj.
[81] N.Y. Tax Law § 601.
[82] Ashlea Ebeling, “New York’s ‘Temporary’ Millionaire Tax Extended 5 More Years,” Forbes, Apr. 9, 2019, https://www.forbes.com/sites/ashleaebeling/2019/04/09/new-yorks-temporary-millionaire-tax-extended-5-more-years.
[83] New York Division of the Budget, “FY 2021 Economic and Revenue Outlook,” https://www.budget.ny.gov/pubs/archive/fy21/exec/ero/fy21ero.pdf, 2020, 83.
[84] Internal Revenue Service data; Tax Foundation calculations.
[85] E.J. McMahon, “Where Are New Yorkers Headed?” Empire Center, Jan. 1, 2020, https://www.empirecenter.org/publications/wherearenewyorkersgoing/.
[86] Jens Arnold, “Do tax structures affect aggregate economic growth? Empirical evidence from a panel of OECD countries,” OECD Economics Department Working Papers No. 643 (2008).
[87] Karel Mertens and Morten Ravn, “The dynamic effects of personal and corporate income tax changes in the United States,” American Economic Review 103:4 (June 2013).
[88] Xavier Giroud and Joshua Rauh, “State Taxation and the Reallocation of Business Activity: Evidence from Establishment-Level Data,” Journal of Political Economy 127:3 (2019).
[89] Internal Revenue Service, Statistics of Income, “Individual Income and Tax Data, by State and Size of Adjusted Gross Income, Tax Year 2018,” https://www.irs.gov/statistics/soi-tax-stats-individual-income-tax-return-form-1040-statistics.
[90] Katherine Loughead, “State Individual Income Tax Rates and Brackets for 2020,” Tax Foundation, Feb. 4, 2020, https://taxfoundation.org/state-individual-income-tax-rates-and-brackets-for-2020/.
[91] Jared Walczak, “Local Income Taxes in 2019,” Tax Foundation, July 30, 2019, https://taxfoundation.org/local-income-taxes-2019/.
[92] New York Office of the Governor, “Statement from New York State Budget Director Robert Mujica,” Sept. 17, 2020, https://www.governor.ny.gov/news/statement-new-york-state-budget-director-robert-mujica.
[93] Andrew Lai, Roger Cohen, and Charles Steindel, “The Effects of Marginal Tax Rates on Interstate Migration in the U.S.,” New Jersey Department of the Treasury, October 2011, https://www.state.nj.us/treasury/news/2011/OCE-Migration%20Study.pdf.
[94] John Havens, “Migration of Wealth in New Jersey and the Impact on Wealth and Philanthropy,” Center on Wealth and Philanthropy, Boston College, Jan. 22, 2010, https://www.bc.edu/content/dam/files/research_sites/cwp/pdf/njreport.pdf
[95] Id.
[96] Jared Walczak, “Gov. Hogan Vetoes Maryland Digital Advertising Tax Legislation,” Tax Foundation, May 7, 2020, https://taxfoundation.org/governor-hogan-vetoes-maryland-digital-advertising-tax-legislation/.
[97] See, e.g., Eric Adams and Andrew Gounardes, “A Tax on Data Could Fix New York’s Budget” (opinion), The Wall Street Journal, June 1, 2020, https://www.wsj.com/articles/a-tax-on-data-could-fix-new-yorks-budget-11591053159.
[98] James Vincent, “Apple, Google, and Amazon Respond to European Tech Taxes by Passing on Costs,” The Verge, Sept. 2, 2020, https://www.theverge.com/2020/9/2/21418114/european-uk-digital-tax-services-apple-google-amazon-raise-prices.
[99] Julien Pellefigue, “The French Digital Service Tax: An Economic Impact Assessment,” Deloitte/Taj, Mar. 22, 2019, https://taj-strategie.fr/content/uploads/2020/03/dst-impact-assessment-march-2019.pdf.
[100] See Westinghouse Elec. Corp. v. Tully, 466 US 388 (1984).
[101] See Hughes v. Oklahoma, 441 U.S. 322 (1979) and Bacchus Imports Ltd. v. Dias, 468 US 363 (1984).
[102] For a more detailed accounting with additional analysis regarding the virtually identical Maryland legislation, see Jared Walczak, “Worse Than Advertised: The Legal and Economic Pitfalls of Maryland’s Digital Advertising Tax,” Tax Foundation, Mar. 16, 2020, https://taxfoundation.org/maryland-digital-advertising-tax/.
[103] Complete Auto Transit, Inc. v. Brady, 430 U.S. 274 (1977).
[104] Japan Lines Ltd. v. County of Los Angeles, 441 U.S. 434 (1979).
[105] Ruth Mason, “Maryland’s Proposed Digital Tax May Be Unconstitutional,” Medium.com, Jan. 30, 2020, https://medium.com/@ProfRuthMason/marylands-proposed-digital-tax-may-be-unconstitutional-9be58831315b.
[106] Eversheds Sutherland, “Legal Alert: Maryland State Senate’s Budget and Taxation Committee Hears Testimony on Proposed Digital Advertising Tax,” Jan 30, 2020, https://us.eversheds-sutherland.com/NewsCommentary/Legal-Alerts/228356/Legal-Alert-Maryland-State-Senates-Budget-and-Taxation-Committee-Hears-Testimony-on-Proposed-Digital-Advertising-Tax.
[107] Eric Adams and Andrew Gounardes, “A Tax on Data Could Fix New York’s Budget.”
[108] Proponents characterized the tax as being able to “fix” what they described as a $20 billion budget hole, which is three times what the state raised in all business taxes combined in FY 2020 and over 40 times what the entire United Kingdom—with an economy twice the size of New York’s—anticipates raising from its new digital services tax. Coming anywhere close to such a figure is wildly implausible, and if the state could essentially quadruple its business taxes in this way, the tax would prove economically ruinous.
[109] Federation of Tax Administrators, “FTA 2017 Services Taxation Survey,” https://www.statetaxissues.org/services/2017/.
[110] Gail Cole, “State-by-State Guide to the Taxability of Digital Products,” Avalara, Feb. 20, 2019, https://www.avalara.com/us/en/blog/2019/02/state-by-state-guide-to-digital-products-and-sales-tax.html.
[111] Janelle Cammenga, “State and Local Sales Tax Rates, Midyear 2020,” Tax Foundation, July 8, 2020, https://taxfoundation.org/state-and-local-sales-tax-rates-2020/.
[112] New York Department of Taxation and Finance, “Monthly Tax Collections: Fiscal Year 2018-2019,” https://www.tax.ny.gov/research/collections/fy18_19_monthly_tax_collections.htm (multiple months); U.S. Bureau of Economic Analysis, “Personal Consumption Expenditures by Major Type of Product,” Oct. 29, 2020, https://apps.bea.gov/iTable/iTable.cfm?reqid=19&step=3&isuri=1&nipa_table_list=65&categories=survey.
[113] Calculation by Prof. John Mikesell, Indiana University.
[114] John Due, qtd., John Mikesell, “A Quality Index for State Sales Tax Structure-Measuring the States Against an Ideal Standard,” State Tax Notes, Jan. 10, 2005.
[115] Steven M. Sheffrin and Anna L. Johnson, “Rethinking the Sales Tax Food Exclusion with SNAP Benefits,” State Tax Notes, Jan. 11, 2016, 157, https://pdfs.semanticscholar.org/6f18/cca38dfaa9591be264e4bff539573dae6d7c.pdf.
[116] E.J. McMahon, “FY2021 New York State Budget – Taxes,” Empire Center, Feb. 13, 2020, https://www.empirecenter.org/publications/testimony-fy2021-new-york-state-budget-taxes/.
[117] Kate Taylor, “For Some New York Shoppers, No More State Sales Tax,” New York Times, Apr. 1, 2012, https://www.nytimes.com/2012/04/02/nyregion/new-york-state-reinstates-sales-tax-exemption-for-clothing-and-footwear.html.
[118] New York S.44 (2020).
[119] Erik Engquist, “Pied-à-terre tax moves forward in Albany,” TheRealDeal.com, Aug. 18, 2020, https://therealdeal.com/2020/08/18/pied-a-terre-tax-moves-forward-in-albany/.
[120] Michael Suher, “Is Anybody Home? The Impact and Taxation of Non-Resident Buyers,” Furman Center for Real Estate and Urban Policy, February 2016, https://irecanati.tau.ac.il/sites/nihul.tau.ac.il/files/media_server/Recanati/management/elrov/Conf_Housing/Suher-TAU%20paper%20(1).pdf.
[121] Erik Johnson and Randall Walsh, “The Effect of Property Taxes on Vacation Home Growth Rates: Evidence from Michigan,” Regional Science and Urban Economics 43 (2013), http://randallwalsh.com/wp-content/uploads/2017/08/The-Effect-of-Property-Taxes-on-Vacation-Home-Growth-Rates.pdf.
[122] Nathan B. Anderson, “Beggar Thy Neighbor? Property Taxation of Vacation Homes,” National Tax Journal 59:4 (December 2006), https://www.jstor.org/stable/41790357.
[123] New York Office of the Governor, “FY 2021 Executive Budget,” https://www.governor.ny.gov/sites/governor.ny.gov/files/atoms/files/FY2021BudgetBook.pdf.
[124] New York S.1527 (2020).
[125] Ulrik Boesen, “New York’s Road to Legalized Marijuana,” Tax Foundation, Mar. 23, 2020, https://taxfoundation.org/new-york-legalize-marijuana/.
[126] Colorado Department of Revenue, “Current & Prior Retail Marijuana Average Market Rates (Median Market Prices),” October 2020, https://www.colorado.gov/pacific/sites/default/files/AMR_PriorRates_Oct2020.pdf.
[127] For a lengthier discussion of marijuana excise tax design, see Ulrik Boesen, “A Road Map to Recreational Marijuana Taxation,” Tax Foundation, June 9, 2020, https://taxfoundation.org/recreational-marijuana-tax/.
[128] Katie Shepherd, “‘It’s a lot happening all at once’: Illinois shops run out of marijuana just six days after start of legalization,” The Washington Post, Jan. 7, 2020, https://www.washingtonpost.com/nation/2020/01/07/illinois-runs-out-recreational-marijuana-first-week-legalized/.
[129] New York Department of Health, “The New York State Medical Marijuana Program,” https://health.ny.gov/regulations/medical_marijuana/.
[130] Katie Shepherd, “‘It’s a lot happening all at once’: Illinois shops run out of marijuana just six days after start of legalization.”
[131] Ulrik Boesen, “Sports Betting Will Not Solve State Budget Crises,” Tax Foundation, June 10, 2020, https://taxfoundation.org/sports-betting-will-not-solve-state-budget-crises/.
[132] American Gaming Association, “Americans to Wager More than $4.6 Billion Illegally on Super Bowl,” Jan. 30, 2018, https://www.americangaming.org/new/americans-to-wager-more-than-4-6-billion-illegally-on-super-bowl-52/.
[133] Empire State Development, “Governor Cuomo and Legislature Extend NYS Film Tax Credit Program Through 2022,” Apr. 11, 2017, https://esd.ny.gov/esd-media-center/press-releases/governor-cuomo-and-legislature-extend-nys-film-tax-credit-program.
[134] U.S. Bureau of Labor Statistics, “Employed and Office of Employment and Unemployment Statistics,” 2020.
[135] New York Department of Labor, “Employment by Industry,” https://labor.ny.gov/stats/cesemp.asp.
[136] New York Division of the Budget, “FY 2020 Annual Report on New York State Tax Expenditures,” https://www.budget.ny.gov/pubs/archive/fy20/exec/ter/fy20ter.pdf (and other years).
[137] Jared Walczak, “Testimony on Film Tax Incentives before the Florida Senate Appropriations Committee,” Tax Foundation, Apr. 27, 2015, https://taxfoundation.org/testimony-film-tax-incentives-florida-senate-appropriations-committee.
[138] Michael Gormley, “Let the credits roll? Cuomo wants to extend film/TV tax break,” Newsday, Feb. 2, 2020, https://www.newsday.com/news/region-state/cuomo-tax-credit-film-television-1.41284944.
[139] Chris O’Falt, “Cuomo Suggests Ending New York Film Tax Incentives in Response to Failed Amazon Deal,” IndieWire, Mar. 21, 2019, https://www.indiewire.com/2019/03/governor-cuomo-threatens-new-york-film-tax-incentive-amazon-1202052563/.
[140] New York Division of the Budget, “FY 2020 Annual Report on New York State Tax Expenditures,” 138, 155.
[141] N.Y. Tax Law § 31.
[142] See Timothy J. Bartik, Making Sense of Incentives: Taming Business Incentives to Promote Prosperity (Kalamazoo, MI: W.E. Upjohn Institute for Employment Research, 2019); Alan Peters and Peter Fisher, “The Failures of Economic Development Incentives,” Journal of the American Planning Association 70:1 (Winter 2004), 27; and William F. Fox and Matthew N. Murray, “Do Economic Effects Justify the Use of Fiscal Incentives?” Southern Economic Journal 71:1 (July 2004), 78.
[143] Jared Walczak, “Tax Changes in California Governor’s Budget Could Stand in the Way of Economic Recovery,” Tax Foundation, May 20, 2020, https://taxfoundation.org/gavin-newsom-california-budget-economic-recovery/.
Share this article