Key Findings
- Connecticut’s property taxA property tax is primarily levied on immovable property like land and buildings, as well as on tangible personal property that is movable, like vehicles and equipment. Property taxes are the single largest source of state and local revenue in the U.S. and help fund schools, roads, police, and other services. burdens are rising rapidly, with the state’s effective property taxA tax is a mandatory payment or charge collected by local, state, and national governments from individuals or businesses to cover the costs of general government services, goods, and activities. rates on owner-occupied housing now among the highest in the country at 1.7 percent of housing value.
- Property tax burdens in Connecticut continue to increase even as property values decline, whereas other states—including neighboring Massachusetts and New York—have managed to keep the growth of property tax burdens in check.
- Connecticut possesses no meaningful property tax limitation regime, making it an outlier among states, while Massachusetts and New York both impose effective limitation regimes that are considered models for other states.
- There are three types of property tax limitations—assessment limits, rate limits, and levy limits—with the latter combining the greatest effectiveness with the fewest unintended consequences.
- Property tax limitations typically allow for some rate of growth and usually feature override provisions under which voters can approve growth outside the cap when additional flexibility is needed.
- Massachusetts and New York provide a valuable blueprint for Connecticut policymakers concerned with reversing the outflow of residents and making Connecticut a more attractive place to live and work.
Introduction
When Connecticut policymakers adopted an individual income taxAn individual income tax (or personal income tax) is levied on the wages, salaries, investments, or other forms of income an individual or household earns. The U.S. imposes a progressive income tax where rates increase with income. The Federal Income Tax was established in 1913 with the ratification of the 16th Amendment. Though barely 100 years old, individual income taxes are the largest source of tax revenue in the U.S. in 1991, many hoped that it would take pressure off state sales taxes and local property taxes. Sales tax rates, hiked in the preceding years, came down—but the Nutmeg State’s property taxes remain among the highest in the country. As a percentage of housing value, Connecticut homeowners now pay 20 percent more than New Yorkers and almost 50 percent more than their Massachusetts peers. Those two neighboring states once had property tax burdens on par with Connecticut’s, but after more than eight years under a property tax limitation regime in New York and four decades in Massachusetts, the states’ respective property tax systems have diverged sharply.
Property tax limitations exist in some form in 46 states, but they vary in design or efficacy. Although they differ in some particulars, both the Massachusetts and New York laws are often cited as models for other states. This paper explores whether the example of two neighboring states can be salutary for Connecticut, reviewing the case for property tax limitations, evaluating potential concerns, considering different designs for such a system, and suggesting some best practices should Connecticut seek to join the ranks of those providing taxpayers with some measure of relief from rising local property tax burdens.
Property Tax Trends in Connecticut
Property taxes—on both residential and commercial real property as well as vehicles, machinery, and equipment—are the only local tax of consequence in Connecticut, responsible for 98.5 percent of local tax collections and over half of all local revenues, including transfers from state government.[1] While property taxes are the predominant source of local tax revenue nationwide, this overwhelming reliance is unique to New England,[2] where property taxes generate 96.9 percent of local tax collections, compared to 70.6 percent in the remaining 44 states and the District of Columbia.[3]
In recent decades, property tax rates and collections have risen substantially, if inconsistently. The median town millage rate in fiscal year 1991 was 22.8 mills. By 2000, despite the adoption of an income tax, it had risen to 27.9 mills before dipping to 24.2 mills in 2010. As of FY 2020, it had reached new heights with a median millage rate of 29.4, representing a 29 percent rate increase since the income tax was imposed.[4]
Several of Connecticut’s larger jurisdictions saw millage rates decline around 2000, but they have begun growing again, with rates climbing by 51 percent in Stamford, 44 percent in Waterbury, and 36 percent in Bridgeport over the past decade. Millages in Hartford and New Haven, which lacked those turn-of-then-century adjustments, were essentially flat, but this followed sharp increases in the prior decade, with Hartford’s rate now 55 percent higher than it was in FY 2000, and New Haven’s up 23 percent.[5]
Over the 20 most recent years for which collections data are available (1998-2017), Connecticut property tax collections rose 43 percent in real (inflationInflation is when the general price of goods and services increases across the economy, reducing the purchasing power of a currency and the value of certain assets. The same paycheck covers less goods, services, and bills. It is sometimes referred to as a “hidden tax,” as it leaves taxpayers less well-off due to higher costs and “bracket creep,” while increasing the government’s spending power. -adjusted) terms, which is not itself unusual. In fact, it is somewhat lower than the increase in collections in neighboring states like Massachusetts and New York and trails the national average. The first inkling that something is amiss, however, is that this represents a 4.4 percentage-point increase in the share of state and local tax revenues generated by the property tax in Connecticut, more than twice the national average (2.1 percentage points).[6]
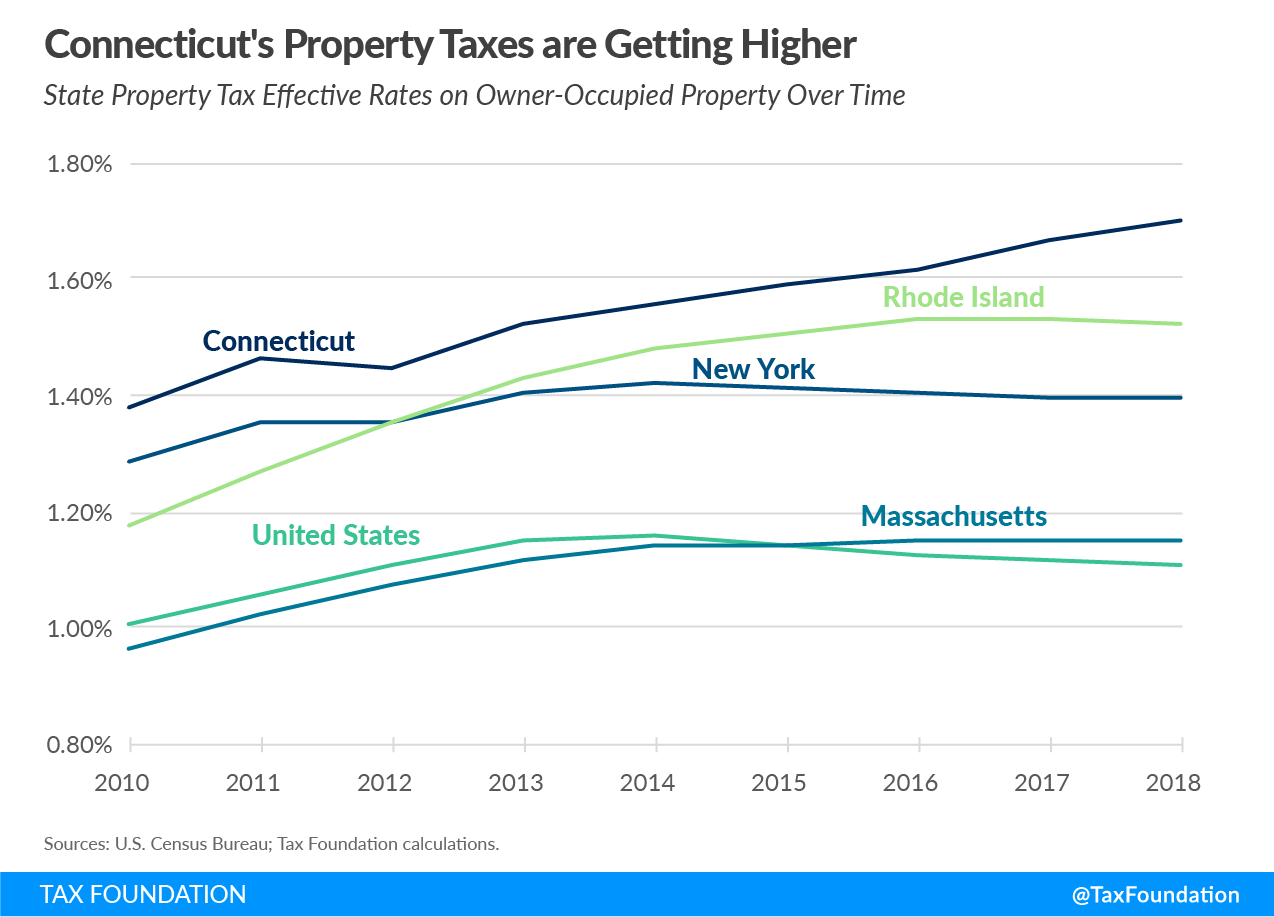
Since 2010, housing value is up 10.1 percent nationwide. Owner-occupied housing increased in value by 15.8 percent in New York and 10.4 percent in Massachusetts. By contrast, it declined by 3.9 percent in Connecticut over the same period.[7] The issue, then, is not that tax collections rose, either in nominal or real terms, over the period; they rose almost everywhere. Rather, the problem is that Connecticut’s property taxes rose even as property values were eroding. Nationally, taxes were up 21 percent in nominal terms over those years, but values also rose by 10 percent. In Connecticut, taxes were up 19 percent while values declined. By FY 2018, Connecticut homeowners paid an effective rate of 1.70 percent on the fair market value of their property, compared to 1.11 percent nationwide and 1.15, 1.40, and 1.53 percent respectively in Massachusetts, New York, and Rhode Island.
Connecticut residents have good reason to be frustrated. It is one thing to see property tax burdens rise, another to see them rise faster than property values, and quite another altogether for property tax collections to rise even as statewide property values are in decline. It is little wonder that property tax limitations would have an appeal, especially given the examples offered by nearby New York and Massachusetts, where property tax limitations have demonstrated considerable success in constraining the rate of growth in property taxes.
Connecticut’s Economic Challenges
Connecticut has the highest per capita income of any state at $79,087 per person, compared to a national average of $56,663.[8] It also has the second-highest per capita tax collections of any state, at $7,733, exceeded only by New York ($9,073), and comes in significantly higher than the U.S. average ($5,083).[9] Superficially, these seem like indicators of economic flourishing. Certainly, they are signifiers of wealth. Increasingly, however, it is a wealth that is in decline and an economy in stagnation, which is part of the reason why property taxes have become so burdensome. These taxes are increasingly paying for services calibrated for an economy and tax base that no longer exist.
Connecticut is losing population, the Hartford Business Journal reported in late 2019, “but not to the states you’d think.” Florida is, of course, at the top of the list, and the epitome of the state that you would expect. But rounding out the top five for outmigration were New York, Massachusetts, South Carolina, and California—not, with the exception of South Carolina, a list of low-tax locales. As the paper’s editors noted, Connecticut has seen net outmigration for nine consecutive years, losing 163,373 residents between 2010 and 2018.[10]
Others have taken notice as well. In 2017, The Atlantic asked, “What on Earth Is Wrong with Connecticut?”[11] At Slate, it was “Something has gone wrong with Connecticut,” or, in later versions of the story, “Trouble in America’s Country Club.”[12] The Hartford Courant is keeping tabs on the number of billionaires leaving the state.[13] Business journals are fretting about sustained outmigration. Even the state itself is getting into the act, producing a 2017 study on population and migration trends.[14]
As we have noted in previous analyses, moreover,[15] and as everyone in Connecticut is all too aware, the migration is not limited to people. Major Connecticut-based corporations are decamping to other states, reducing their in-state footprint, or being acquired by out-of-state firms, including, most recently, the merger of the Massachusetts-based Raytheon Company with the Connecticut-based United Technologies, with the new company to be headquartered in the Boston area.[16]
Here too, relocations are not primarily to the Sun Belt, but toward places like New York City, Boston, and Chicago. Taxes played an important role in many of these relocations, but clearly many of the departing companies were looking for something other than the lowest possible tax burden.
Connecticut benefits from a strong manufacturing base and an educated workforce. Its geography is advantageous for multinational firms which require an East Coast presence but not a big city headquarters. For many years, it has proven an attractive alternative to New York City and Boston. Increasingly, however, the state is struggling.
High (and rising) tax burdens have contributed to stagnation. So has the revitalization of major urban centers. So, too, have broader economic and demographic trends, greater mobility, and a shift in the entrepreneurial center of gravity in the country. Younger workers increasingly want to move back into the cities their parents and grandparents abandoned for the suburbs, though there is the potential for a reversal as telework increases in popularity in the aftermath of the COVID-19 crisis. In the midst of all this churn, Connecticut finds itself increasingly left behind—still wealthy, but increasingly the declining country club of the Slate article rather than a vibrant place to live and work.
Connecticut can address some of these problems, but not all. Revisions to the tax code cannot solve every problem. But it can help, for both those who have remained and those whom the state wishes to attract. Given recent trends, the continued upward trajectory of property tax burdens leaves a bitter taste for many residents.
Connecticut’s History with Property Tax Limitations
Connecticut is in a small minority in offering no uniform statewide property tax limitations, though a since-repealed optional levy limit persists in revised form in Hartford. Additionally, municipalities may, at their discretion, phase in assessment increases over a period of several years, which is generally counted as an assessment limit, albeit a very modest one. Neither program ultimately places downward pressure on property tax burdens.
The former experiment with a tax cap, only ever taken up by Hartford, bore little resemblance to limitation regimes in other states. Under the program, owner-occupied housing received a credit in the amount by which the property tax burden exceeded 1.5 percent of the property’s fair market value, with the credit paid for by imposing a surcharge on all properties other than owner-occupied residential housing.[17] A study conducted by the Connecticut Center for Economic Analysis at the University of Connecticut concluded that the cap/surcharge system, which shifted tax burdens to commercial properties and larger multi-unit housing (including apartments), introduced economic distortions and damaged the city’s economy.[18] When the provision was repealed, Hartford replaced it with a split roll system whereby residential property faces a lower assessment ratio (currently 32.21 percent) than apartment buildings or commercial property (set at 70 percent), meaning that nonresidential property experiences more than twice the residential effective rate on its fair market value.[19]
State law also grants towns the option of phasing in any assessment increase over a period of up to five years to cushion the blow of higher property tax burdens due to reassessment,[20] but ultimately this delays, not limits, any increase. Similarly, it is only a constraint on increased property tax burdens through rising assessments. Should a municipality seek greater revenue, it would be free to raise millage rates without any phase-in, and municipalities are not required to permit—or maintain previously adopted—phased-in assessments, which are fully at the discretion of local governments.
Neither the formerly available tax cap nor the local option to phase in assessment increases provides meaningful or sustained relief. Although both programs have been viewed as property tax limitations, they differ markedly from provisions adopted in other states.
Property Tax Limitations Across the Country
Outside Connecticut, 45 states and the District of Columbia have implemented some form of property tax limitation regime. Some of these strictly regulate property tax revenues while others, like Connecticut’s efforts, impose no meaningful constraints. Broadly speaking, these limitations can be divided into three types: assessment limits, rate limits, and levy (collections) limits, each with a different set of goals and outcomes. Often states adopt more than one type of property tax limitation, or devise hybrid limitations which incorporate elements of two or more of these types.[21]
The purpose of assessment limitations is to constrain tax increases arising from rising home values rather than conscious rate hikes.[22] While property owners may be wealthier on paper due to the appreciation of their property value, their income flows and ability to pay higher taxes may not have risen proportionally. Assessment limits seek to cushion the blow, limiting the amount by which rising property values can increase exposure to taxation. They do this in a variety of ways, such as by freezing or rolling back assessment increases, or, more commonly, by setting a cap on the maximum rate of assessment growth per year.
Conversely, rate limits are intended to restrict consciously adopted tax increases, limiting the authority of local government officials to adopt a tax increase. They may cap the amount of a rate increase in a given year, establish a maximum allowable rate, require voter authorization to raise taxes, or even freeze rates outright. Under rate caps, collections can rise unimpeded if property values grow or if new construction is added to the property tax rolls, but policymakers are constrained in their ability to increase millages on those properties.
Finally, levy limits, also called revenue or collection limits, are concerned with the actual amount of revenue raised, imposing rollbacks or obligating rate reductions to ensure that collections do not increase in aggregate above a given amount. Individual owners may experience an increase or decrease in tax liability based on changes in rate or assessed value, but aggregate collections are constrained. Whereas assessment limitations only allow a tax increase (above a given threshold) based on intentional policy action (a rate increase) and rate limitations only permit them when driven by rising housing values, a levy limit permits greater variation but all within the context of a hard revenue limit.
Eighteen states and the District of Columbia have adopted assessment limitations, including the uniquely weak one adopted by Connecticut, which only provides a local option for the phasing in of higher assessments and does not cap them outright. Thirty-five states and D.C. impose rate limits, some of which make any rate increases extremely difficult, while others are so lax as to be almost completely ineffectual. Finally, 34 states and D.C. have levy limits, again varying in their effectiveness.[23]
All told, eight states and the federal district offer all three types of limitations in some form, 25 states offer two, and 13 offer limitations in only one form, leaving just four states—Hawaii, New Hampshire, Tennessee, and Vermont—without any property tax limitations on the books. With its minimalist approach, Connecticut is very nearly among their number.
| State | Assessment | Rate | Levy |
|---|---|---|---|
|
Alabama |
✓ | ✓ | |
|
Alaska |
✓ | ✓ | |
|
Arizona |
✓ | ✓ | ✓ |
|
Arkansas |
✓ | ✓ | ✓ |
|
California |
✓ | ✓ | |
|
Colorado |
✓ | ✓ | ✓ |
|
Connecticut |
✓ | ||
|
Delaware |
✓ | ✓ | |
|
Florida |
✓ | ✓ | |
|
Georgia |
✓ | ✓ | |
|
Hawaii |
|||
|
Idaho |
✓ | ✓ | |
|
Illinois |
✓ | ✓ | ✓ |
|
Indiana |
✓ | ✓ | |
|
Iowa |
✓ | ✓ | |
|
Kansas |
✓ | ||
|
Kentucky |
✓ | ||
|
Louisiana |
✓ | ✓ | |
|
Maine |
✓ | ||
|
Maryland |
✓ | ||
|
Massachusetts |
✓ | ✓ | |
|
Michigan |
✓ | ✓ | ✓ |
|
Minnesota |
✓ | ||
|
Mississippi |
✓ | ||
|
Missouri |
✓ | ✓ | |
|
Montana |
✓ | ✓ | ✓ |
|
Nebraska |
✓ | ✓ | |
|
Nevada |
✓ | ✓ | |
|
New Hampshire |
|||
|
New Jersey |
✓ | ||
|
New Mexico |
✓ | ✓ | ✓ |
|
New York |
✓ | ✓ | |
|
North Carolina |
✓ | ||
|
North Dakota |
✓ | ✓ | |
|
Ohio |
✓ | ✓ | |
|
Oklahoma |
✓ | ✓ | |
|
Oregon |
✓ | ✓ | |
|
Pennsylvania |
✓ | ✓ | |
|
Rhode Island |
✓ | ||
|
South Carolina |
✓ | ✓ | |
|
South Dakota |
✓ | ✓ | |
|
Tennessee |
|||
|
Texas |
✓ | ✓ | ✓ |
|
Utah |
✓ | ✓ | |
|
Vermont |
|||
|
Virginia |
✓ | ||
|
Washington |
✓ | ✓ | |
|
West Virginia |
✓ | ✓ | |
|
Wisconsin |
✓ | ||
|
Wyoming |
✓ | ||
|
District of Columbia |
✓ | ✓ | ✓ |
|
Source: Lincoln Institute of Land Policy, “Significant Features of the Property Tax.®” |
|||
Considerations for Designing Property Tax Limitations
All property tax limitations are not the same. They differ in their efficacy, but also in what they set out to accomplish. Connecticut lawmakers must grapple with whether to put limits on local government authority or revenue potential, though in not acting, they must also come to terms with the impact of rising property taxes at time when Connecticut property values are declining and the state’s population is dwindling. More than just these revenue questions, though, they must also consider the consequences—intended and unintended—of each type of property tax limitation regime.
Rate limits are a policy constraint while levy limits are a revenue constraint, but the two are closely related and can be seen as different approaches to the same issue. Assessment limits, by contrast, introduce a significant amount of social engineering into the tax code, and they do so on autopilot.
The Unintended Consequences of Assessment Limits
Assessment limitations favor incumbent property owners at the expense of the next generation of homeowners, and, under some designs, preserve intergenerational wealth at significant cost to families just now climbing the income ladder. At their best, they can be understood as helping to prevent Grandma from being priced out of the home she has lived in for decades; at their worst, they make it significantly harder for a young family to ever get that home. It is worth stepping back, therefore, to see how each approach works.
Assessment limits recognize an inherent challenge in the taxation of property, a relatively illiquid asset: although taxes rise with changes in the value of the property, any increases in that value (particularly for residential property) are unlikely to be realized when taxes come due, and may never be realized. From the homeowner’s perspective, the gains are only on paper, and could be entirely phantom gains if they have dissipated by the time the property is sold. In the interim, however, the owner may have made years of property tax payments based on a higher assessed value.
This can be particularly important for senior citizens who sometimes see the value of their homes soar in retirement, when they are on fixed incomes. They do, of course, have the option of selling their home to cash out these gains, but this can be an unattractive and often difficult option for many homeowners. Assessment limits try to keep homeowners’ tax burdens more predictable by imposing a constraint in the rate of growth of assessed value, typically stipulating that annual increases cannot exceed a given percentage (sometimes specified as a certain amount above inflation).
These limitations vary in if and when assessed value “resets.” This most often happens upon the sale of the property but may also be triggered by new construction by the current owner, while in some cases, property values never fully reset. Each approach creates its own set of incentives, most of them bad. Because long periods of home ownership can offer extremely attractive property tax burdens, these provisions create a “lock-in effect” where homeowners have a disincentive to relocate, while an ever increasing share of the overall property tax burden falls on new properties, often purchased by younger and lower-income individuals.
Assessment limits may also harm these classes of homeowners or would-be homeowners in a more subtle way. Over the course of their lives, people frequently upgrade to larger and more expensive homes as they gain additional financial security, in the process selling their old, more affordable homes. When the lock-in effect keeps such individuals in their more modest homes longer, this decreases the stock of starter homes and other more affordable housing on the market, to the detriment of those with fewer financial resources.[24] At the same time, favorable assessments may dissuade empty-nester retirees from downsizing, locking up larger housing that may be a better match for a growing family. Assessment limits, therefore, interfere with the efficient allocation of housing.
Assessment limits are also why two nearly identical houses, right across the street from each other, can face radically different property tax burdens. And over time, inequities due to assessment limits can become extreme. New York City has its own property tax limitation regime, separate from the state’s, with caps on annual growth in assessed value. According to a 2017 analysis by the Lincoln Institute of Land Policy and the Minnesota Center for Fiscal Excellence, in New York City, a newly purchased median-value home faces a 57 percent higher property tax bill than a house of identical value owned for the average duration of ownership in the city.[25] When the city’s Independent Budget Office reviewed the system in 2018, it concluded that nearly 500,000 of the more than 700,000 Class 1 properties (mostly one- to three-family homes) would pay less under a system that raised the same amount in the absence of the assessment limit.[26]
A well-designed tax limitation regime keeps taxes in check across the board, but frequently the result of an assessment limit is merely to shift the tax burden from one class of homeowners to another. These consequences, which often run counter to the purported goals of property tax limitations, are why many states have instead adopted more targeted approaches to protecting lower-income homeowners from sharply increasing tax burdens, like “circuit breakers” under which states provide offsets for those meeting certain economic qualifications, in lieu of providing assessment limits for all homeowners.
The Limited Efficacy of Rate Limits
On the surface, rate limits appear to serve as the most direct constraint on property tax growth, limiting local elected officials’ ability to raise taxes. In practice, however, the effectiveness of rate limits can vary considerably, and they sometimes provide incentives for policymakers to adopt less efficient or equitable approaches to revenue raising through the property tax.
Rate limits either impose a cap on total property tax millages or on their rate of increase. Often a rate limitation can be overcome by voter approval of a ballot override measure, but more importantly, it is often possible to increase revenue under a rate cap by adjusting property tax exemptions or abatements or by the far less transparent process of raising assessments. When a uniform rate limit is imposed statewide, moreover, it can create disparities where communities with modest tax bases have little fiscal capacity while those with much more valuable properties are able to generate considerable tax revenue.
When assessed values rise, rate limits do nothing to limit the increase in tax collections, and conversely, when assessed values fall, they may force a locality to accept lower revenues. In each case, a budget question is raised: just because properties have appreciated in value does not mean that the cost of government services has risen, and similarly, just because they decline in value does not mean that those costs have fallen, though in the latter case, it may be appropriate for governments to seek to tighten their belts.
Rate limitations are more neutral than assessment limits, lacking a lock-in effect or other perverse incentives. They are, however, inferior to another form of property tax limit, the variety that exists in both Massachusetts and New York: levy limits.
The Advantages of Levy Limits in Constraining Property Tax Growth
Unlike rate caps, levy limits impose a hard constraint on revenue growth, providing the revenue effect of imposing both a rate and an assessment limit in concert but without the inequities and distortions associated with assessment limits.[27] The typical levy limit restricts increases in property tax collections to a certain amount or prohibits them from rising above a specified level. It allows individual property values to fluctuate with the market and does not directly ban millage rate increases. Whereas assessment limits and rate limits largely focus on inputs, a levy limit is tied to outcomes: it keeps overall tax collections in check and rolls back tax burdens when revenues would otherwise come in above the limit.
Some states have a fixed-percentage growth cap, while other states tie the cap to the rate of inflation, and still others use the lesser of a statutorily specified growth cap or the rate of inflation. A few states, like Massachusetts, impose an absolute ceiling on collections either in lieu of or in addition to limits on annual increases. New construction and improvements are frequently, but not invariably, exempted. In most cases, local voters are empowered to override the levy limit at the ballot box.[28]
Like rate limits and unlike assessment limits, levy caps do not necessarily protect all taxpayers individually from substantial tax increases. Policymakers remain free to adjust rates and assessment ratios within the overall revenue cap, and if only certain properties or classes of properties appreciate in value substantially, the owners of those properties may experience tax increases considerably in excess of any limitation on the increase in levies as a whole. But they avoid picking winners and losers, avoid creating perverse incentives, and impose an effective constraint on the growth of property taxes.
Limitation Regimes Among Connecticut’s Neighbors
Boasting one of the nation’s earlier property tax limitation regimes, Massachusetts has been offering taxpayer protections to homeowners for four decades, while New York’s property tax limitation, implemented in 2012, is considerably newer. Both, however, win plaudits for their design and their efficacy, and both have substantially limited the rate of property tax growth without harming local governments’ abilities to fund core services, including education. They have proven flexible enough to bend when there is a legitimate need, but sufficiently robust to take property taxes off the glide path to endless growth.
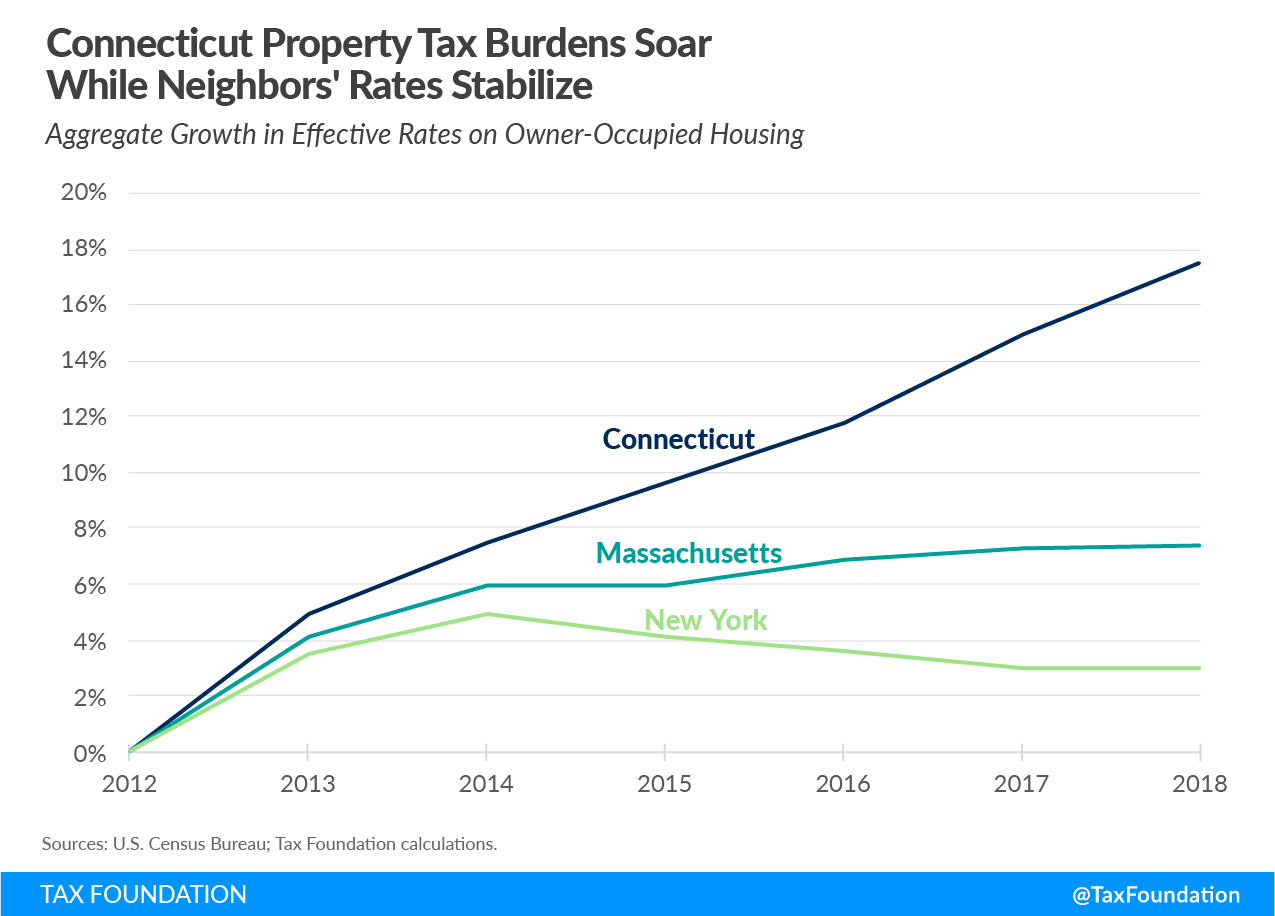
The following chart shows how effective rates on owner-occupied housing have increased in Connecticut, Massachusetts, and New York since 2012, the first year that New York’s property tax limitation was in effect. Burdens have soared in Connecticut, rising 17.5 percent over that time, compared to a 7.4 percent aggregate increase in Massachusetts and only a 3.0 percent increase in New York. The divergence has been particularly sharp since 2014. In all three states, overall tax collections have of course risen, but in Massachusetts and New York, particularly in recent years, effective rates have been relatively flat.
Massachusetts’ Proposition 2 ½
Adopted by the voters in 1980, Massachusetts’ Proposition 2 ½ began as a profound rebuke of the legislature, though over time it has come to be embraced by many lawmakers. Before the ballot initiative, there was a bill, and that bill was dead on arrival: it failed in the Massachusetts House of Representatives, in early 1980, on a lopsided vote of 155 against and only 5 in favor. But when advocacy groups succeeded in placing the measure on the ballot that fall, 59 percent of voters lent it their support.[29]
Compared to its more famous predecessor, California’s voter-initiated Proposition 13, Massachusetts’ Proposition 2 ½ is a model of careful policy design. That does not mean that it is simple nor that it is perfect. But whereas the hard-charging citizen efforts in California succeeded not only in limiting the growth of residential property tax burdens but also in fundamentally reshaping property taxation in ways that continue to plague California to this day, Proposition 2 ½ features a design that steers clear of the perverse incentives and unintended consequences of a California-style hard assessment limit (discussed later).
Many ballot measures, including Proposition 13, bear a number or letter signifying their position on the ballot. But Proposition 2 ½ was not, of course, the second—and a half?—ballot measure certified in Massachusetts in 1980. Rather, the name speaks to the measure’s core limitations: that property taxes cannot exceed 2.5 percent of the “full and fair cash value of real property” in a community (termed the “levy ceiling”), and that annual increases in the tax levy are capped at 2.5 percent growth (termed the “levy limit”).
Both provisions are types of levy limits as the term is understood more broadly. The first is an overall cap on a local government’s property tax levy; the second is a limit on the allowable rate of increase for property tax levies that are under the overall cap.[30] Since 52 Massachusetts localities already imposed property taxes that collected in excess of 2.5 percent of the fair market value of real property within their jurisdiction, the measure also required that these jurisdictions reduce their levies in stages until they reached the cap.
Incredibly, given that 2.5 percent is actually a high effective rate—nationally, the average effective rate on owner-occupied real property is 1.11 percent, though the existence of higher effective rates on commercial, industrial, and other classes of property make the overall average higher than that—the city of Boston actually entered 1980 at quadruple the new cap, with a property tax equal to 10 percent of the fair market value of property within city limits. When Massachusetts voters insisted that their property taxes were too high, it would have been extremely difficult to argue the point. Similarly, the hard cap had immediate results: within five years, property taxes in Massachusetts went from 76 percent above the national average to only 13 percent above it.[31]
Imagine a city with property valued at $400 million. Under the levy ceiling of 2.5 percent, it can raise a maximum of $10 million a year in property taxes. It may, however, currently raise less than that—say $8 million a year, reflecting an effective rate of 2 percent. There is plenty of room under the levy ceiling, but the separate levy limit restricts the rate of increase to 2.5 percent a year, meaning, in our example, that the next year’s collections could increase by no more than $200,00, not counting new growth. This is true whether the increase arises from rising assessed values or rate increases.
Note how the ceiling and the limit take different approaches to rising assessed values. As assessed values rise or new property is placed into service, the levy ceiling rises as well. If, in a future year, the value of all properties in the city jumps to $440 million, then the levy ceiling will rise to $11 million, a 10 percent increase in line with the 10 percent increase in assessed value. The levy limit, however, does not permit property tax collections to soar 10 percent. The amount to which property tax collections may ultimately grow is now higher, but the rate of increase is still limited to 2.5 percent per year, plus new growth.
If, for instance, $20 million of the hypothetical $40 million increase in assessed values was due to new construction, then the new levy limit would give the city the benefit of enhanced collections based on these properties newly placed into service. The levy limit would rise from $8 million to $8.61 million, reflecting an increase in the permissible effective rate from 2.0 to 2.05 (a 2.5 percent rise), worth $200,000, and the inclusion of an additional $20 million in new property at the new rate, worth $410,000.
Keeping new growth out of the cap makes good sense. So does limiting the growth of collections even when assessed values rise. In fact, both are based on the same basic observation: while the relative value of property owned is a good way of approximating the benefit of government services received, the appreciation of that property’s value does not necessarily make the services more costly to provide. It does not cost more for a city to provide government services to someone because their property value rose, on paper, from $300,000 to $320,000. It does, however, tend to impose new costs when there is new construction, particularly when that construction means more residents or businesses locating within a community.
Sometimes, of course, local governments face pressing fiscal needs, or wish to make new investments. Massachusetts’ cap is often characterized as a strict one, but that does not mean it is inflexible. The voters in a Massachusetts community can permanently increase the levy limit through an override vote, and there are provisions for voters to authorize temporary exclusions of debt and capital outlay expenditures that can allow a locality to briefly exceed its levy limit for purposes of a specific expenditure.[32]
A majority vote of local elected officials places an override vote on the ballot. Voters then get to decide whether to authorize a permanent enhancement of the levy limit. Picking up the thread of our earlier example, voters might be asked whether to allow a $590,000 enhancement of the levy limit, which would allow collections to rise from a planned $8.61 million to $9.2 million, with future annual increases beginning from this higher point. These overrides cannot, however, push the levy limit higher than the levy ceiling (in our example, $11 million).
Voters can nevertheless allow taxes to temporarily exceed the levy ceiling to cover debt or the cost of a specified capital expenditure, like the construction of a new school or a transportation improvement. These debt and capital outlay expenditure exclusions do not become part of the base on which future levy limits are calculated, and only increase taxes for the duration of the specified project or debt service.
Finally, a local governing body may also send what is called an “underride” to the ballot, a curious neologism referring to a unique feature of Proposition 2 ½ through which voters can choose to reduce the levy limit by a given amount. If, with the levy limit set to rise from $8 to $8.61 million, the community believed that growth too precipitous, local elected officials and the voting public could, for instance, vote to reduce the levy limit by $410,000, making the revised limit $8.2 million instead.
Voters have often been willing to approve overrides when presented with a compelling case, and localities have often made the request, though those override votes are declining. According to the Massachusetts Taxpayers Association, there were 277 override votes per year in the 1990s, 118 per year in the 2000s, and just 41 per year in the 2010s.[33] Over the decade-long period running from FY 2004 to FY 2013, the Massachusetts Department of Revenue reports that voters approved 47 percent of overrides presented to them at the ballot.[34] During the same time period, eight underride votes were initiated, and seven won—perhaps surprisingly, the residents of one jurisdiction (Amesbury) rejected a lower limit recommended to them by their own elected officials.[35]
It is important to note that both levy limits and levy ceilings represent caps on what a jurisdiction can raise; the millages are set by local government, and local officials may choose to raise less than what is permitted under the cap. The levy limit, moreover, does not have a use-it-or-lose-it component: if a city’s levy limit were $8 million in year one, it would rise to $8.2 million (not counting any new growth) the next year even if the city only chose to raise $7.5 million. Local lawmakers would be free to raise up to $8.2 million the next year (the difference is called the “excess capacity”), even though this represents more than a 9 percent increase in collections, because the levy limit is unaffected by the choice of whether to maximize collections.[36]
The obvious downside of this approach is that Proposition 2 ½ does not necessarily shield taxpayers from a sharp increase in burdens. A jurisdiction that historically kept property taxes low might have significant capacity to raise taxes under its limit without seeking an override. Conversely, however, by keeping the growth of the levy limit separate from decisions about each year’s millages, the measure does not encourage localities to max out their property tax rates each year for fear of losing the capacity to levy them at those levels in the future.
New York’s Property Tax Limitation Regime
Adopted in 2011, early in the tenure of Gov. Andrew Cuomo (D), New York’s property tax is also a form of levy limit, with the annual growth in property taxes in a given jurisdiction limited to the lesser of 2 percent or the rate of inflation. The cap applies to all local governments except New York City, and to all independent school districts outside the so-called “Big Five Cities.”[37] As in Massachusetts, overrides are possible. They require a 60 percent vote of either the voters (for school district taxes) or the local governing body (for local governments).[38]
As a levy limit, New York’s tax cap is designed to be agnostic to changes in the value of real property in the aggregate. If an individual homeowner sees her value rise more than that of her neighbors, her tax burden may still increase, but the value of properties increasing in aggregate does not permit the jurisdiction to levy more in taxes. Instead, rates would have to come down to keep total collections under the cap.
Like Massachusetts and most other states with levy limits, New York excludes new construction and improvements from the cap under a provision called the “Quantity Changer Factor,” which provides an adjustment for increases in the value of taxable real property due to new growth or significant additions.[39] Additionally, certain expenditures permit property tax levy growth outside the cap. These include the need to pay for large tort settlements, capital costs for school districts (which require voter approval to be initiated), and significant pension contribution increases.
Whereas Massachusetts allows localities to use all excess capacity that exists between current tax burdens and the locality’s levy limit, New York offers a narrower “carryover” of up to 1.5 percent of unused tax levy growth from one year to the next, but does not allow this excess capacity to continue indefinitely.[40]
New York, therefore, has something closer to a pure levy limit, with provisions that regulate the rate of growth of actual levies, not allowable ones. The levy is technically distinct from actual collections, since a jurisdiction may fail to collect all amounts to which it is legally entitled. But in New York, the allowable increase—up to 2 percent plus new growth and accounting for any exclusions—is based on the prior year’s levy, whereas in Massachusetts, the levy limit grows each year whether the locality’s collections rise to match it or not.
Between 2012 and 2018, under the cap, school taxes increased an average of 1.9 percent a year, according to a study conducted by the Rockefeller Institute. During the previous five years, increases approached 7 percent per year.[41] Separately, Gov. Cuomo’s office estimated 5.3 percent annual property tax growth between 2000 and 2010, and—in line with the Rockefeller Institute figures—approximately 2 percent growth from 2012 onward. Using these figures, the governor’s office has estimated that the cap has resulted in about $25 billion in taxpayer savings, on the assumption that the former rate of growth would have continued otherwise.[42]
The cap has proven popular, winning broad bipartisan support for an extension of its original sunset from 2016 to 2020, and then in being made permanent in 2019 at the urging of the governor and with the support of leading lawmakers of both parties.[43] Despite concerns in some quarters that the limits would adversely affect school districts, the state has seen continued increases in education spending, and spending has risen more rapidly in lower-income, higher-need districts—even though those same districts have often also received a greater share of property tax relief.[44]
Considerations and Best Practices
In much of the country, property taxes are the most important source of local tax revenue. In New England, they tend to be almost the only source. That is certainly the case in Connecticut, where 98.5 percent of tax collections (and about half of all revenue) comes from the property tax. A limitation on property taxes, then, should be understood as a limitation on local revenue, not an inducement to a greater diversification of revenue sources. Absent significant changes in local tax authority, there simply are not viable alternatives—nor is it obvious that there should be.
Property taxes are among the more economically neutral taxes, demonstrating a much smaller influence on economic decision-making than most alternative modes of taxation.[45] As an immobile asset, tax competition and tax avoidance activities arising from their taxation are less pronounced than they would be from other available tax options.[46]
Property taxes also come closer to passing the benefit test, whereby taxes paid roughly correlates with benefits received. However imperfect, the value of one’s property is a better proxy for the value of local services received than most alternative tax bases. More than at other levels of government, local services often align closely with property and property values. Roads, utilities, police and fire protection, and local public amenities all increase or preserve the value of property, and, if supplied privately, would likely increase in worth with higher property values.[47] Connecticut residents may quite reasonably wish to constrain revenue growth, but should be wary of attempts to reduce property taxes by increasing taxes elsewhere—an idea with a bad track record in the state.
All property tax limitations, whatever their features, serve as a constraint on local government. In broad terms, levy limits function as a revenue constraint, rate limits as a policy constraint, and assessment limits as an individual burdens constraint. Perceptions of whether such constraints are needed, meanwhile, may be driven by ideological preferences as well as mental models of accountability in local government.
Political scientists sometimes speak of two competing models: the Leviathan model and that of effective electoral competition. The Leviathan model suggests that governmental decision-makers are largely unmoored from the preferences of the voting public: that, either out of bureaucratic inertia or a lack of meaningful electoral constraints, public officials disregard the wishes of the voting public for extended periods with few, if any, consequences. By contrast, the effective electoral competition model operates on the assumption that, should public officials diverge too sharply from the preferences of the electorate, they will be replaced, which both constrains their scope of action and provides for their removal if they act outside of those constraints.[48]
If the electoral competition model is sound and is accepted by the general public, then policy and revenue constraints will have little appeal. Elected officials sufficiently attuned to the preferences of the people do not require other restrictions on their authority. If, however, officials are not particularly accountable to the people—or at least the people do not believe they are—then guardrails on their authority become more alluring. Perhaps Connecticut residents accept rising property tax burdens as the cost of maintaining a government status quo even as property values decline, or perhaps, as the Leviathan model suggests, public preferences are not adequately represented in local government decision-making.
Property tax limits do not, of course, mean that property taxes can no longer rise. Most limitations, including those in neighboring states, allow some level of annual increase, and it is common to incorporate provision for a voter override, designed to offer flexibility in addressing costs or investments that require higher taxes.
In practice, voters frequently consent to higher taxes at the polls, a willingness that some regard as undercutting the central rationale for such limits. It is reasonable to think, however, that public officials may be more circumspect in pursuing increases if they must appear on the ballot, and that voters may be more amenable to increases if the case is put to them directly. That many ballot measures to waive limitations have been approved does not tell us how many times taxes might have been increased had the process not been subject to voter approval. And there is something to be said for securing that approval.
Conclusion
Connecticut’s property taxes are uncommonly high—and only getting higher. This trajectory has persisted for decades, despite efforts to alleviate property tax burdens by shifting to other taxes at the state level, including the adoption of an individual income tax in 1991. Meanwhile, two nearby competitor states, Massachusetts and New York, have found ways to keep property taxes under control while still funding important government services.
A levy limit restricting the overall increase in a jurisdiction’s property tax collections from year to year, and perhaps setting a levy ceiling based on a percentage of assessed value, could provide greater certainty for Connecticut taxpayers. The property tax, after all, differs from other taxes in its malleability. While any tax can be increased, changes to income, sales, and other major taxes tend to be infrequent and involve considerable debate, whereas property taxes are adjusted frequently, sometimes in the absence of much deliberation. Given the challenges Connecticut faces with a continued exodus of individuals and businesses, two regional competitors that have embraced greater certainty and predictability in their property tax codes may provide a valuable blueprint for Connecticut policymakers.
[1] U.S. Census Bureau, “Annual Survey of State and Local Government Finances,” 2017, https://www.census.gov/programs-surveys/gov-finances.html.
[2] Defined as Connecticut, Maine, Massachusetts, New Hampshire, Rhode Island, and Vermont, in line with U.S. Bureau of Economic Analysis regional classifications.
[3] U.S. Census Bureau, “Annual Survey of State and Local Government Finances.”
[4] Connecticut Office of Policy and Management, Mill Rates Grand Lists (multiple years), https://portal.ct.gov/OPM/IGPP-MAIN/Publications/Mill-Rates; Tax Foundation analysis.
[5] Id.
[6] U.S. Census Bureau, “Annual Survey of State and Local Government Finances.”
[7] Tax Foundation, “Facts & Figures: How Does Your State Compare?” (multiple years), https://taxfoundation.org/publications/facts-and-figures.
[8] This is true of states, though the District of Columbia posts a higher per capita income ($84,538). Bureau of Economic Analysis, “Regional Economic Accounts, SA1 Personal Income Summary: Personal Income, Population, Per Capita Personal Income,” https://www.bea.gov/regional/.
[9] Here too, the District of Columbia is higher, at $10,717. U.S. Census Bureau, “Annual Survey of State and Local Government Finances.”
[10] Greg Bordonaro, “CT Is Losing Population but not to the States You’d Think,” Hartford Business Journal, Nov. 1, 2019, https://www.hartfordbusiness.com/article/ct-is-losing-population-but-not-to-states-youd-think.
[11] Derek Thompson, “What on Earth Is Wrong With Connecticut?” The Atlantic, July 5, 2017, https://theatlantic.com/business/archive/2017/07/connecticut-tax-inequality-cities/532623/.
[12] Henry Grabar, “Trouble in America’s Country Club,” Slate, June 2, 2017, http://slate.com/articles/business/metropolis/2017/06/something_is_wrong_with_connecticut.html.
[13] Dan Haar, “Two Billionaires Head For Florida, Deepening CT’s Cash Crisis,” Hartford Current, Mar. 3, 2016, https://www.courant.com/business/hc-haar-forbes-list-thomas-peterffy-exit-costs-state-20160302-column.html; Russell Blair, “Forbes: Connecticut Retains Its 17 Billionaires,” Hartford Courant, Mar. 7, 2018, http://courant.com/politics/hc-pol-no-billionaires-left-connecticut-20180307-story.html.
[14] Manisha Srivastava, “Connecticut’s Population and Migration Trends: A Multi-Data Source Dive,” CT Office of Policy and Management, May 2017, http://ct.gov/opm/lib/opm/budget/resourcesanddata/CTs_Population_and_Migration_Trends.pdf.
[15] This section adapted from Jared Walczak, “Enhancing Tax Competitiveness in Connecticut,” Tax Foundation, July 31, 2018, https://taxfoundation.org/connecticut-tax-competitiveness/.
[16] Connecticut by the Numbers, “UTC, Raytheon Merger Effective on Friday; Otis, Carrier to be Set Loose,” Mar. 31, 2020, https://ctbythenumbers.news/ctnews/utc-raytheon-merger-effective-on-friday-otis-carrier-to-be-set-loose.
[17] Saul Spigel, John Rappa, and Susan Price-Livingston, “Hartford Tax Classification and Tax Abatements,” OLR Research Report, Apr. 26, 2000, https://www.cga.ct.gov/2000/rpt/2000-R-0448.htm.
[18] Corinne T. McCue and Fred V. Carstensen, “The Economic Effects of Revaluation and Tax Policy on the City of Hartford,” Connecticut Center for Economic Analysis, University of Connecticut, Dec. 1, 1999, https://webshare.business.uconn.edu/ccea/studies/Hartford-Reval-Final-Report.PDF.
[19] Lincoln Institute of Land Policy, “Connecticut Classification – Hartford,” 2018, https://www.lincolninst.edu/classification/connecticut-classification-hartford-connecticut-2018.
[20] C.G.S.A. § 12-62c.
[21] This section is adapted from Jared Walczak, “Property Tax Limitations: A Primer,” Tax Foundation, Apr. 23, 2018, https://taxfoundation.org/property-tax-limitation-regimes-primer/.
[22] John V. Winters, “Property Tax Limitations,” Fiscal Research Center, Georgia State University, FRC Report No. 179, June 2008, 3, http://cslf.gsu.edu/files/2014/06/property_tax_limitations.pdf.
[23] Lincoln Institute, “Significant Features of the Property Tax,” 2020, https://www.lincolninst.edu/research-data/data-toolkits/significant-features-property-tax.
[24] Terri Sexton, “The Increasing Importance of Assessment Limitations as a Means of Limiting Property Taxes on Homeowners,” California State University-Sacramento, September 2007, 20, https://www.researchgate.net/publication/228389262_The_Increasing_Importance_of_Assessment_Limitations_as_a_Means_of_Limiting_Property_Taxes_on_Homeowners.
[25] Lincoln Institute of Land Policy and Minnesota Center for Fiscal Excellence, “50-State Property Tax Comparison Study for Taxes Paid in 2016,” June 2017, 104, http://www.lincolninst.edu/sites/default/files/pubfiles/50-state-property-tax-comparison-for-2016-full.pdf.
[26] New York City Independent Budget Office, “Addressing the Disparities: Winners & Losers in Two Property Tax Reform Scenarios,” April 2018, https://ibo.nyc.ny.us/iboreports/addressing-the-disparities-winners-losers-in-two-property-tax-reform-scenarios-april-2018.pdf.
[27] Mark Haveman and Terri A. Sexton, “Property Tax Assessment Limits: Lessons from Thirty Years of Experience,” Lincoln Institute of Land Policy, July 22, 2008, 32, https://www.lincolninst.edu/es/news/press-releases/property-tax-assessment-limits-lessons-30-years-experience.
[28] Katharine L. Bradbury, Christopher J. Mayer, and Karl E. Case, “Property Tax Limits, Local Fiscal Behavior, and Property Values: Evidence from Massachusetts Under Proposition 2½,” Journal of Public Economics 80 (2001): 290.
[29] Trevor J. Brown, “Strict Property Tax Caps: A Case Study of Massachusetts’s Proposition 2 1/2, its Shortcomings, and the Path Forward,” The University of New Hampshire Law Review 16:2 (Mar. 20, 2018), 367, https://scholars.unh.edu/cgi/viewcontent.cgi?article=1308&context=unh_lr.
[30] M.G.L.A. 59 § 21C.
[31] Trevor J. Brown, “Strict Property Tax Caps: A Case Study of Massachusetts’s Proposition 2 1/2, its Shortcomings, and the Path Forward,” 370.
[32] Division of Local Services, “Levy Limits: A Primer on Proposition 2 ½,” Massachusetts Department of Revenue, June 2007, 6, https://www.mass.gov/doc/levy-limits-a-primer-on-proposition-2-12-0/download.
[33] Massachusetts Taxpayers Foundation, “Municipal Financial Data, 49th Edition,: Apr. 21, 2020, 2, https://www.masstaxpayers.org/municipal-financial-data-49th-edition.
[34] Division of Local Services, “City & Town,” Massachusetts Department of Revenue, June 19, 2014, https://www.mass.gov/doc/ctown-june19thpdf/download.
[35] Id., 9.
[36] Division of Local Services, “Levy Limits: A Primer on Proposition 2 ½,” 9-14.
[37] N.Y. Gen. Mun. Law § 3-c.
[38] New York State Department of Taxation and Finance and New York State Department of State, “The Property Tax Cap: Guidelines for Implementation,” October 2011, https://www.tax.ny.gov/pdf/publications/orpts/capguidelines.pdf.
[39] Id., 3.
[40] E.J. McMahon, “New York State’s Property Tax Cap,” Empire Center, Nov. 30, 2011, https://www.empirecenter.org/publications/new-york-states-property-tax-cap/.
[41] Jim Malatras, Nicholas Simons, and Michelle Cummings, “As Albany Debates a Permanent Property Tax Cap, How Is the Cap Affecting School Budgets?” Rockefeller Institute of Government, Jan. 23, 2019, https://rockinst.org/blog/as-albany-debates-a-permanent-property-tax-cap-how-is-the-cap-affecting-school-budgets/.
[42] New York Office of the Governor, “2019 Justice Agenda: The Time is Now,” 41, https://www.governor.ny.gov/sites/governor.ny.gov/files/atoms/files/2019StateoftheStateBook.pdf.
[43] Joseph Spector and Jon Campbell, “Property-Tax Cap in New York Expected to Be Made Permanent,” (Rochester, N.Y.) Democrat & Chronicle, Mar. 29, 2019, https://www.democratandchronicle.com/story/news/politics/albany/2019/03/29/property-tax-cap-new-york-expected-made-permanent/3314355002/.
[44] “Ken Girardin, “The Cap That Worked,” Empire Center, Mar. 27, 2019, https://www.empirecenter.org/publications/the-cap-that-worked/.
[45] Jens M. Arnold, Bert Brys, Christopher Heady, Heady, Åsa Johansson, Cyrille Schwellnus, and Laura Vartia, “Tax Policy for Economic Recovery and Growth,” The Economic Journal 121:550 (February 2011).
[46] For a discussion of strategic competition in property tax regimes, see Jan K. Brueckner and Luz A. Saavedra, “Do Local Governments Engage in Strategic Property—Tax Competition?” National Tax Journal 54:2 (June 2001): 203-230, https://www.ntanet.org/NTJ/54/2/ntj-v54n02p203-30-local-governments-engage-strategic.pdf?v=%CE%B1&r=03589733876287937.
[47] Bruce Wallin and Jeffrey Zabel, “Property Tax Limitations and Local Fiscal Conditions: The Impact of Proposition 2½ in Massachusetts,” Lincoln Institute of Land Policy Working Paper, 2010, 4, http://www.lincolninst.edu/sites/default/files/pubfiles/1885_1200_wallin_zabel_wp11bw1.pdf.
[48] David M. Cutler, Douglas W. Elmendorf, and Richard J. Zeckhauser, “Restraining the Leviathan: Property Tax Limitation in Massachusetts,” NBER Working Paper 6196, September 1997, http://www.nber.org/papers/w6196.pdf.
Share this article