Key Findings
- Local income taxes are imposed by 4,964 taxing jurisdictions across 17 states, with a heavy concentration in Rust Belt states, particularly Ohio and Pennsylvania.
- Depending on the state, local income taxes may be levied by counties, municipalities, school districts, or special districts, with most levied by municipalities (3,816) and school districts (954).
- Six states rely on income taxes for more than 10 percent of local taxA tax is a mandatory payment or charge collected by local, state, and national governments from individuals or businesses to cover the costs of general government services, goods, and activities. collections, while the local income taxes in five states capture more than 1 percent of adjusted gross incomeFor individuals, gross income is the total of all income received from any source before taxes or deductions. It includes wages, salaries, tips, interest, dividends, capital gains, rental income, alimony, pensions, and other forms of income. For businesses, gross income (or gross profit) is the sum of total receipts or sales minus the cost of goods sold (COGS)—the direct costs of producing goods.
- Nonresidents are sometimes subject to a lower rate than residents, or not taxed at all, in recognition that they receive fewer benefits than do residents.
- In different states, local income taxes are levied on all income, earned income, or interest and dividend income. Some jurisdictions impose payroll taxes or dollar-denominated employment or occupational privilege taxes in lieu of a traditional income tax.
- While most local income taxes are low, they often have broad bases and are difficult to avoid, which can discourage economic activity or drive out mobile workers or businesses. Officials should also be careful not to impose excessive compliance costs through complexities within their local tax regimes.
Introduction
Although the majority of U.S. cities and counties do not impose a local income tax, they are imposed by 4,964 jurisdictions in 17 states. Ranging from de minimis wage taxes in some states to a statewide average of nearly 2.3 percent of adjusted gross income in Maryland (see Table 1), these taxes are a long-standing and significant source of revenue for many cities in Rust Belt states in the northeastern United States.
All counties in Indiana and Maryland impose a local income tax. In Ohio, 649 municipalities and 199 school districts have income taxes, while 2,506 municipalities and 472 school districts in Pennsylvania impose local income or wage taxes. (Three-quarters of all local income tax jurisdictions, though not three-quarters of the taxed population, are in those two states.) Many cities, counties, and school districts in Iowa, Kentucky, and Michigan also have these taxes, which are more sporadically levied in other states.
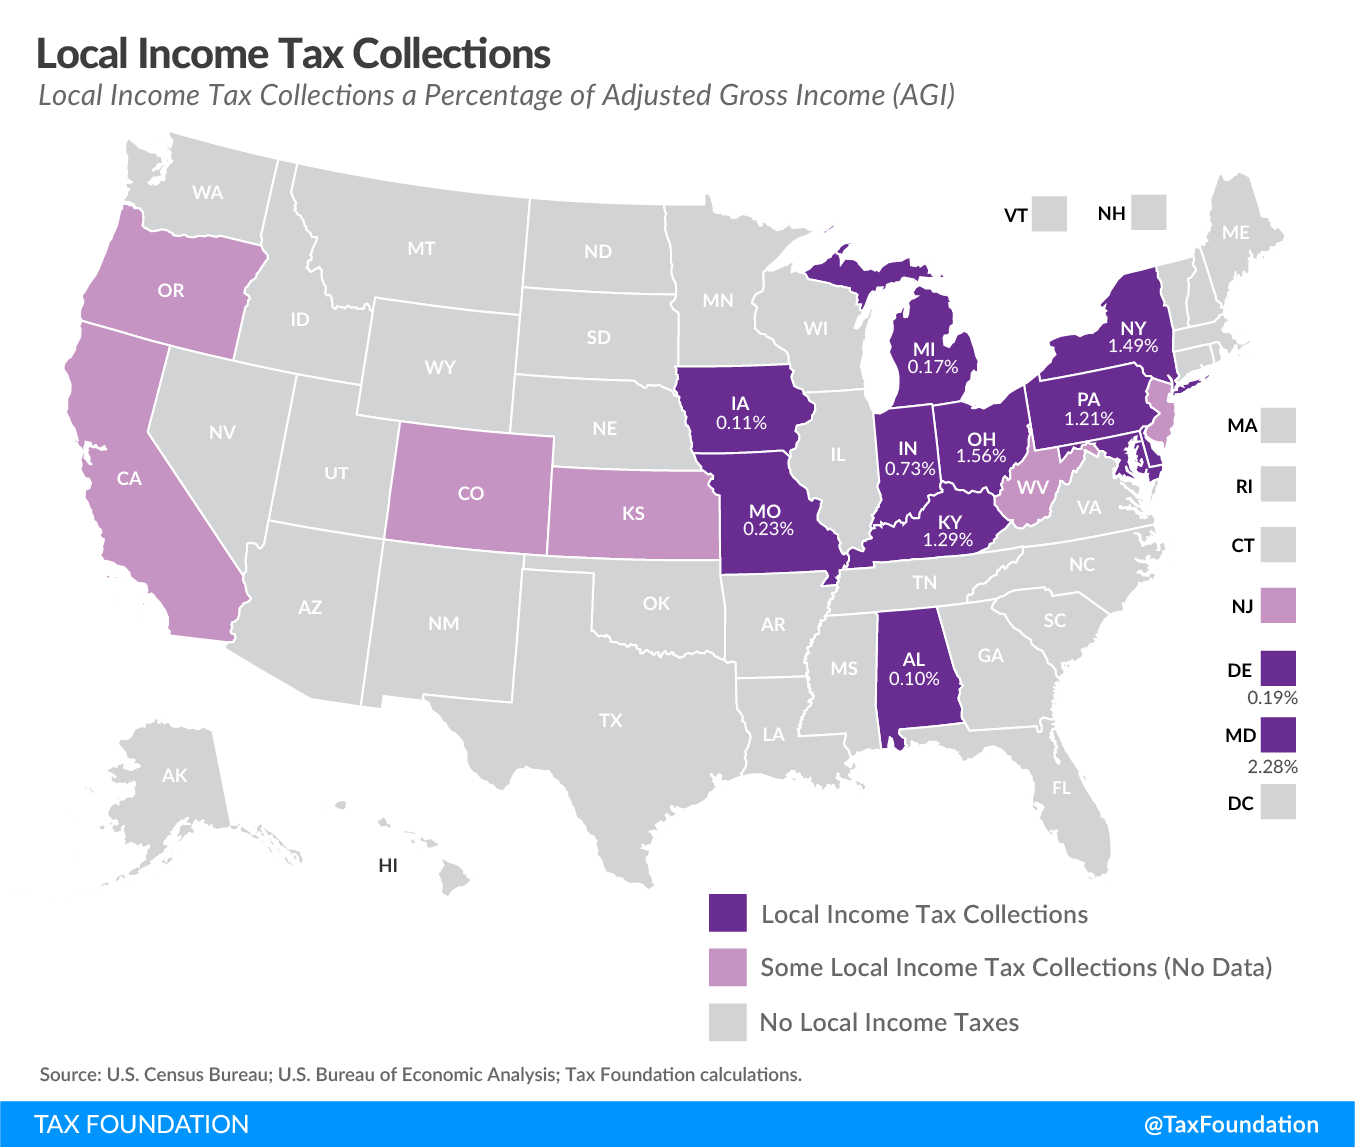
Figure 1. Local Income Tax Collections as a Percentage of Adjusted Gross Income
Stay informed on the tax policies impacting you.
Subscribe to our free newsletter to get the latest tax data, news and analysis.
SubscribeIn total, 190 counties impose income taxes, with Indiana (all 92), Kentucky (73 of 120), and Maryland (all 23) accounting for but all but two county-level income taxes. The other two are Macon County, Alabama and Appanoose County, Iowa.
Municipalities account for 3,816 of the 5,032 jurisdictions with local income taxes, and 3,155 of these are in Ohio and Pennsylvania. Another 954 income tax jurisdictions are school districts, again heavily concentrated in those two states, which claim a combined 671 of them. They are joined by Iowa, with 279 school districts imposing local income taxes, with only four school districts levying income taxes outside those three states. Finally, four special districts impose local income taxes—transportation and port authorities in New York and Oregon.
|
Source: State agencies; local ordinances; Tax Foundation research. |
|
| Type of Jurisdiction | Number |
|---|---|
| Counties | 190 |
| Municipalities | 3,816 |
| School Districts | 954 |
| Special Districts | 4 |
Six states rely on income taxes for more than 10 percent of local tax collections: Maryland (33.7 percent), Kentucky (26.2 percent), Ohio (22.1 percent), Pennsylvania (18.3 percent), Indiana (16.3 percent), and New York (12.0 percent). In five states, local income taxes capture more than 1 percent of adjusted gross income: Maryland (2.3 percent), Ohio (1.6 percent), New York (1.5 percent), Kentucky (1.3 percent), and Pennsylvania (1.2 percent).
|
(a) California’s only local income tax is a San Francisco payroll tax, while New Jersey’s is a Newark payroll tax, neither of which are included in Census data. (b) Flat-rate wage taxes are imposed in Denver and four other Colorado cities, along with four cities in West Virginia. (c) Kansas imposes a local “intangible tax” on interest and dividend income. (d) Oregon imposes local income taxes in two transportation districts, but these taxes are not represented as local income taxes for Census purposes. Source: U.S. Census Bureau. |
||||
| Municipal Income Tax Revenue as a Percentage of | ||||
|---|---|---|---|---|
| State | Adjusted Gross Income | Local Tax Collections | Local Revenue | |
| Alabama | 0.10% | 2.12% | 0.55% | |
| California | (a) | (a) | (a) | |
| Colorado | (b) | (b) | (b) | |
| Delaware | 0.19% | 5.70% | 1.62% | |
| Indiana | 0.73% | 6.31% | 4.32% | |
| Iowa | 0.11% | 1.80% | 0.60% | |
| Kansas | (c) | (c) | (c) | |
| Kentucky | 1.29% | 26.22% | 9.03% | |
| Maryland | 2.28% | 33.69% | 17.72% | |
| Michigan | 0.17% | 3.77% | 1.05% | |
| Missouri | 0.23% | 3.83% | 1.49% | |
| New Jersey | (a) | (a) | (a) | |
| New York | 1.49% | 12.04% | 5.93% | |
| Ohio | 1.56% | 22.12% | 9.07% | |
| Oregon | (d) | (d) | (d) | |
| Pennsylvania | 1.21% | 8.27% | 7.53% | |
| West Virginia | (b) | (b) | (b) | |
A Short History of Local Income Taxes
At the federal and state level, income taxes were an outgrowth of the progressive era, beginning in Wisconsin in 1911 as the culmination of an effort that had proceeded through fits and starts since 1903, with the support of Gov. Robert La Follette, a progressive icon.[1] Mississippi followed a year later, and after ratification of the Sixteenth Amendment to the U.S. Constitution in 1913, state income taxes began to proliferate, hastened on by the Great Depression and the strains it placed on traditional sources of state revenue.
For local governments, income taxes came later; 31 states had already adopted individual income taxes[2] by the time Philadelphia, Pennsylvania became the first municipal government to levy a tax on income. Initially, moreover, local income taxes proved most viable in states which had not adopted their own income taxes. Pennsylvania was one such example; Ohio, another state in which local income taxes flourished, was another.
Philadelphia, granted authority for a local income tax in 1932, adopted one in 1938, only to have its provisions run afoul of the uniformity clause in the state constitution. The city succeeded in its second attempt, authorizing a 1.5 percent tax on income from wages and salaries in December of 1939 and thus inaugurating the era of local income taxation.[3]
New York City was actually the first city to adopt an income tax ordinance, approving one in 1934, but city leaders developed cold feet, repealing the tax before it could take effect in 1935. After Philadelphia’s 1939 tax, it would be another seven years for another city to follow, with Toledo, Ohio becoming the second to make a foray into municipal income taxation in 1946.[4]
Stay informed on the tax policies impacting you.
Subscribe to our free newsletter to get the latest tax data, news and analysis.
SubscribeLocated along the border with Michigan, the narrow strip in which Toledo is situated was at the center of the Toledo War, a boundary dispute only resolved when Congress agreed to grant the Upper Peninsula to Michigan in exchange for the territory ceding its claim to the Toledo Strip to Ohio. But this city, once a contested frontier, was the harbinger for things to come, with other Ohio cities—Columbus, Springfield, Youngstown, Dayton, Warren, Canton, and Cincinnati—adopting their own municipal income taxes in short succession.[5] Back in Pennsylvania, a 1947 law allowed all municipalities to implement their own income taxes, and many quickly took the state up on the offer.[6] Pennsylvania and Ohio still chose to forgo state income taxes, and to their cities, that choice created a valuable local opportunity.
Until 1962, only two other states—Kentucky (1947) and Missouri (1948)—had joined the original pair of states straddling the Ohio River. Local income taxation was, to an extent, an Appalachian phenomenon, geographically contained. Michigan followed in 1962, and Baltimore and New York City adopted municipal income taxes in 1966. Today, local governments in 17 states tax income in some form.
Rationale for Local Income Taxes
Local income and wage taxes are generally applied to those who live or work in a given jurisdiction. They can complement or replace other local revenue sources, like property, sales, business, meals, or lodging taxes. In some cases, taxes are only assessed where the taxpayer is domiciled; other times, a tax is imposed where income is earned; and in certain cases, both jurisdictions may have the authority to levy a tax, usually—but not always—with a requirement that credit be given (in the domiciliary jurisdiction) for taxes paid to other jurisdictions.
Accordingly, the base of payors is potentially broader than that of the property tax (even accounting for the incidence of that tax on renters), because it can fall on those who work in a jurisdiction, whether or not they own property there. While commuting employees do impose some costs upon a city, however, they are not the primary beneficiaries of locally provided services, like schools, law enforcement, and social services.
In many cases, cities recognize that nonresidents receive fewer governmental benefits and impose a lower rate on nonresidents. In Maryland, for example, city and county income taxes range from 1.75 to 3.2 percent, while nonresidents pay a uniform rate set at the lowest county rate (1.75 percent). Similarly, cities in Michigan and Pennsylvania typically impose income and wage taxes on nonresidents at a lower rate than they do on residents,[7] although Ohio communities generally levy the same rates on both groups.
Types of Local Income Taxes
Local income taxes appear under a variety of designations: wage taxes, income taxes, payroll taxes, local services taxes, and occupational privilege taxes. They are generally paid by the employee but withheld by the employer, although in some cases (such as in San Francisco and Newark, New Jersey), they are paid directly by the employer. Some are imposed as a percentage of salaries or wages, while others are stated as a percentage of federal or state tax, and still others are flat amounts charged to all workers. While 485 Kansas jurisdictions impose a local income tax, these taxes only fall on interest and dividend income.
Four West Virginia cities impose a flat charge of $2 to $5 per week on all those employed in the city. Appanoose County, Iowa, alone among Iowa counties, imposes a 1 percent emergency services surtax. Residents of Yonkers, New York pay 16.75 percent of their state tax as a “piggyback” local tax. Like federal and state income taxes, some local wage taxes have provisions for exemption, such as excluding military income or low-income individuals.
In Maryland and New York City, residents pay their local income tax when they file their state income tax. However, there are examples of extreme compliance burdens associated with local income taxes collected by local authorities. As one example, taxpayers in Albion, Michigan, must fill out a city income tax form of 16 pages, with instructions, separate from state and federal income tax forms.
|
Sources: State agencies; local ordinances; Tax Foundation research. |
|
| State | Jurisdictions |
|---|---|
| Alabama | 4 |
| California | 1 |
| Colorado | 5 |
| Delaware | 1 |
| Indiana | 92 |
| Iowa | 280 |
| Kansas | 485 |
| Kentucky | 210 |
| Maryland | 24 |
| Michigan | 23 |
| Missouri | 2 |
| New Jersey | 1 |
| New York | 4 |
| Ohio | 848 |
| Oregon | 2 |
| Pennsylvania | 2,978 |
| West Virginia | 4 |
| Total | 4,964 |
Local Income Tax Rates in 2019
While most local income taxes are low (typically 1 to 3 percent), they often have broad bases and are difficult to avoid. State and local officials should ensure that these taxes do not discourage economic development or drive out mobile workers or businesses. Officials should also be careful not to impose excessive compliance costs through complexities within their local tax regimes.
The following table lists both the resident and nonresident rates for local income taxes across the country in 2019. In cases where more than 25 jurisdictions tax income in a given state, the 10 most populous jurisdictions’ rates are shown. A full list of all 5,032 jurisdictions is available to download on the Tax Foundation’s website at Local Income Tax Rates (XLSX).
|
(a) Paid by employer (b) Only imposed on employees of Port Authority A full list of all local income taxes is available at Local Income Tax Rates (XLSX). Sources: State agencies; local ordinances; Tax Foundation research. |
||
|
Alabama |
4 Taxing Jurisdictions |
|
| Taxing Jurisdiction | Resident Rate | Nonresident Rate |
| Bessemer | 1.00% | 1.00% |
| Birmingham | 1.00% | 1.00% |
| Gadsden | 2.00% | 2.00% |
| Macon County | 1.00% | 1.00% |
|
California |
1 Taxing Jurisdiction |
|
| Taxing Jurisdiction | Resident Rate | Nonresident Rate |
| San Francisco (a) | 0.38% | 0.38% |
|
Colorado |
5 Taxing Jurisdictions |
|
| Taxing Jurisdiction | Resident Rate | Nonresident Rate |
| Aurora | $2 per month | $2 per month |
| Denver | $5.75 per month | $5.75 per month |
| Glendale | $10 per month | $10 per month |
| Greenwood Village | $4 per month | $4 per month |
| Sheridan | $6 per month | $6 per month |
|
Delaware |
1 Taxing Jurisdiction |
|
| Taxing Jurisdiction | Resident Rate | Nonresident Rate |
| Wilmington | 1.25% | 1.25% |
|
Indiana |
92 Taxing Jurisdictions |
|
| Taxing Jurisdiction | Resident Rate | Nonresident Rate |
| Allen County | 1.48% | 1.48% |
| Elkhart County | 2.00% | 2.00% |
| Hamilton County | 1.00% | 1.00% |
| Hendricks County | 1.50% | 1.50% |
| Lake County | 1.50% | 1.50% |
| Marion County | 2.02% | 2.02% |
| Porter County | 0.50% | 0.50% |
| St. Joseph County | 1.75% | 1.75% |
| Tippecanoe County | 1.10% | 1.10% |
| Vanderburgh County | 1.20% | 1.20% |
| 82 other counties | 0.35% – 3.38% | 0.35% – 3.38% |
|
Iowa |
280 Taxing Jurisdictions |
|
| Taxing Jurisdiction | Resident Rate | Nonresident Rate |
| Appanoose County | 1.00% | 1.00% |
| Ames School District | 4.00% of state tax liability | 0.00% |
| Cedar Rapids School District | 5.00% of state tax liability | 0.00% |
| Clinton School District | 8.00% of state tax liability | 0.00% |
| Fort Dodge School District | 2.00% of state tax liability | 0.00% |
| Iowa City School District | 5.00% of state tax liability | 0.00% |
| Marion School District | 4.00% of state tax liability | 0.00% |
| Mason City School District | 7.00% of state tax liability | 0.00% |
| Muscatine School District | 1.00% of state tax liability | 0.00% |
| Sioux City School District | 3.00% of state tax liability | 0.00% |
| 270 other school districts | 1-9% of state tax liability | 0.00% |
|
Kansas |
485 Taxing Jurisdictions |
|
| Taxing Jurisdiction | Resident Rate | Nonresident Rate |
| Clay County | 0.75% on interest & dividends | 0.00% |
| Cloud County | 0.75% on interest & dividends | 0.00% |
| Cowley County | 0.75% on interest & dividends | 0.00% |
| Dickinson County | 0.75% on interest & dividends | 0.00% |
| Doniphan County | 0.75% on interest & dividends | 0.00% |
| Mitchell County | 0.75% on interest & dividends | 0.00% |
| Norton County | 0.75% on interest & dividends | 0.00% |
| Phillips County | 0.75% on interest & dividends | 0.00% |
| Riley County | 0.75% on interest & dividends | 0.00% |
| Washington County | 0.75% on interest & dividends | 0.00% |
| 475 other jurisdictions | 0.125% – 2.50% on interest & dividends | 0.00% |
|
Kentucky |
210 Taxing Jurisdictions |
|
| Taxing Jurisdiction | Resident Rate | Nonresident Rate |
| Campbell County | 1.05% | 0.00% |
| Daviess County | 0.35% | 0.00% |
| Kenton County | 0.7097% to 0.1097% | 0.00% |
| Lexington-Fayette Urban Co. Gov’t | 2.25% | 0.00% |
| Louisville School Board | 0.75% | 0.00% |
| Louisville Metro | 1.45% | 0.00% |
| Warren County | 1.00% | 0.00% |
| Fayette County Public School Dist. | 0.50% | 0.00% |
| Warren County Public Schools | 0.50% | 0.00% |
| Daviess County | 0.35% | 0.00% |
| 200 other jurisdictions | 0.0033% – 2.5% | 0.00% |
|
Maryland |
24 Taxing Jurisdictions |
|
| Taxing Jurisdiction | Resident Rate | Nonresident Rate |
| Allegany County | 3.05% | 1.75% |
| Anne Arundel County | 2.50% | 1.75% |
| Baltimore City | 3.20% | 1.75% |
| Baltimore County | 2.83% | 1.75% |
| Calvert County | 3.00% | 1.75% |
| Caroline County | 3.20% | 1.75% |
| Carroll County | 3.03% | 1.75% |
| Cecil County | 3.00% | 1.75% |
| Charles County | 3.03% | 1.75% |
| Dorchester County | 2.62% | 1.75% |
| Frederick County | 2.96% | 1.75% |
| Garrett County | 2.65% | 1.75% |
| Harford County | 3.06% | 1.75% |
| Howard County | 3.20% | 1.75% |
| Kent County | 2.85% | 1.75% |
| Montgomery County | 3.20% | 1.75% |
| Prince George’s County | 3.20% | 1.75% |
| Queen Anne’s County | 3.20% | 1.75% |
| St. Mary’s County | 3.00% | 1.75% |
| Somerset County | 3.20% | 1.75% |
| Talbot County | 2.40% | 1.75% |
| Washington County | 2.80% | 1.75% |
| Wicomico County | 3.20% | 1.75% |
| Worcester County | 1.75% | 1.75% |
|
Michigan |
23 Taxing Jurisdictions |
|
| Taxing Jurisdiction | Resident Rate | Nonresident Rate |
| Albion | 1.00% | 0.50% |
| Battle Creek | 1.00% | 0.50% |
| Benton Harbor | 1.00% | 0.50% |
| Big Rapids | 1.00% | 0.50% |
| Detroit | 2.40% | 1.20% |
| Flint | 1.00% | 0.50% |
| Grand Rapids | 1.50% | 0.75% |
| Grayling | 1.00% | 0.50% |
| Hamtramck | 1.00% | 0.50% |
| Highland Park | 2.00% | 1.00% |
| Hudson | 1.00% | 0.50% |
| Ionia | 1.00% | 0.50% |
| Jackson | 1.00% | 0.50% |
| Lansing | 1.00% | 0.50% |
| Lapeer | 1.00% | 0.50% |
| Muskegon | 1.00% | 0.50% |
| Muskegon Heights | 1.00% | 0.50% |
| Pontiac | 1.00% | 0.50% |
| Port Huron | 1.00% | 0.50% |
| Portland | 1.00% | 0.50% |
| Saginaw | 1.50% | 0.75% |
| Springfield | 1.00% | 0.50% |
| Walker | 1.00% | 0.50% |
|
Missouri |
2 Taxing Jurisdictions |
|
| Taxing Jurisdiction | Resident Rate | Nonresident Rate |
| Kansas City | 1.00% | 1.00% |
| St. Louis | 1.00% | 1.00% |
|
New Jersey |
1 Taxing Jurisdiction |
|
| Taxing Jurisdiction | Resident Rate | Nonresident Rate |
| Newark (a) | 1.00% | 1.00% |
|
New York |
4 Taxing Jurisdictions |
|
| Taxing Jurisdiction | Resident Rate | Nonresident Rate |
| New York City | 3.078% – 3.876% | 0.00% |
| Metropolitan Transport Authority | 0.34% | 0.00% |
| NY-NJ Waterfront (b) | 2.00% | 0.00% |
| Yonkers | 16.75% of state tax | 0.50% |
|
Ohio |
848 Taxing Jurisdictions |
|
| Taxing Jurisdiction | Resident Rate | Nonresident Rate |
| Akron | 2.50% | 2.50% |
| Canton | 2.50% | 2.50% |
| Cincinnati | 2.10% | 2.10% |
| Cleveland | 2.50% | 2.50% |
| Columbus | 2.50% | 2.50% |
| Dayton | 2.50% | 2.50% |
| Lorain | 2.50% | 2.50% |
| Parma | 2.50% | 2.50% |
| Toledo | 2.25% | 2.25% |
| Youngstown | 2.75% | 2.75% |
| 838 other jurisdictions | 0.50% – 3.00% | 0.50% – 3.00% |
|
Oregon |
2 Taxing Jurisdictions |
|
| Taxing Jurisdiction | Resident Rate | Nonresident Rate |
| Lane Co. Mass Transit District (a) | 0.0067% | 0.0067% |
| Tri-Met Transportation District (a) | 0.6918% | 0.6918% |
|
Pennsylvania |
2,978 Taxing Jurisdictions |
|
| Taxing Jurisdiction | Resident Rate | Nonresident Rate |
| Allentown | 1.975% + $52 LST | 1.28% + $52 LST |
| Bethlehem | 1% + $52 LST | 1% + $52 LST |
| Erie | 1.65% + $52 LST | 1.18% + $52 LST |
| Harrisburg | 2% + $156 LST | 1% + $156 LST |
| Lancaster | 1.1% + $52 LST | 1% + $52 LST |
| Philadelphia | 3.8809% | 3.4567% |
| Pittsburgh | 1.5% + $52 LST | 1% + $52 LST |
| Reading | 3.6% + $52 LST | 1.3% + $52 LST |
| Scranton | 3.4% + $156 LST | 1% + $156 LST |
| York | 1.25% + $52 LST | 1.25% + $52 LST |
| 2,968 other jurisdictions | $10 LST – 2.75% + $52 LST | 0.00% – 2.00% + $52 LST |
|
West Virginia |
4 Taxing Jurisdictions |
|
| Taxing Jurisdiction | Resident Rate | Nonresident Rate |
| Charleston | $6 per pay period | $6 per pay period |
| Huntington | $10 per pay period | $10 per pay period |
| Parkersburg | $5 per pay period | $5 per pay period |
| Weirton | $2 per week | $2 per week |
Stay informed on the tax policies impacting you.
Subscribe to our free newsletter to get the latest tax data, news and analysis.
SubscribeNotes
[1] The author would like to thank Dominic Pino for his valuable research assistance.
[2] Kossuth Kennan, “The Wisconsin Income Tax,” The Quarterly Journal of Economics 26:1 (November 1911), 170.
[3] Advisory Commission on Intergovernmental Relations, Significant Features of Fiscal Federalism, Vol. 1, Budget Processes and Tax Systems (September 1995), https://library.unt.edu/gpo/acir/SFFF/sfff-1995-vol-1.pdf, 32.
[4] William J. McKenna, “The Income Tax in Pennsylvania,” Pennsylvania History: A Journal of Mid-Atlantic Studies 27:3 (July 1960), https://www.jstor.org/stable/27769968, 304-305.
[5] Milton C. Taylor, “Local Income Taxes After Twenty-One Years,” National Tax Journal 15:2 (June 1962), 114.
[6] Id.
[7] William J. McKenna, “The Income Tax in Pennsylvania,” 305.
[8] In Pennsylvania, this is chiefly a consequence of the division of municipal and school district taxes. Nonresident rates on the municipal Earned Income Tax can be higher than resident rates, but nonresidents do not pay school district Earned Income Taxes, and the combination of the two generally yields a higher combined rate than the one paid by nonresidents.
Share this article