Key Findings
- Consumption taxes are a significant source of revenue for governments across the world, making up 32.3 percent of taxA tax is a mandatory payment or charge collected by local, state, and national governments from individuals or businesses to cover the costs of general government services, goods, and activities. revenues in OECD countries in 2019.
- Despite the potential of consumption taxes as a neutral and efficient source of tax revenues, many governments have implemented policies that are unduly complex and have poorly designed tax bases that exclude many goods or services from taxation, or tax them at reduced rates.
- Value-added taxes and sales taxes are ripe for reform to avoid distorting consumption patterns and raise revenue in a stable manner.
- Excise taxAn excise tax is a tax imposed on a specific good or activity. Excise taxes are commonly levied on cigarettes, alcoholic beverages, soda, gasoline, insurance premiums, amusement activities, and betting, and typically make up a relatively small and volatile portion of state and local and, to a lesser extent, federal tax collections. revenues tend to be volatile and should be specifically designed to target the societal costs associated with certain products and the revenue used to mitigate negative impacts of taxed activities like smoking and pollution.
- Policymakers should ensure that consumption taxes only apply to final purchases of goods and services and that business inputs are untaxed.
Introduction
Consumption taxes are a major source of revenue for governments around the world. If you purchase something from a grocery store or another retailer it is likely that you will pay tax on that purchase. As with many tax policies, consumption taxes are not uniform across the globe. While they make up one-third or more of the revenue for many of the 37 countries in the Organisation for Economic Co-operation and Development (OECD), this is not true across the board. The United States is a clear outlier by not having a federal consumption taxA consumption tax is typically levied on the purchase of goods or services and is paid directly or indirectly by the consumer in the form of retail sales taxes, excise taxes, tariffs, value-added taxes (VAT), or income taxes where all savings are tax-deductible. and consumption tax revenues making up less than 20 percent of total tax revenues across all levels of government.
Because consumption tax policies play a big role in raising revenue, it is important to understand their design, their impacts, and where governments are choosing better or worse options for raising revenue from purchases.
Policymakers should always be looking to raise revenue in ways that keep compliance costs down and minimize distortions in economic decisions. While consumption tax policy is a natural area for reaching those goals from a theoretical standpoint, this report shows that many governments have made choices that undermine the efficiency of a consumption tax system driven by economic principles.
Consumption Taxes in Brief
Consumption taxes apply to sales of goods or services. There are three main types of consumption taxes: sales taxes, value-added Taxes (VAT), and excise taxes. While sales taxes and VATs usually apply to a broad set of goods and services, excise taxes are targeted at specific products.
Why tax consumption?
Taxes can apply to what people earn, what they save, what they own, and what they buy. Taxes on each activity create distortions that can hurt the productivity of the economy. However, not all taxes create the same distortions. Taxes on labor influence decisions on whether to work or not. The tax burden on savings and investment reduces productive investment.
Consumption taxes also influence decisions and change economic outcomes, but they are less likely to influence decisions to work or invest. Consumption taxes that apply to all purchases result in consumers paying taxes regardless of their income or their work status. A wealthy heir would pay the same taxes on their purchases of a haircut, milk, and eggs as a barber, farmer, or grocery store worker.
Even if the tax rate is set at the same level for all purchases, however, individuals who buy more (or more expensive) goods do pay more in consumption taxes than those who buy fewer (or less expensive) goods. If the wealthy heir buys a yacht, a plane, and a sports car while the barber buys a sedan, the farmer a truck, and the grocery store worker a minivan, then the total consumption taxes paid by the heir would be much greater than the other three.
In this way, the progressivity or regressivity of consumption taxes is connected to purchasing activity rather than the incomes of those who are consuming the goods and services.[1]
From a revenue perspective, consumption taxes can provide a significant and stable source of financing for governments. In economic downturns, consumption activity tends to decline less than incomes, so governments that rely more on revenue from consumption taxes are under less pressure to run significant deficits.[2]
Because consumption taxes do not generally influence business investment decisions and individual decisions to work, they can raise significant revenue without damaging a country’s long-term growth prospects. This does not mean that other consequences do not come along with consumption tax policy decisions. A consumption tax that captures all (or most) final consumption will affect consumer behavior less, and can raise more revenue at lower rates, but governments often provide exemptions that influence consumer behavior. Also, sharp increases in consumption tax rates can lead to price hikes, and excise taxes are specifically designed to influence behavior.
Principles for Designing Good Consumption Taxes
Typically, governments will tax consumption using sales taxes, VATs, or excise taxes. While all three policy tools fall under the consumption tax umbrella, there are several differences in policy design and application among the three.
A few principles can be used to determine whether a sales taxA sales tax is levied on retail sales of goods and services and, ideally, should apply to all final consumption with few exemptions. Many governments exempt goods like groceries; base broadening, such as including groceries, could keep rates lower. A sales tax should exempt business-to-business transactions which, when taxed, cause tax pyramiding. , VAT, or excise tax is well-designed.
Four principles for sales taxes and VAT:
- Only final consumption should be taxed. Business inputs should either be exempt or, as with a VAT, taxes paid on inputs should be credited back to businesses along supply chains.
- All final consumption should be taxed. Exemptions and special rates for certain goods unnecessarily complicate compliance efforts, can distort consumption patterns in unintended ways, and often result in higher tax rates.
- Consumption taxes should only be levied by the jurisdiction where the good or service is consumed.
- Broad-based consumption tax revenues are generally more stable than revenue from income taxes on individuals or businesses.
Three principles for excise taxes:
- The tax should be calibrated to the relative harm or cost of the product being taxed rather than the product’s price, whether that is wear and tear on public roads, pollution, or health.
- Revenue from excise taxes should be appropriated to mitigate the effects of consuming excised goods and services. A tax on road use should be used to fund road maintenance.
- Revenue from excise taxes tends to be volatile since the tax baseThe tax base is the total amount of income, property, assets, consumption, transactions, or other economic activity subject to taxation by a tax authority. A narrow tax base is non-neutral and inefficient. A broad tax base reduces tax administration costs and allows more revenue to be raised at lower rates. is very narrow and they are often designed to change consumer behavior.
A well-designed consumption tax would apply to all final consumption. It would apply whether someone buys a haircut, a vehicle, or groceries. Also, the ideal consumption tax would not apply (or there would be an offset mechanism) if a restaurant bought groceries. Since the groceries are an input for the restaurant, the restaurant’s purchase is not final consumption. However, someone who buys the meal in the restaurant would represent a final consumer.
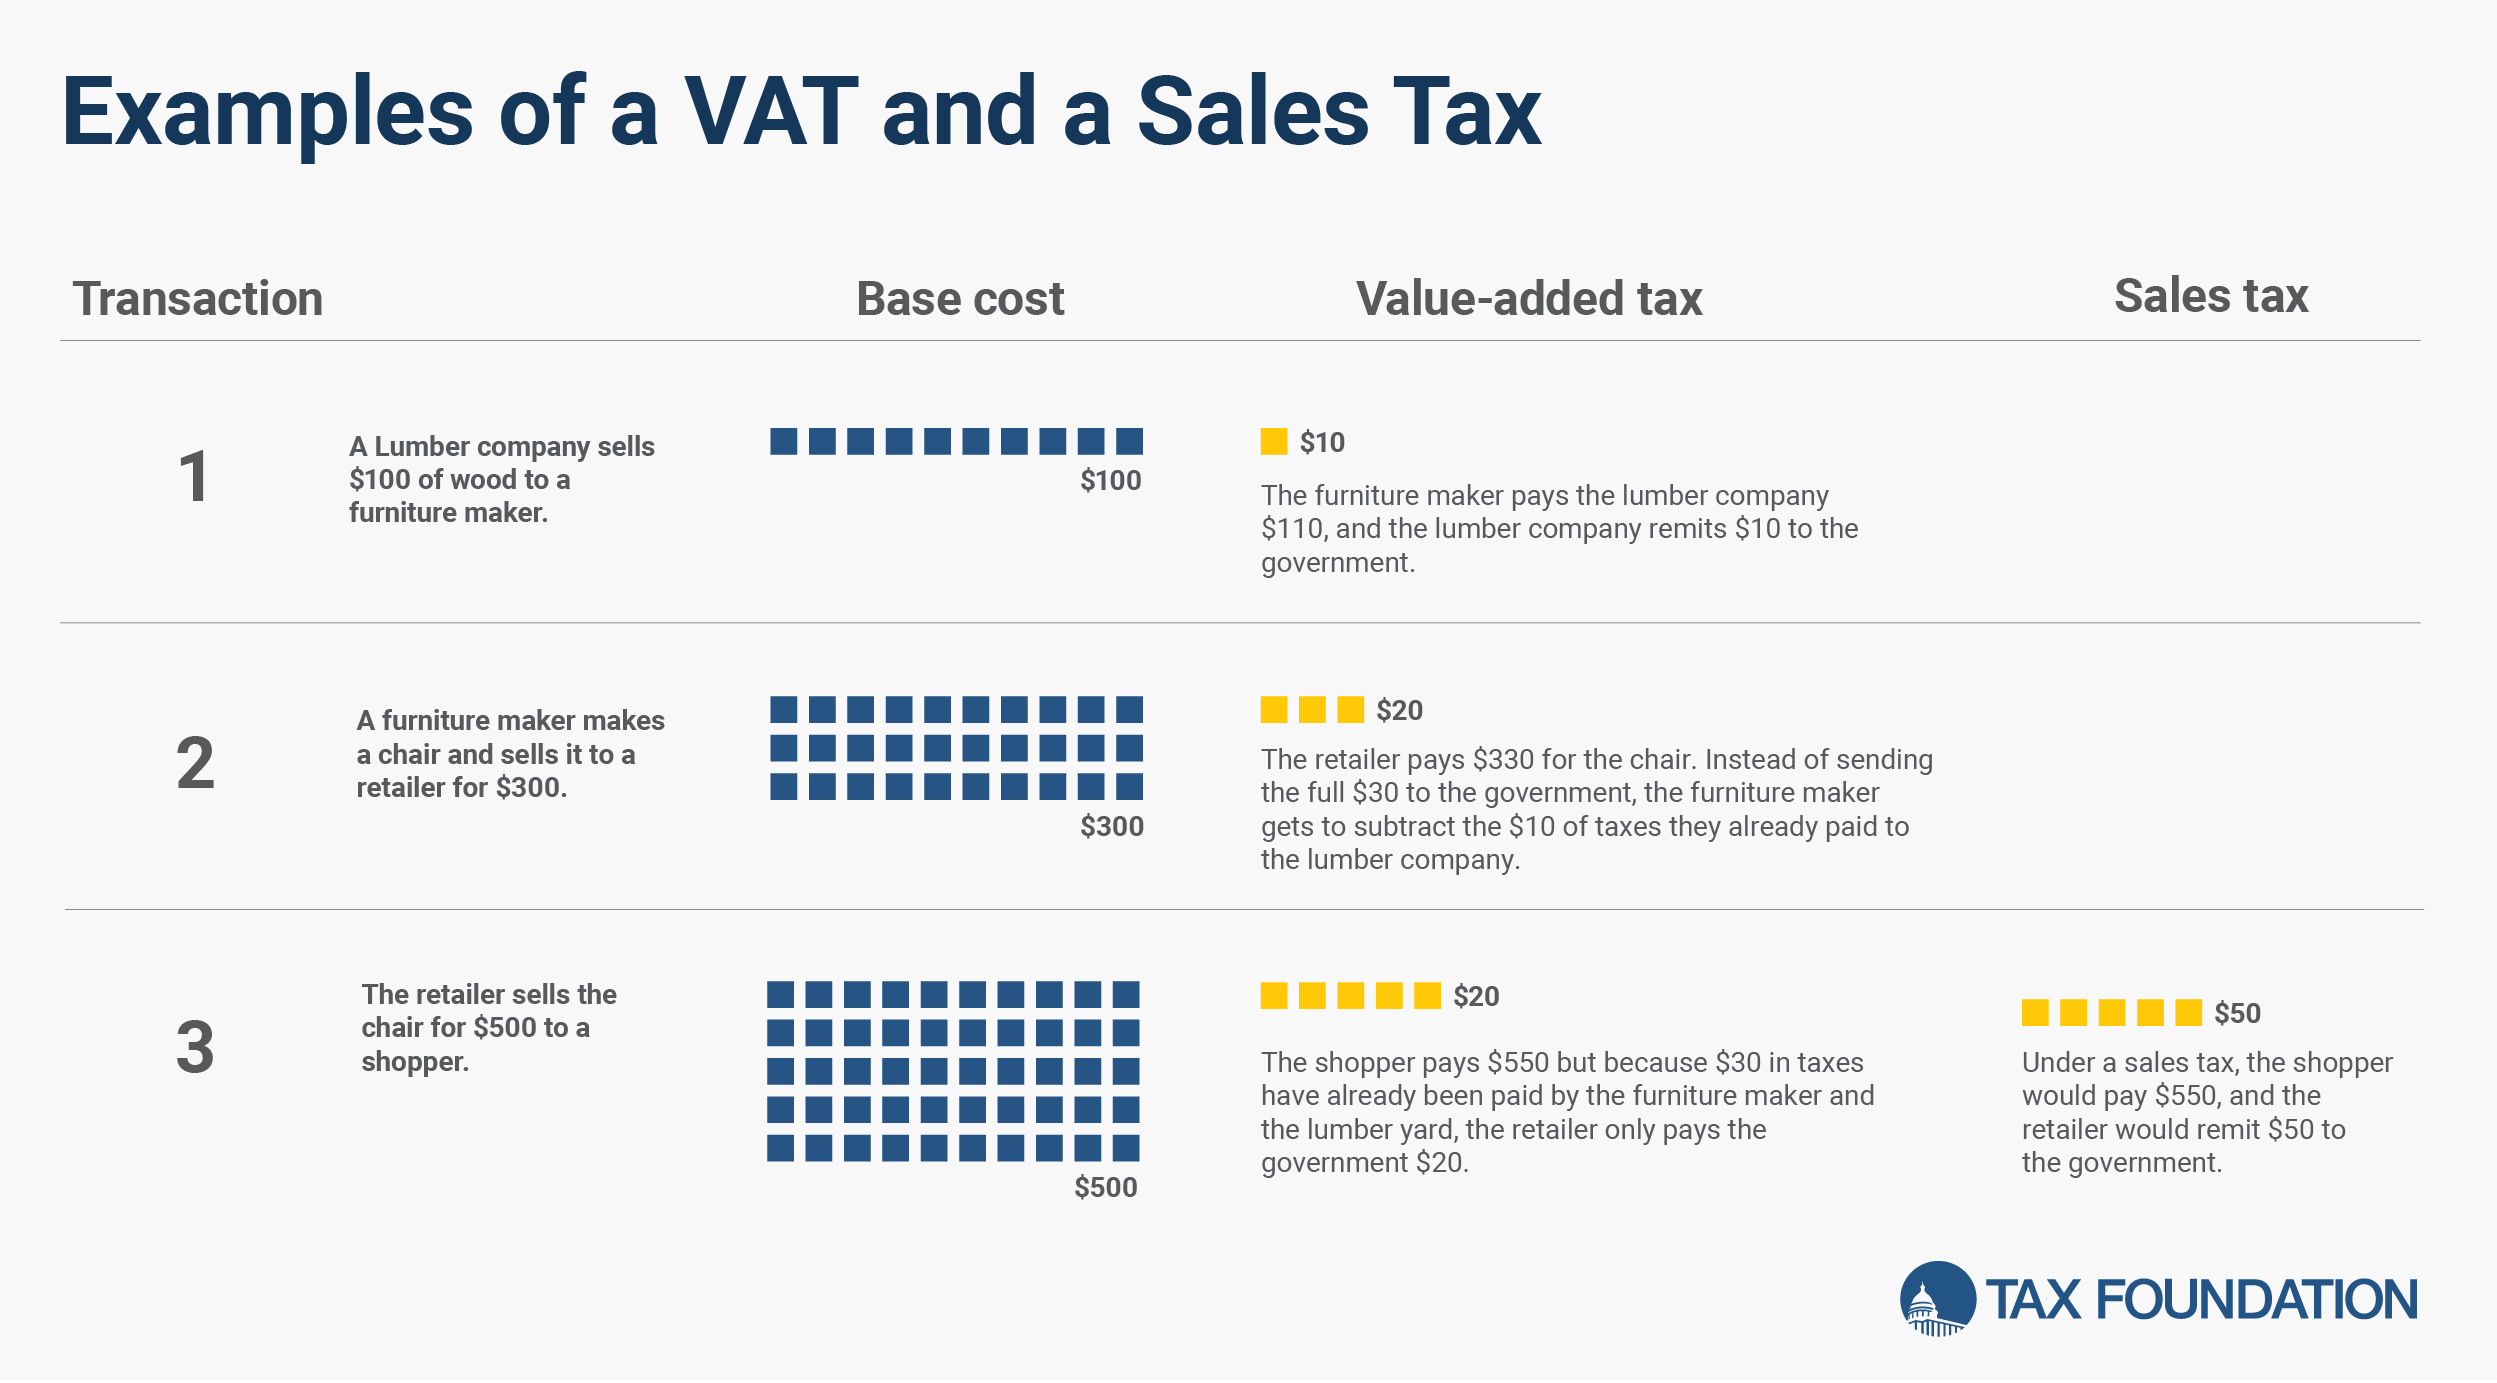
The example in Figure 1 provides an ideal scenario for both VAT and sales tax. The lumber company sells wood to the furniture maker, who then sells the furniture to a retailer. Finally, a shopper buys the furniture. In both cases, the total consumption tax paid is $50.
The example in Figure 1 is the ideal scenario for sales taxes. Unfortunately, many sales taxes apply to both final consumption and business inputs, resulting in what is called “tax pyramiding.” Tax pyramidingTax pyramiding occurs when the same final good or service is taxed multiple times along the production process. This yields vastly different effective tax rates depending on the length of the supply chain and disproportionately harms low-margin firms. Gross receipts taxes are a prime example of tax pyramiding in action. is an economically harmful phenomenon where the tax burden stacks up throughout the production chain. Imagine if the furniture maker and the retailer had to pay sales tax in addition to the shopper. There would be additional 10 percent sales tax at each stage and the total sales tax paid would be $30 higher than in the VAT scenario.
Among U.S. states there are some that have well-designed sales taxes with low rates, relatively little tax pyramiding, and broad bases.[3] These include Wyoming and Wisconsin. However, many U.S. state sales taxes include business inputs and exclude many goods for final consumption. Alabama and Louisiana fare particularly poor when it comes to sales tax design.[4]
VAT are designed to avoid the tax pyramiding problem by providing businesses with tax relief for the VAT they pay on the inputs to their products. In the example in Figure 1, the lumber company remits $10 to the government. However, at the next stage, the furniture maker only remits an additional $20 to the government. The $10 difference is kept by the furniture maker to offset the VAT paid on the first transaction. This sort of arrangement, through the whole supply chain, ensures that at each stage only the additional VAT is remitted to the government.
Among countries in the OECD, some stand out as examples for good VAT policies that have relatively low rates, broad tax bases, and low compliance costs. These include countries like Switzerland, South Korea, Luxembourg, and Japan. However, many countries exempt or provide special, lower rates to many goods and undermine the efficiency of their VAT or have high administrative burdens. These countries include Poland, Hungary, the Czech Republic, and the Slovak Republic.[5]
Excise taxes are taxes on the sale or use of specific goods, but they have a different policy justification. They are most often levied because some activity (smoking, polluting, drinking) has negative impacts on health, the environment, or public safety. These negative impacts are called externalities, and they can have real costs to society.
Excise taxes should be designed according to those costs or risks as a way to account for the negative externalityAn externality, in economic terms, is a side effect or consequence of an activity that is not reflected in the cost of that activity, and not primarily borne by those directly involved in said activity. Externalities can be caused by either the production or consumption of a good or service and can be positive or negative. . Thus, a good excise tax accounts not for the value of a product, but for the costs of the externality. For alcohol products, this means that the alcohol content determines the tax. This, fortunately, is common practice across the OECD where alcohol is taxed according to potency and content. An excise tax aimed at reducing vehicle emissions should be targeted at heavier pollutants—a practice which is not common for taxation of motor fuel. And an excise tax designed to mitigate the health risks of smoking should be tailored to those risks and tobacco products that have higher health risks should be taxed heavier. This principle is well-established in some countries where cigarettes are taxed at higher rates while other less harmful products are taxed at lower rates. Some governments, however, tax all tobacco products at equal rates despite their different harm profiles.[6]
Consumption Tax Revenues in OECD Countries
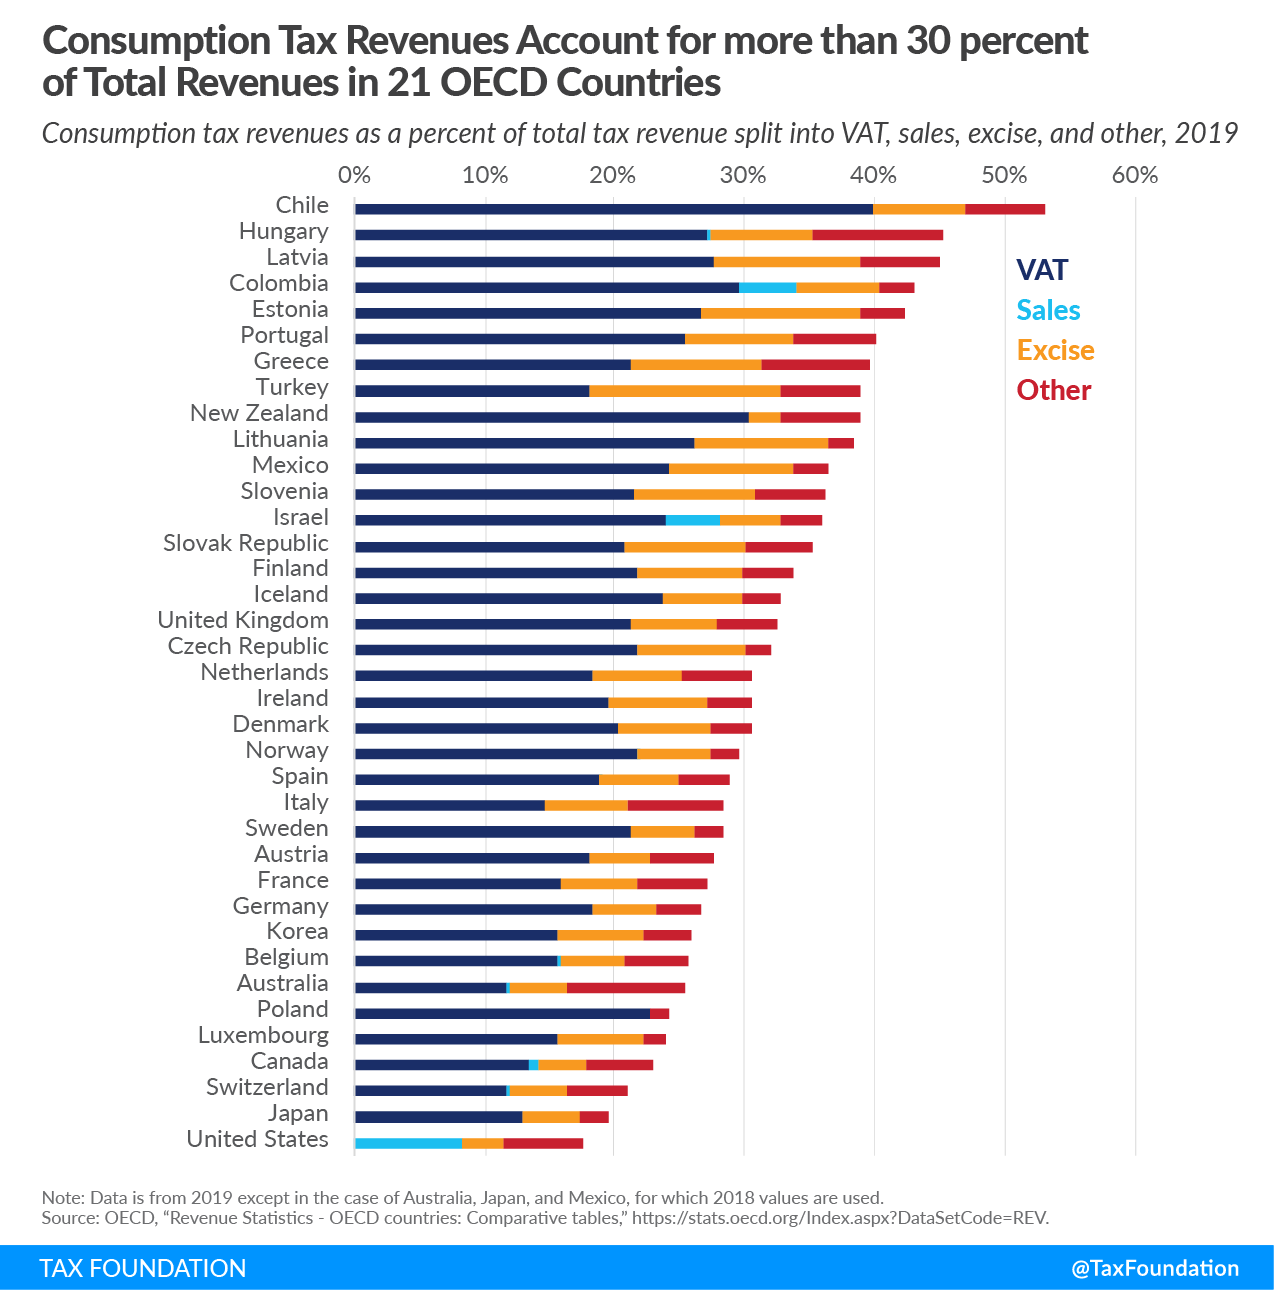
Consumption taxes provide a major source of revenue in OECD countries. On average in 2019, consumption taxes made up 32.3 percent of total revenues in OECD countries. In Chile, 53.1 percent of total revenues were from consumption taxes while in the United States, consumption taxes accounted for just 17.6 percent of total tax revenue.
When measured as a share of GDP, Hungary leads OECD countries with consumption taxes measuring 16.2 percent of GDP. The United States is again at the low end with consumption taxes raising 4.3 percent of GDP.
However, countries vary in the proportion of the consumption tax revenues made up by VAT, sales taxes, or excise taxes as seen in Figure 2.
Sales Tax Revenues
Only 10 of the 37 OECD countries raise revenues from general sales taxes, and the U.S. leads with both the highest share of total revenue (8.2 percent) and revenues as a percent of GDP (2 percent). At the other end of the spectrum Spain collects less than 0.1 percent in sales taxes either as a share of total revenue or as a percent of GDP.
VAT Revenues
OECD countries raise most of their consumption tax revenue through VAT. New Zealand raises the most revenue as a share of GDP (9.8 percent) while Chile raises the largest share of total revenue (39.9 percent). Of the countries that levy a VAT, Australia raises both the least as a share of total revenue (11.7 percent) and GDP (3.3 percent).
Excise Tax Revenues
Excise tax revenues make up a somewhat smaller portion of tax revenue in OECD countries relative to VAT. Turkey raises the most from excise taxes as a share of revenue (14.8 percent) while Estonia takes in the highest as a share of GDP (4 percent). New Zealand raises the lowest share of revenue (2.5 percent) and the United States raises the lowest as a share of GDP (0.8 percent).
Consumption Tax Revenue Trends, 2000-2019
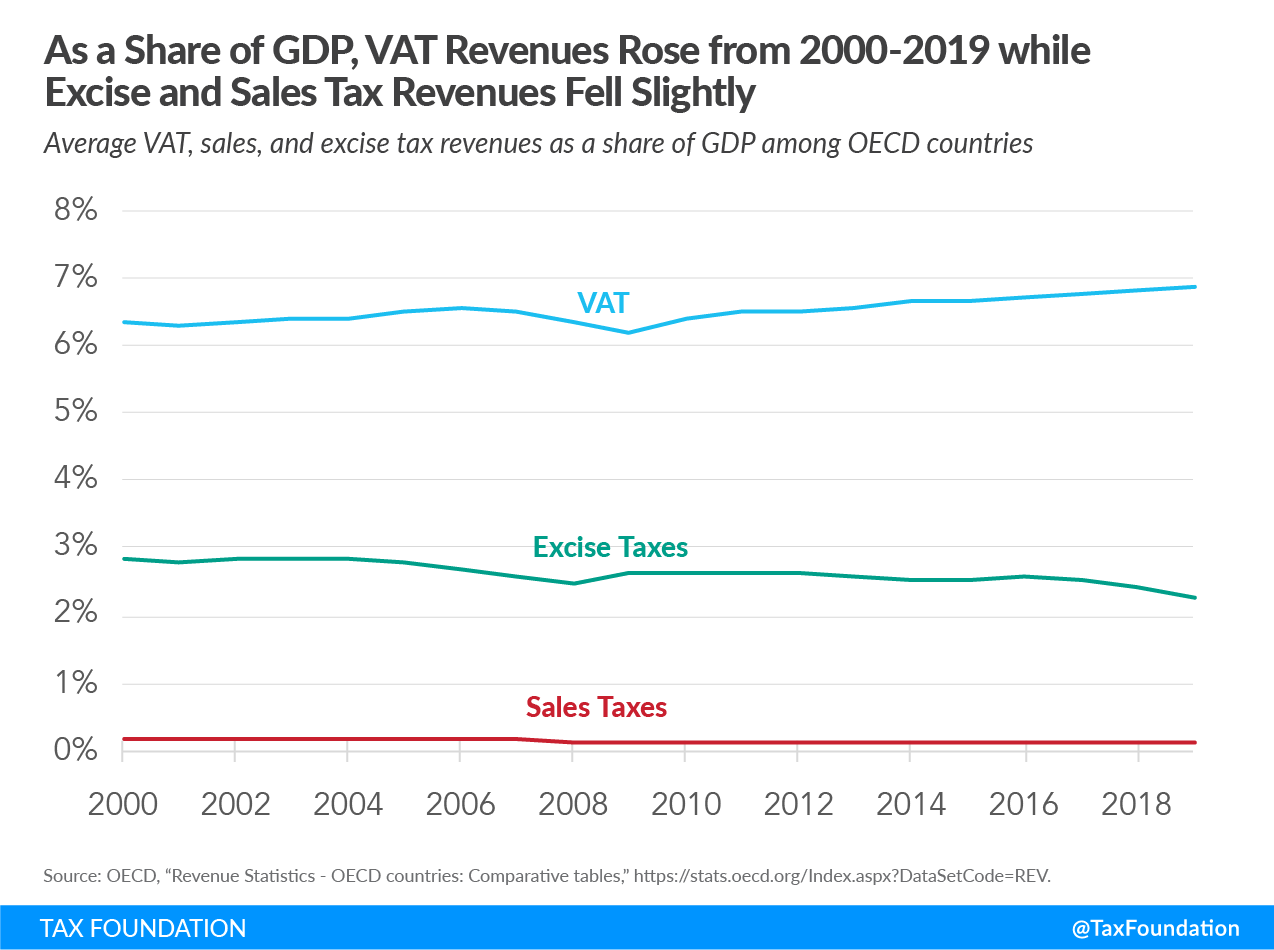
Over the period of 2000-2019, average consumption tax revenues as a share of GDP were relatively stable, ranging between 10 and 11 percent of GDP during the entire period. As a share of revenues, consumption taxes ranged between 32 and 34 percent.
As a share of GDP, sales tax revenues were 0.05 percentage points lower in 2019 than in 2000, VAT revenues were 0.5 percentage points higher, and excise taxes 0.6 percentage points lower.
Throughout this period there were various changes in the underlying tax policies. The average VAT rate in the OECD increased by 1.6 points. Excise tax revenues were impacted by consumer responses to excises on energy sources.
Revenue trends can also be impacted in that VAT often applies to the price, which includes excise taxes. If the VAT rate is increased, the goods subject to both VAT and excise may see lower sales due to price effects. Though a higher VAT rate would result in more consumption tax revenues overall, there could be slightly lower excise tax revenues.
This is not a fixed rule, however. Between 2000 and 2019, Greece and Portugal both increased their VAT rates by 6 points. In both countries, consumption tax revenue as a percent of GDP increased (3.55 points in Greece, 1.28 points in Portugal). In Portugal, this was driven mainly by VAT revenues which increased 1.29 points as a share of GDP, while excise tax revenue fell by 0.6 points. In Greece, however, both VAT revenues and excise tax revenues increased (1.96 points for VAT and 0.98 points for excise).[7]
Value-added Tax
In 1965 consumption tax revenue in OECD countries mainly came from excise and sales taxes. However, the VAT has since become the main consumption tax policy among OECD countries.[8] The trend of VAT adoption began in Europe in the 1960s and has since spread to the extent that 170 jurisdictions across the world levy a VAT,[9] which is now the leading consumption tax not only in terms of revenue but also in terms of geographical coverage. The number of OECD countries that have implemented VAT increased from 13 in 1975 to 36 in 2020 (see Appendix Table 1). The United States is the only country in the OECD that does not levy a VAT.
Standard VAT Rates
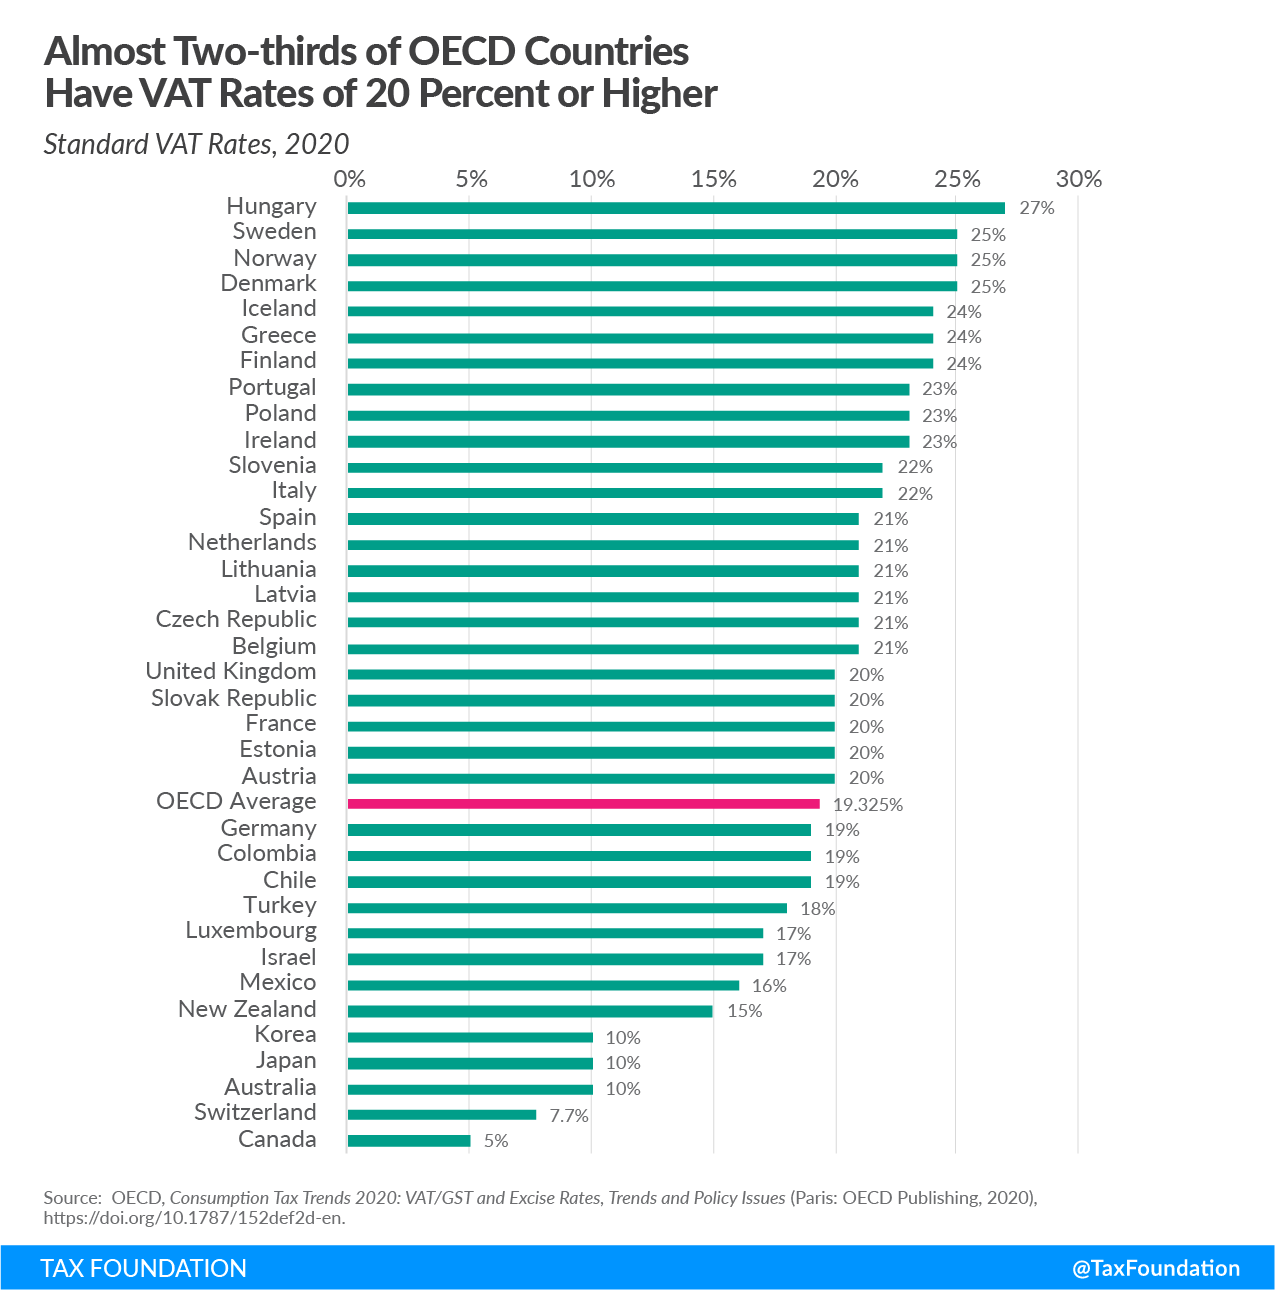
The average standard VAT rate in the OECD is 19.3 percent. Hungary has the highest standard VAT rate at 27 percent, while Canada has the lowest at 5 percent, which is the federal Goods and Services Tax (GST) rate. Some provinces in Canada apply a Harmonized Sales Tax (HST) in addition to the 5 percent federal GST that together sum to 15 percent in New Brunswick, Nova Scotia, Newfoundland and Labrador, and Prince Edward Island, and 13 percent in Ontario.[10]
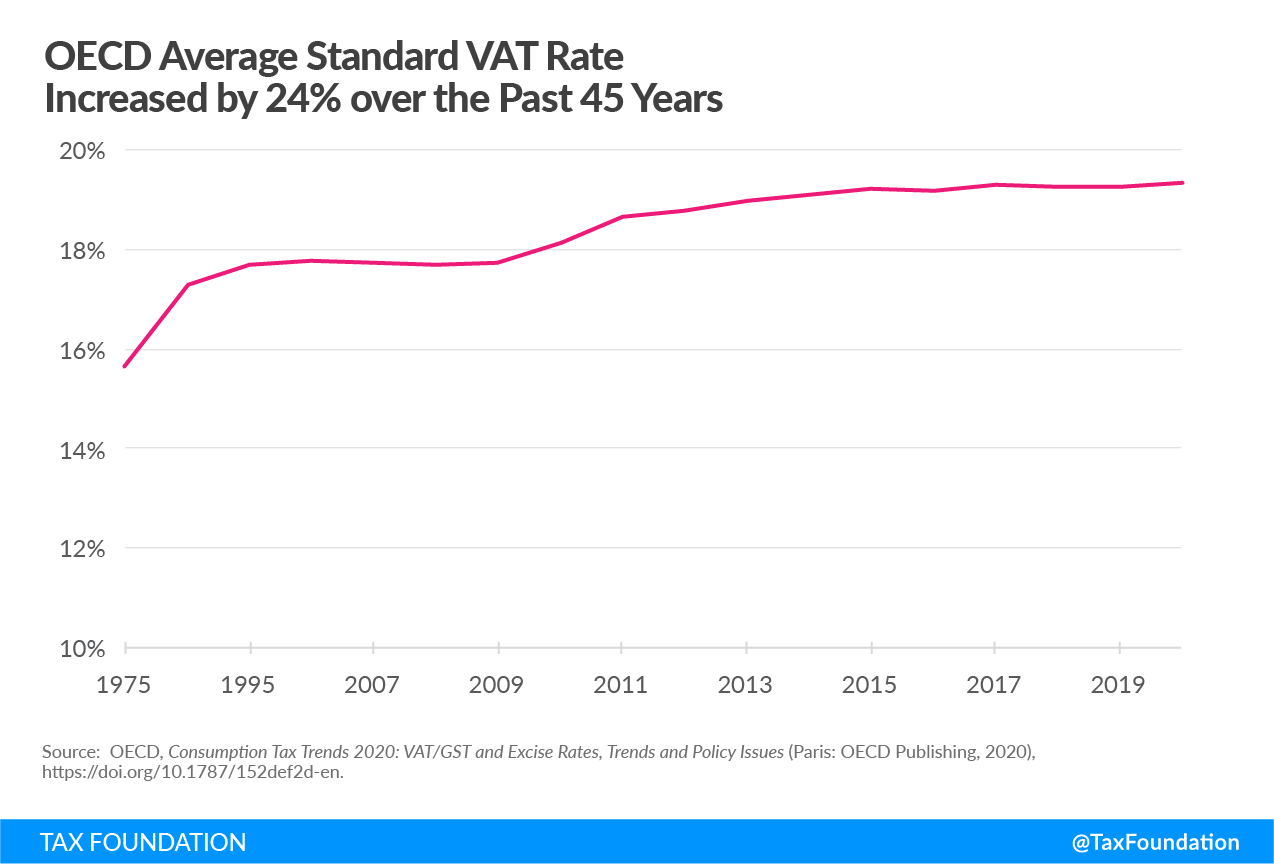
The average VAT rate in the OECD increased from 15.6 percent in 1975 to 19.3 percent in 2020. The average VAT standard rate was relatively stable between 2000 and 2009, and from 2015 to 2020. However, the OECD average rose from 17.7 percent in 2009 to a record level of 19.2 percent in 2015 as many countries raised their standard VAT rates in response to the financial and economic crisis and maintained those higher rates up until today.
Reduced Rates
Except for Chile, all OECD countries apply one or several reduced VAT rates.
Most countries apply VAT reduced rates to goods and services considered necessities like food and water, but also to medicine, health care, education, or housing.
EU member states have a common framework[11] that allows them to apply one or two reduced rates[12] not lower than 5 percent to a number of goods and services[13] and one super reduced rate below 5 percent. Hoverer, only Ireland, France, Spain, Italy, and Luxemburg are currently applying reduced rates below 5 percent.
Apart from reduced rates, all OECD countries make extensive use of exemptions.[14] Public services or activities that serve a social interest like education, health care, postal services, or charities are generally exempted from VAT. Other VAT exemptions refer to financial or insurance services whose tax bases are difficult to determine. However, these activities are normally subject to other specific taxes.
Policymakers will justify reduced rates with arguments that they promote the consumption of certain goods such as cultural products and local labor-intensive sectors like tourism, support low-income households, or address environmental externalities.
However, recent research shows that reduced rates and exemptions are not an effective way of achieving such objectives.[15] They can even be regressive if higher-income individuals consume more of the products that have reduced rates or if it causes increases to the general VAT rate to achieve revenue goals.
Although a reduced VAT rate for food may provide support to the poor, the VAT system is a very poor tool to use for that purpose. Even if the intention is to support those who earn little income, individuals across the income distribution will also benefit from the reduced rates. Therefore, a refundable food tax creditA tax credit is a provision that reduces a taxpayer’s final tax bill, dollar-for-dollar. A tax credit differs from deductions and exemptions, which reduce taxable income rather than the taxpayer’s tax bill directly. or other targeted policies would be more effective than the untargeted reduced VAT rates that have proved to be a poor policy tool for addressing income disparities.[16]
A list of the reduced rates and specific regional rates applied in the OECD is presented in Appendix Table 4.
Registration and Collection Thresholds
As with other taxes, VAT impose compliance costs that can be especially burdensome for small and medium size businesses. For this reason, most OECD countries set exemption thresholds below which small businesses are not required to charge and collect VAT. This means that, unlike businesses above that threshold, they do not collect VAT on their outputs sold to customers but also cannot receive a refund for VAT paid on business inputs.
Although exempting very small businesses saves administrative and compliance costs, unnecessarily large thresholds create a distortion by favoring smaller businesses over larger ones. Also, a low threshold may act as a disincentive for businesses to grow or as an incentive to avoid VAT by artificially splitting activities. A recent study of VAT in the UK found significant bunching of businesses just below the VAT registration threshold.[17]
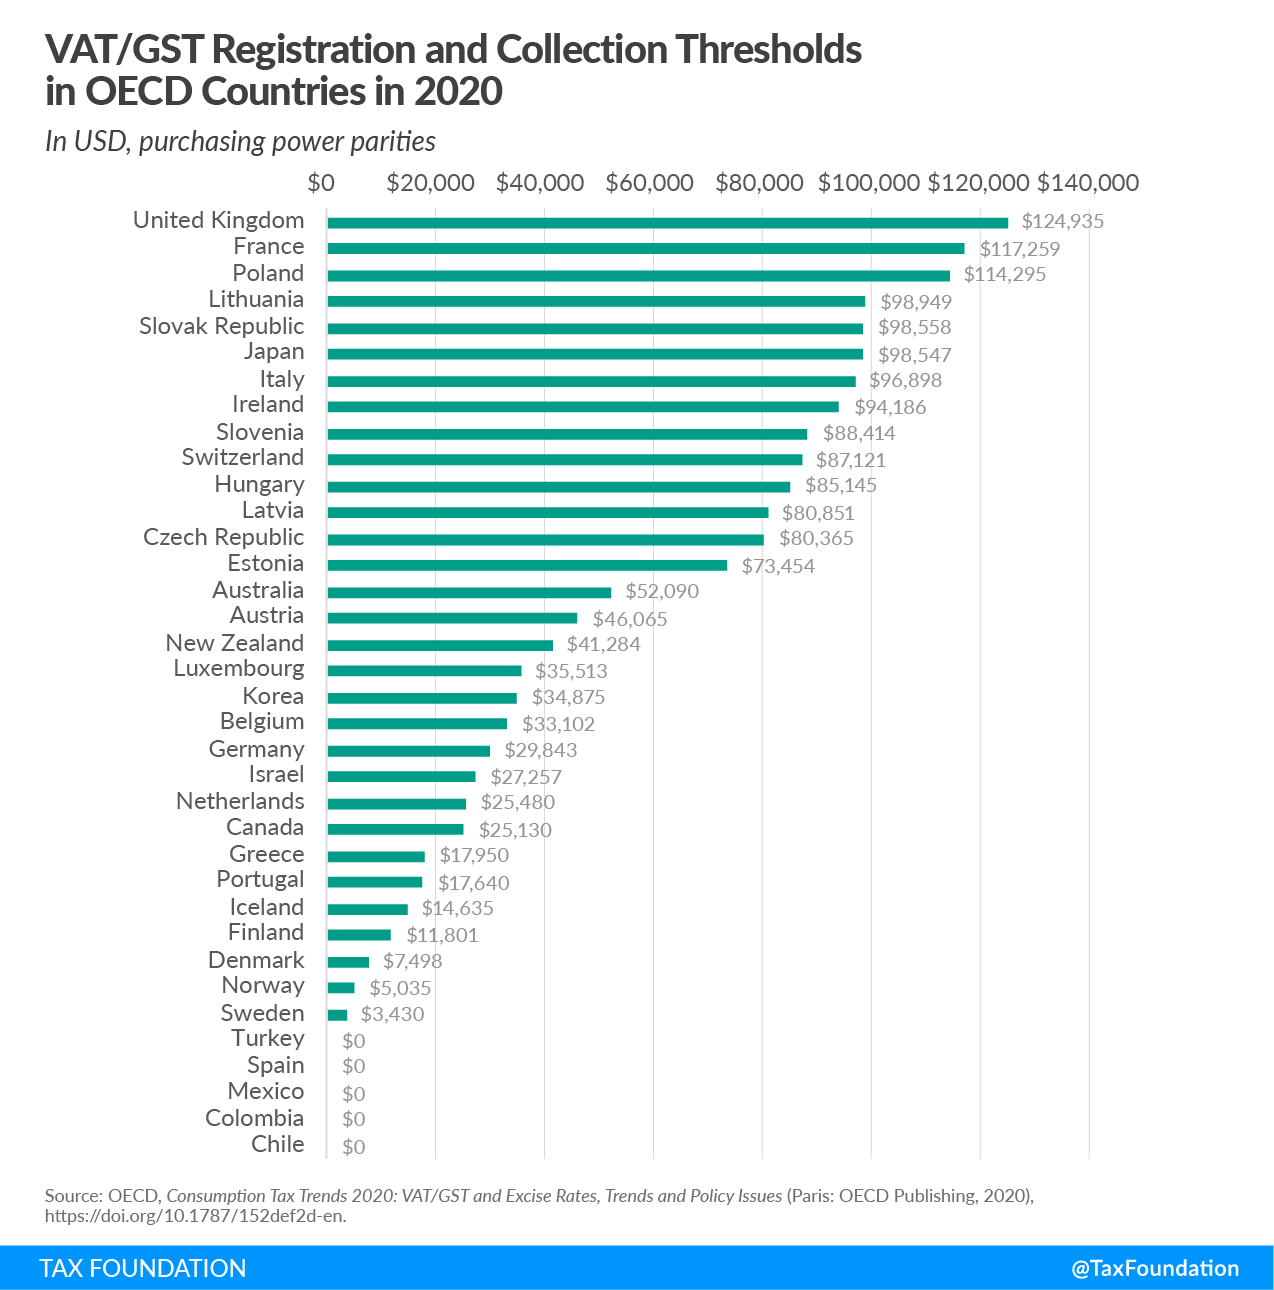
Five countries in the OECD (Chile, Mexico, Spain, Turkey, and Colombia) have no exemption threshold. However, in Colombia and Turkey, the exemption only applies to individuals and not to businesses. On the other hand, the United Kingdom has a VAT threshold of $124,935 that is almost twice the average VAT threshold for OECD countries (approximately $57,020).[18] France, Poland, Lithuania, Slovak Republic, Japan, Italy, and Ireland also have particularly high thresholds of more than $90,000.
VAT Performance: VAT Revenue Ratio
The OECD measures the efficiency of VAT using the VAT Revenue Ratio (VRR). VRR assesses the loss in VAT revenue as a consequence of exemptions and reduced rates, fraud, evasion, and tax planning. To do this, the VRR measures the difference between the VAT revenue actually collected and what would be raised if the standard VAT rate were applied to the entire tax base. Therefore, VRR is the ratio of the actual tax revenue to the maximum possible tax revenue. VRR = VAT Revenue/[(Final Consumption Expenditure – VAT Revenue) x standard VAT rate].
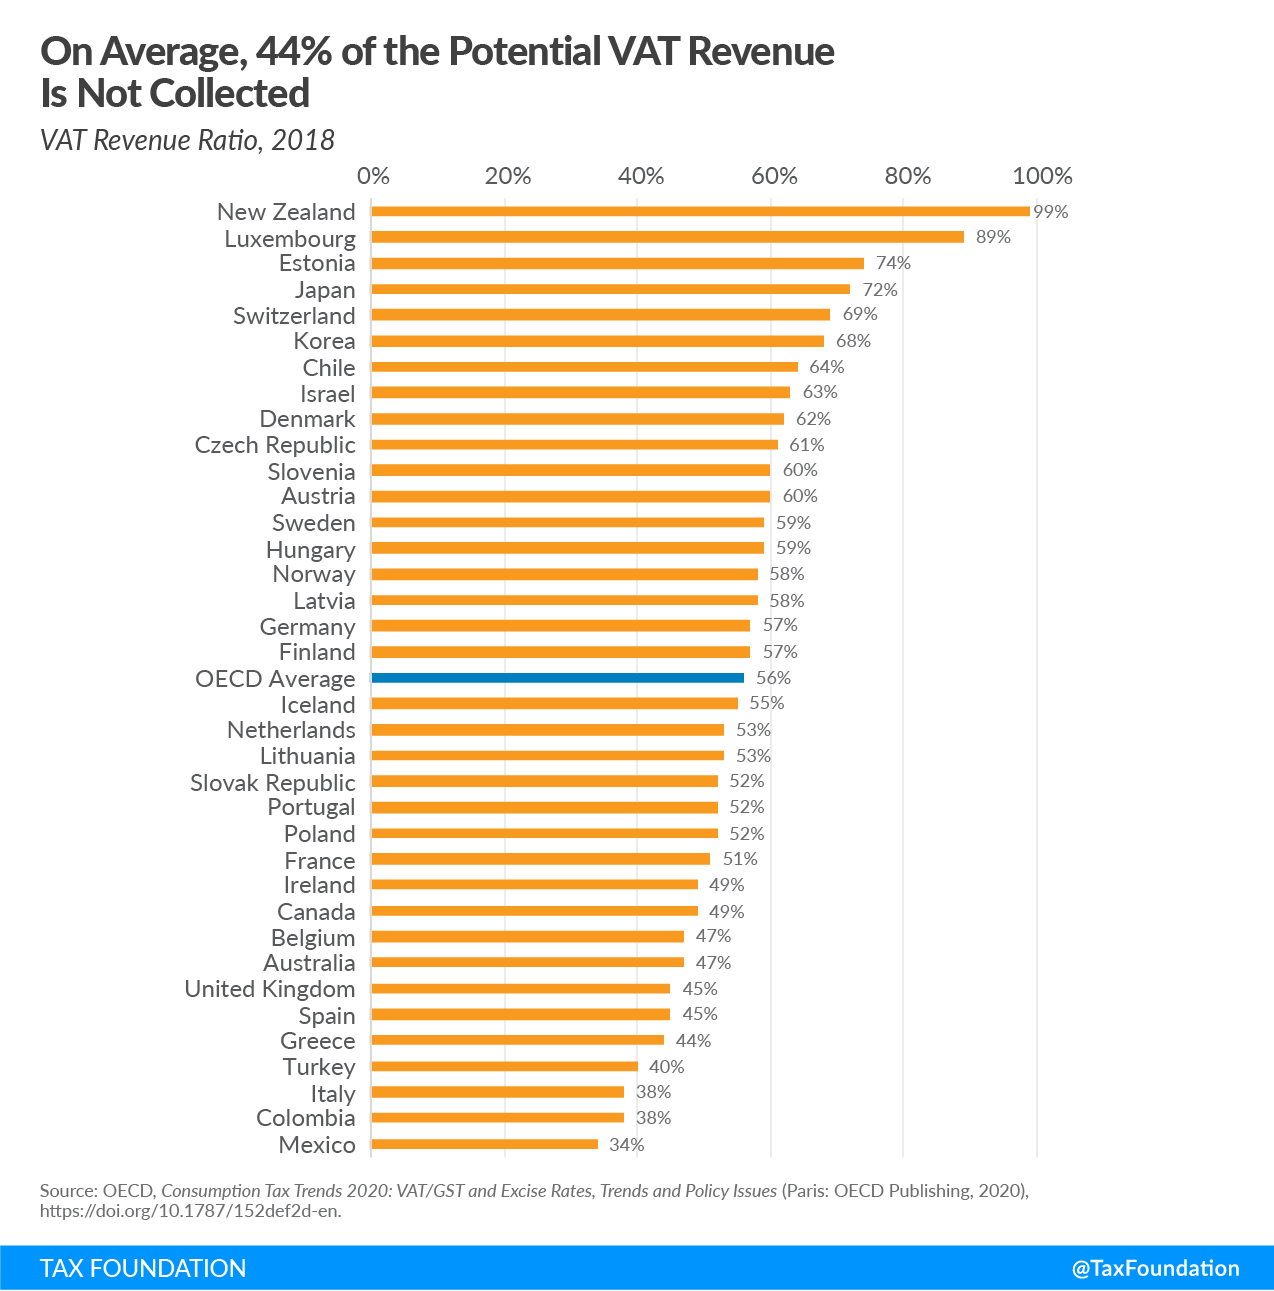
Since 2010 the OECD average VRR has remained relatively stable at around 0.55. In 2018 the average VRR in the OECD was 0.56, suggesting that, on average, 44 percent of the maximum potential VAT revenue is not collected. The VRR varies considerably from one OECD country to another. The lowest VRR level, and least efficient, was registered in Mexico (0.34), and Colombia and Italy (both 0.38). The highest VRR level, and most efficient, was in Luxemburg (0.89) and New Zealand (0.99). The differences in the VRR levels reflect the disparities in the application of reduced rates and exemptions among the OECD countries. VRR levels are also influenced by VAT evasion and avoidance.
There is no direct correlation between the level of the standard VAT rate and the VRR estimates. Australia and Ireland, for example, have VAT standard rates of 10 percent and 23 percent respectively, while they register a similar VRR of 0.47 and 0.49, respectively.
The level of the VRR depends on several factors that can be classified into two main categories. The first includes factors related to the VAT policy design such as the tax base and the coverage of the standard, reduced rate, and exemptions. This is also called the “Policy Gap” because it is directly influenced by policy decisions. The second category includes factors influenced by the level of compliance level and the efficiency of the tax collection. This is called the “Compliance Gap” or “VAT Gap.”
VAT Gap in the EU
The “Compliance Gap” or the “VAT Gap” is estimated for the EU member countries by the Center for Social and Economic Research.[19] The VAT Gap is defined as the difference between the tax collected and the tax that should be collected if all taxpayers, consumers, and businesses fully complied with the VAT rules. The VAT Gap includes not only VAT avoidance or gaps in enforcement but also unpaid VAT due to bankruptcies, insolvencies, or legal tax optimization. It is calculated as the difference between the VAT collected and the theoretical tax liability according to tax law, the VAT total tax liability (VTTL). The indicator is then expressed in relative terms as a percentage of VTTL.
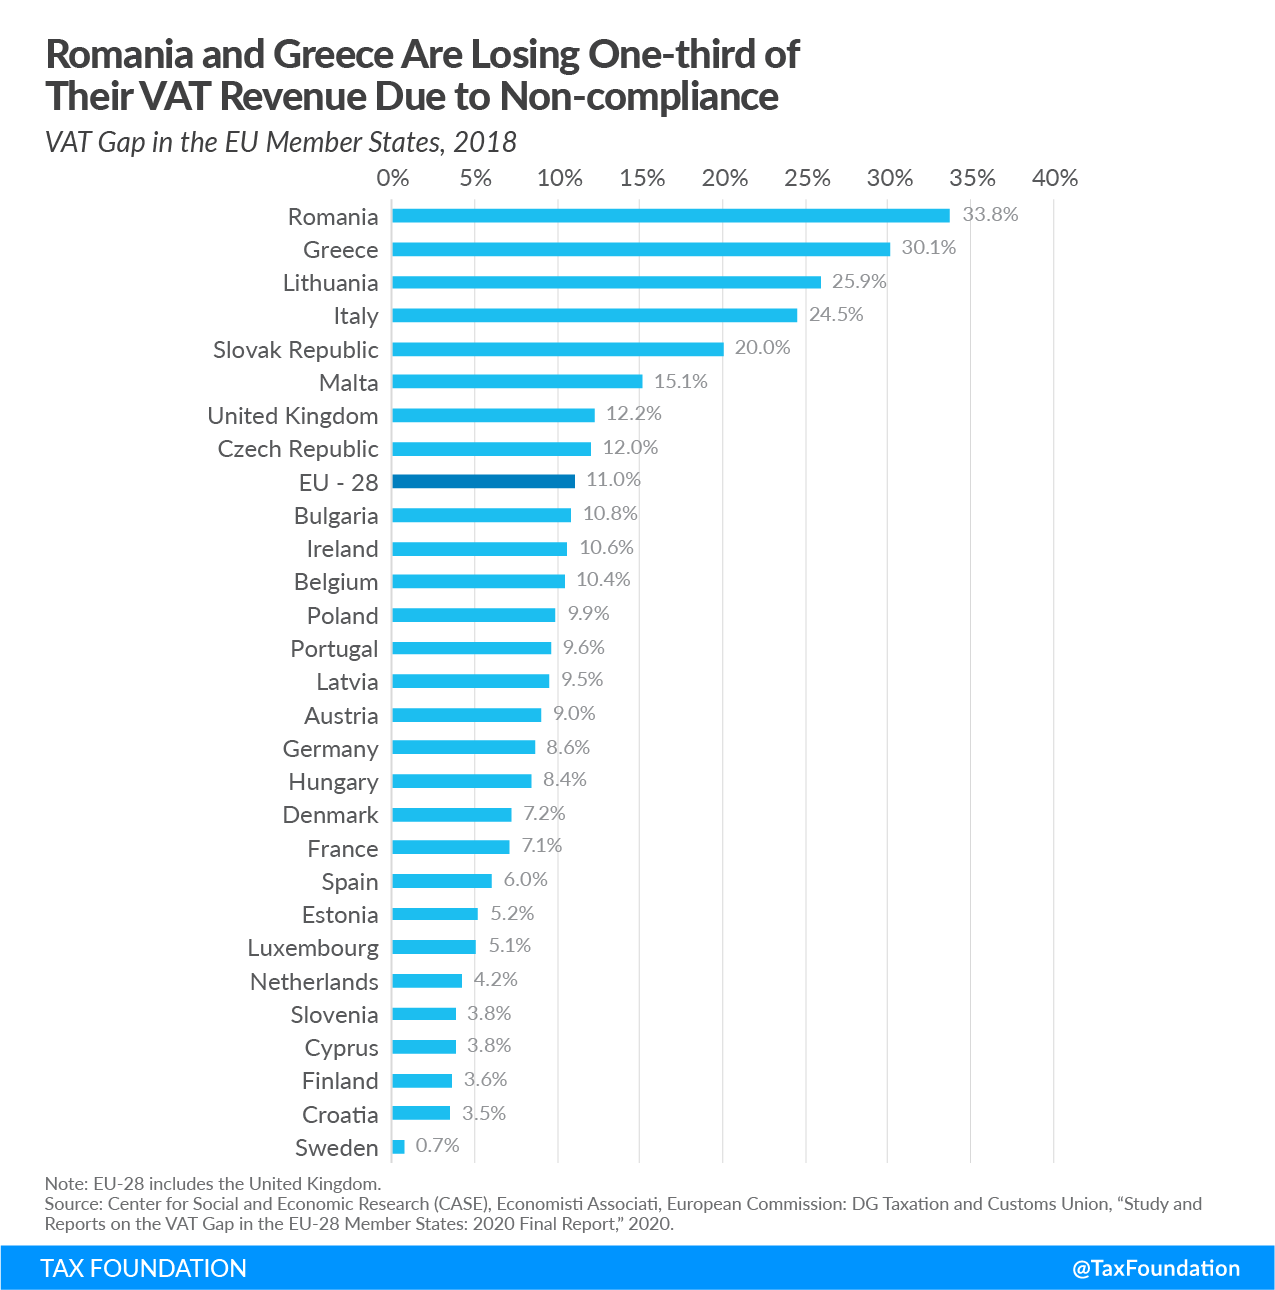
Although the VAT Gap remains relatively high at the EU level, it has dropped during the past four years from 14.3 percent in 2014 to 11 percent in 2018. The smallest VAT gaps occurred in Sweden (0.7 percent), Croatia (3.5 percent), and Finland (3.6 percent). On the other hand, the EU member states with the greatest percentage of VAT left unpaid are Romania (33.8 percent), Greece (30.1 percent), and Lithuania (25.9 percent).
VAT Policy Gap in the EU
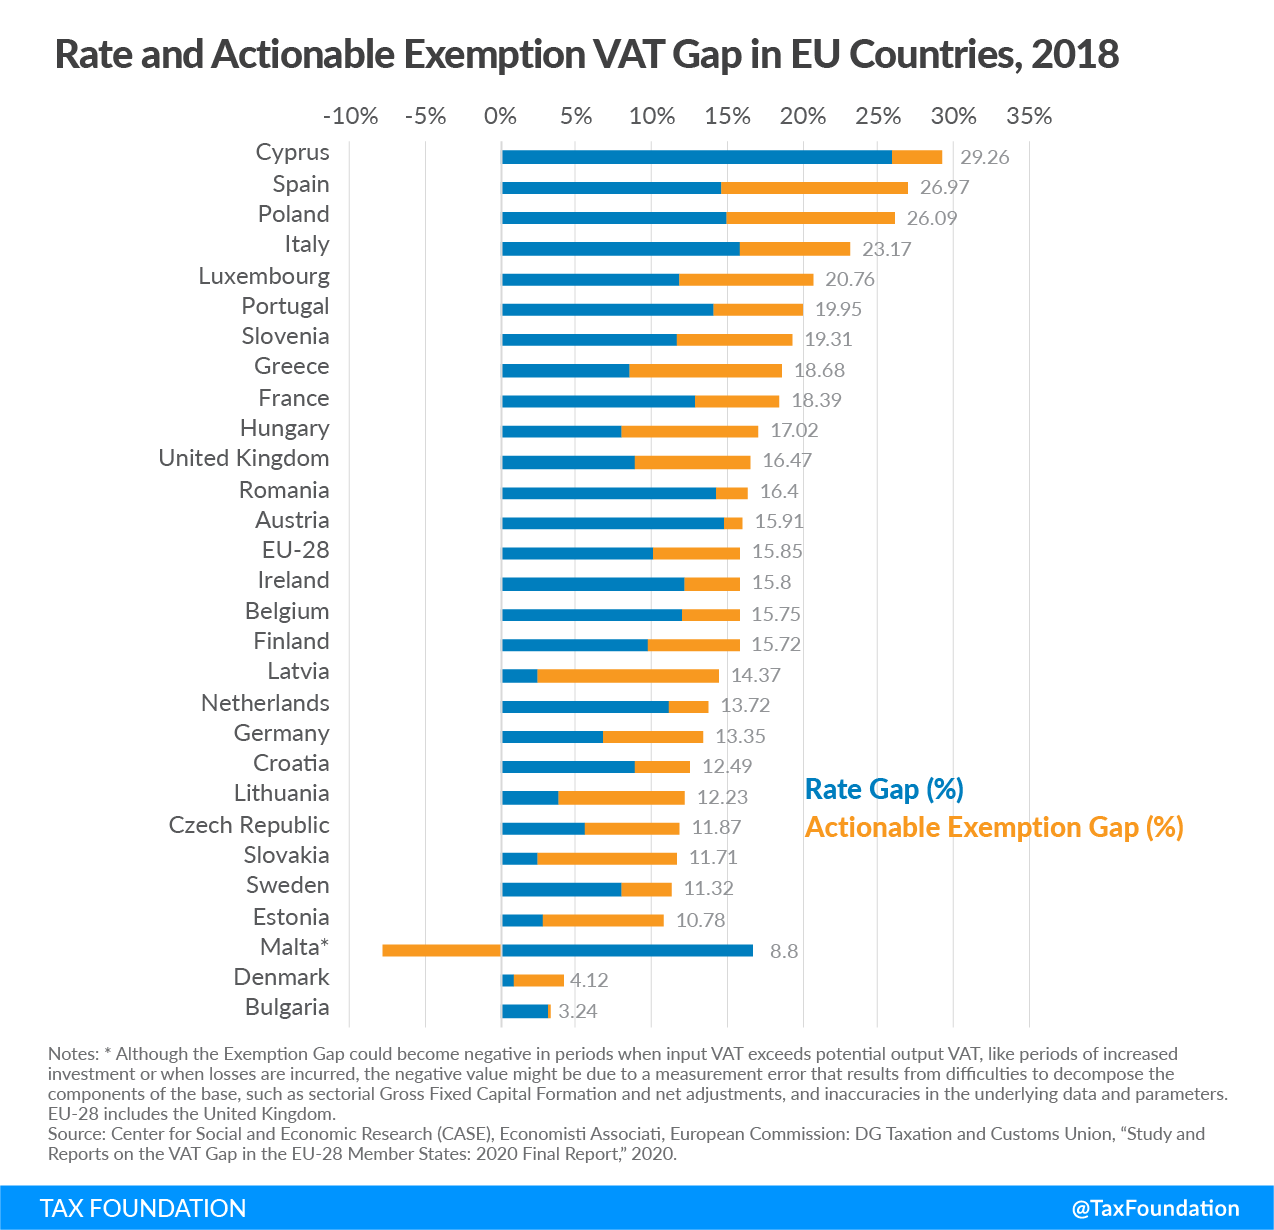
The other factor determining the VAT Revenue Ratio is the Policy Gap. The Policy Gap is an indicator of the additional VAT revenue that could theoretically be generated if a uniform VAT rate is applied to the final domestic use of all goods and services. The Policy Gap has two components: the Rate Gap and the Exemption Gap. The Rate Gap represents the loss in VAT revenue due to reduced VAT rates, and the Exemption Gap is connected to the implementation of exemptions.
The average Policy Gap registered in the EU was 44.24 percent in 2018 (see Appendix Table 3). This means that under full compliance the VAT only generates 55.76 percent of what could have been collected if reduced rates and exemptions were abolished and all final goods and services were taxed. However, the largest part of the Exemption Gap, and therefore of the Policy Gap, is composed of exemptions on services that are often excluded from VAT systems. These include imputed rents, the provision of public goods, and financial services.
Therefore, the average actionable Policy Gap for the EU is 15.84 percent, from which 10.07 percentage points are due to reduced rates (Rate Gap) and 5.77 percentage points to the actionable portion of the Exemption Gap.
The Rate Gap is smallest in countries that rely on reduced rates less, such as Denmark (0.77 percent), Latvia (2.37 percent), and Estonia (2.68 percent). On the other hand, the Rate Gap in Cyprus (25.97 percent) and Italy (15.86 percent) show the significant revenue forgone because of reduced rates.
The highest actionable Exemption Gaps are observed in Spain (12.4 percent), Latvia (12 percent), Poland (11.18), and Greece (10.28). Spain’s Exemption Gap is due to the application of reduced rates of indirect taxes in the Canary Islands, Ceuta, and Melilla.
Sales Taxes
While VAT is a levy that applies to the net value added at each stage of production or distribution, a sales tax is generally a levy on the gross value of a good or service at final sale in the supply chain. In principle, only the final consumer should be charged the sales tax. If this is the case, the outcomes of VAT and sales tax should be identical. The retailers are therefore exempt as they are not the end-users of the products and are normally required to provide the seller with a “resale certificate,” which states that they are purchasing an item to resell it.
However, it is common for businesses to pay sales taxes even if they are not the final consumers of a product or service.
While no OECD country levies a national sales tax, subnational sales taxes are applied in Canada and the United States.
Canada’s Provincial Sales Tax
The federal Goods and Services Tax (GST) and the Harmonized Sales Tax (HST) applied in Canada and its provinces discussed in the previous chapter operate as a VAT, but the Provincial Sales Tax (PST) is a sales tax.
Three provinces in Canada levy PST. The rate is 7 percent in Columbia and Manitoba and 6 percent in Saskatchewan. PST is applied to most purchases of tangible personal property, software, and certain services. PST does not apply to purchases of goods and services acquired for resale, but PST could apply to business inputs that are not acquired for resale and cannot be claimed as a credit.
The sales tax in these provinces is not restricted to local vendors. Saskatchewan expanded its registration requirements for certain out-of-province sellers and British Columbia plans to do the same, starting from April 2021.[20] Online platforms that facilitate and collect the payment or sell in the province of Saskatchewan the products or services taxed under the PST are required to register and collect the PST. Also, sellers of taxable goods located in Canada and sellers of software and telecommunications services located outside Canada will be required to register in British Columbia for PST if their sales in the province exceed CAD 10,000.
| Province | Tax Rate |
|---|---|
| British Columbia | 7.00% |
| Manitoba | 7.00% |
| Saskatchewan | 6.00% |
|
Source: PwC, “Worldwide Tax Summaries,” last updated Dec. 10, 2020, https://taxsummaries.pwc.com/canada/corporate/other-taxes. |
|
How Sales Taxes Work in the United States
In the United States consumers face state-level and local sales taxes in most states. Alaska, Delaware, Montana, New Hampshire, and Oregon do not have statewide sales taxes. Of these, Alaska allows localities to charge local sales taxes. In total, 38 states apply local sales taxes.
Appendix Table 5 provides the state-by-state listing of state and local sales tax rates. The average local rate for each state is a population-weighted average of local sales taxes as of July 1, 2020.
State-level tax rates range from 2.9 percent in Colorado to 7.25 percent in California. The average local sales tax rates range from 0.03 percent in Idaho to 5.22 percent in Alabama. Tennessee has the highest state and local combined tax rates of 9.55 percent, followed by Louisiana with a 9.52 percent rate.
Sales Tax Base
A well-designed sales tax should apply to all final retail sales of goods and services but not intermediate business-to-business transactions in the production chain, as this might result in double taxation or tax pyramiding. However, the application of most state sales taxes in the United States is far from this ideal. The structure of sales taxes, defining what is taxable and non-taxable, varies greatly from one state to another. For example, while most states exempt groceries from the sales tax, others tax groceries at a limited rate, and still others tax groceries at the same rate as all other products. Some states exempt clothing or tax it at a reduced rate.
States tend to include most goods, but relatively few services, in their sales tax bases. All this translates into most state sales tax bases being smaller than ideal. Exemptions result in several negative consequences. First, a small tax base often means that the tax rate on taxed goods must be higher to raise sufficient revenue. Second, exempting services from the sales tax base contributes to the regressivity of the sales tax. Since consumption of personal services tends to be more discretionary than consumption of goods, higher-income individuals spend a greater share of income on services. The national median sales tax base reaches 34.25 percent of personal income.[21] Sales tax breadth, calculated as the ratio of the implicit sales tax base to state personal income, ranges between 22 percent in Massachusetts and 62 percent in South Dakota.
Excise Taxes
This section presents tax rates, structure, and historical comparison of excise taxes in three categories: alcohol, gas, and tobacco. Every OECD member levies an excise tax on one or more of these three products. The subsequent section examines two developing excise tax trends, marijuana taxes and nicotine product taxes, in the OECD.
Unlike general consumption taxes, excise taxes are levied on specific products or transactions, and normally only once early in the value chain. They have a long history that can be traced back to Ancient Egypt, where a tax on cooking oil was levied.[22] In modern times, they have commonly been levied on, among other things, alcohol and tobacco products. Traditionally, excise taxes are levied by quantity, weight, volume, or potency (specific), but some countries include price-based elements (ad valorem) in their excise tax design. Specific tax design may be preferable as they generally deliver a more stable revenue return for governments as price developments do not affect revenue generation. Choice of tax base may also affect product availability: a price-based tax could encourage manufacturers to make cheaper products to limit liability, whereas a specific tax may favor premium and more expensive products.
In Appendix Tables 7 and following tables, tax rates are shown as a percentage of price or in U.S. dollars to allow comparison. Individual countries may, however, utilize both specific and ad valorem components in their design. The differences in tax design are not reflected in the tables.
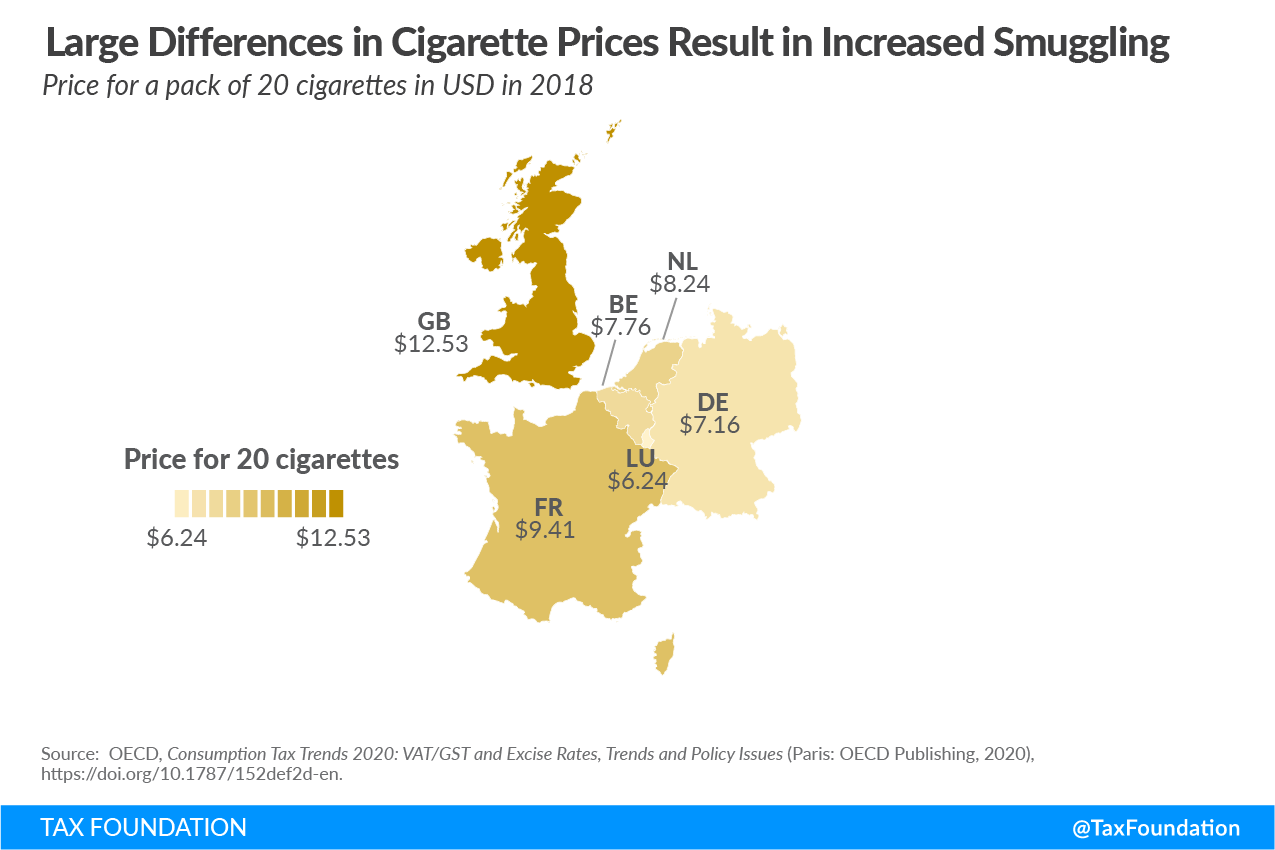
Large discrepancies in excise tax levels between neighboring countries or regions can result in increased border traffic and smuggling.[23] Such tax avoidance can undermine governments’ ability to achieve public health and revenue goals connected to excise taxation of products like alcohol or tobacco.
Alcohol
Alcohol is most often taxed by volume based on categories determined by alcohol content. As such, beer, wine, and spirits are generally taxed at different rates, but certain countries have additional subcategories. All OECD countries tax alcohol products with a specific tax except for Mexico, which taxes exclusively based on value.
Beer is taxed at a relatively low level across the OECD. Israel has the highest rate at $66 per hectoliter (3,380 fluid ounces), which equals just below 25 U.S. cents in taxes for a 12-ounce can of beer. Most other OECD members tax at lower rates. In addition, three-quarters of OECD countries (29 of 37) levy a lower rate on small breweries.[24]
In the wine category, levels vary from U.S. $0 to more than U.S. $6 per liter. Most countries, which use different rates, levy a higher rate for sparkling wine than non-sparkling wine, with Turkey having the highest rate of $1,197.66 per hectoliter of sparkling wine. Four countries (Australia, Chile, Korea, and Mexico) levy an ad valorem tax on wine.[25]
In accordance with Pigouvian principles of internalizing externalities, spirits are taxed at higher rates than beer and wine.[26] Because these products contain a higher percentage of alcohol by volume, it is assumed that they cause greater negative externalities. Iceland levies the highest tax at $12,633 per hectoliter of absolute alcohol, which equals approximately $38 for a 750 ml bottle of 80 proof spirit. Levels have been relatively stable between 2012 and 2020 as an average of OECD countries—2012: $2,836, 2020: $2,951.
Gasoline
All OECD members tax gasoline. For the majority of countries, tax as a percentage of price decreased between 2015 and 2019 (2012 data not available). The price of oil increased between 2015 and 2019 (US $48.66 per barrel in 2015 and US $56.99 in 2019[27]), and since most countries levy a specific tax, the effective rate would have slightly decreased. This effect was largely, but not entirely, offset by VAT, which are levied on retail prices. Finland levied the highest tax as a percentage of price at a rate of 65.4 percent and Mexico levied the lowest effective tax of 13.8 percent. (Mexico levies an ad valorem wholesale-level tax in addition to its VAT.)
Cigarettes
Cigarettes are some of the highest taxed consumer products in the world. Across the OECD, Australia levies the highest excise tax at US $13 per pack of 20 cigarettes. That level is roughly 500 percent of the average, which is US $2.62 per pack of 20 cigarettes.
Excise taxes on cigarettes have generally increased over time. The average was US $1.86 in 2012. Most countries levy a combination of ad valorem and specific taxes on cigarettes (this is a requirement in the EU).[28] To ease comparison, total tax as percentage of retail selling price (RSP) is illustrated for 2020 in Table 6.
The dramatic differences in taxation levels of tobacco between countries and regions have resulted in a significant amount of smuggling. According to KPMG, almost 39 billion smuggled cigarettes were consumed in the EU in 2019, which resulted in lost tax revenue of US $11.5 billion.[29] The UK alone is losing US $6.7 billion.[30]
The small nation of Luxembourg is a good example of what happens when differences in price grow large but distances remain small. In 2018, more than 3 billion cigarettes were sold in Luxembourg—a country with 613,000 residents. If all those were consumed in the country, that would equal almost 5,000 cigarettes per resident per year. More likely, those cigarettes were flowing to the rest of Europe, where prices are higher. In 2018, a pack of 20 cigarettes was US $6.24 in Luxembourg versus US $9.41 in France, US $8.24 in the Netherlands, and US $12.53 in the UK.[31]
In the U.S., states with high state or local taxation have a similar experience. New York state is missing out on $1.2 billion every year due to smuggling rates above 50 percent.[32]
Excise Tax Trends
Vapor Products and Heated Tobacco Products
One of the growing trends in excise taxes across the OECD is taxation of vapor products (also known as electronic cigarettes). Taxation of these products is still relatively new and design varies widely across OECD countries.
Europe
In mid-2020, European Union (EU) member states asked the European Commission (EC) to include novel nicotine products such as heated tobacco products and vapor products in the EU Tobacco Excise Directive.[33] Novel products are currently regulated under the EU Tobacco Products Directive but are not included in the Tobacco Excise Directive, which has not been updated since 2011.
Currently, both heated tobacco and vapor products are taxed (or not taxed) under varying definitions with different bases, but, according to an evaluation, the majority of member states would prefer a harmonized definition and a minimum tax rate.[34] Harmonizing definitions could be a positive step for streamlining taxation regimes across member states. All member states with existing taxes on vapor products have specific taxes per milliliter—though a few member states have added an unfortunate nicotine base to the tax structure (see Table 2). The EC should build on these structures and tax vapor products based on volume.
While most member states tax heated tobacco specifically, several states simply apply existing tobacco products taxes to the product. That has resulted in a variety of bases and rates, including price-based (ad valorem) taxation and high rates.
Norway and Turkey, which are not members of the EU, do not allow import or sale of novel tobacco products. In Switzerland, heated tobacco is taxed at 12 percent of value and vapor products do not yet carry a tax.[35] In Israel, heated tobacco is taxed at 86 percent of value, equal to cigarettes.[36] In Iceland, vapor products are taxed at 0.9 percent of retail value.[37]
| Member State | Tax per Milliliter | Additional Base | Tax in $ per Milliliter |
|---|---|---|---|
| Cyprus | €0.12 | – | $0.13 |
| Denmark | DKK 2.00 | – | $0.30 |
| Estonia | €0.20 | – | $0.22 |
| Finland | €0.30 | – | $0.34 |
| Greece | €0.10 | – | $0.11 |
| Hungary | HUF 55.00 | – | $0.18 |
| Italy | €0.08 | €0.04 for liquid without nicotine | $0.09 |
| Latvia | €0.01 | plus €0.005 per mg of nicotine | $0.01 |
| Lithuania | €0.12 | plus €0.05 per mg of nicotine | $0.13 |
| Poland | PLN 0.50 | – | $0.13 |
| Portugal | €0.30 | – | $0.34 |
| Romania | RON 0.50 | – | $0.12 |
| Slovenia | €0.18 | – | $0.20 |
| Sweden | SEK2.00 | – | $0.21 |
|
Source: European Commission, World Bank, and Vaporproductstax.com. Note: Member states not mentioned do not have a specific tax category or rate for vapor products. VAT is not included above. |
|||
Americas
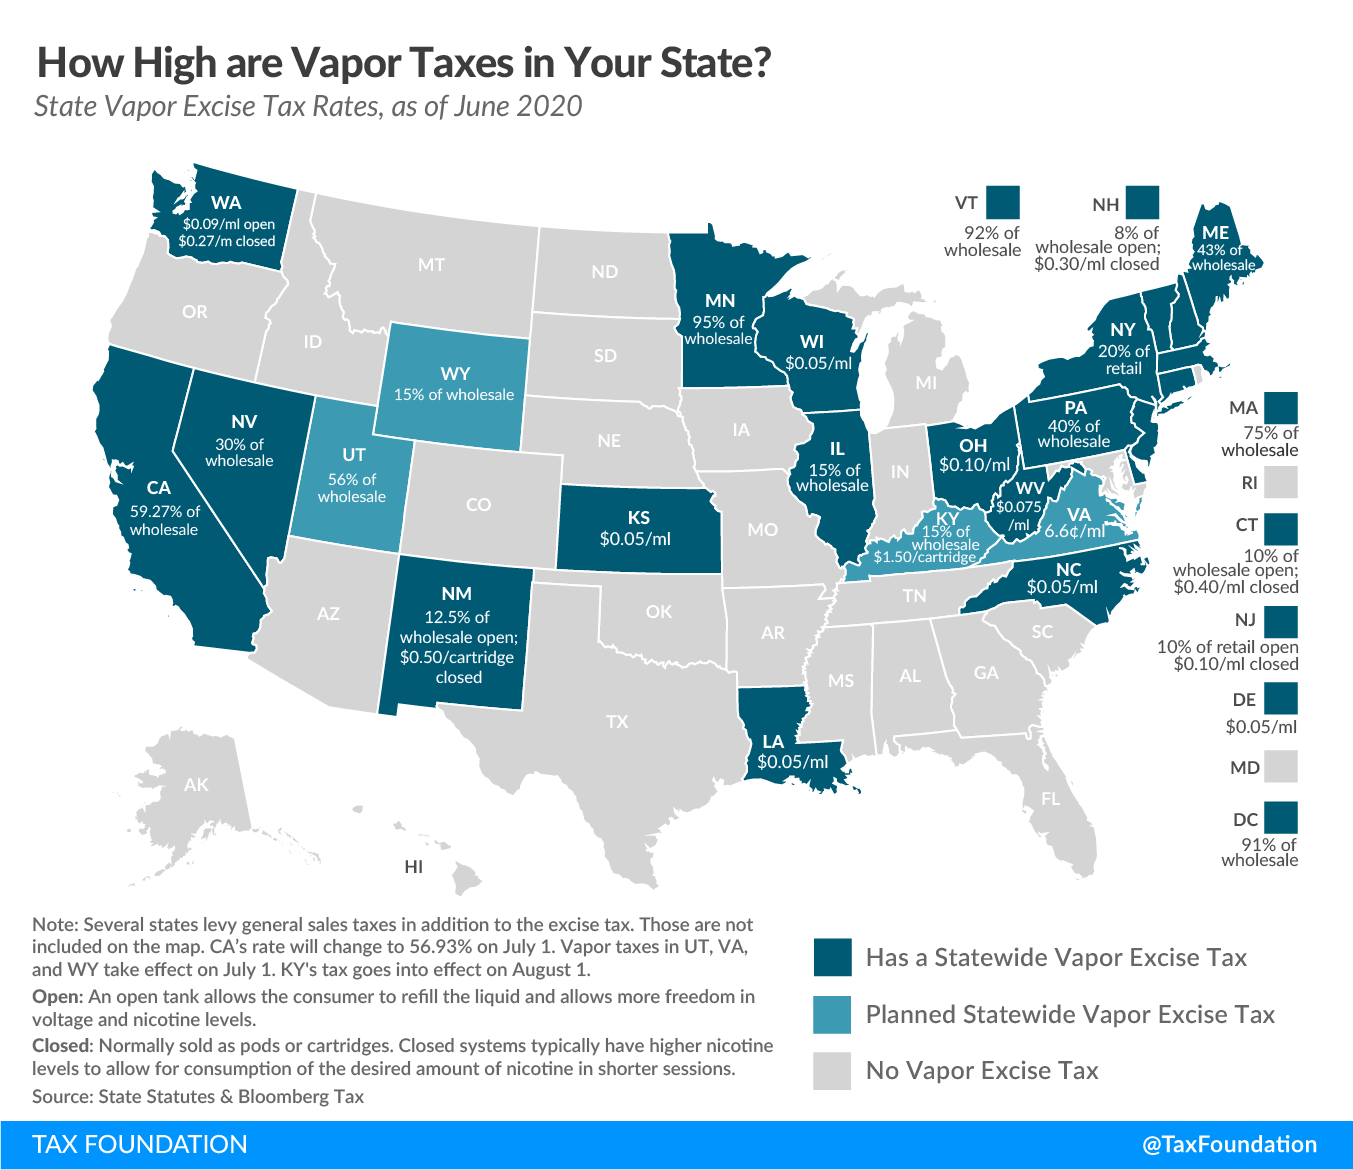
Currently, the U.S. states and federal government define vapor products and heated tobacco in different ways, which affects how the tax is imposed. In some states, vapor products are defined as tobacco products and, in others, they have their own definition. The U.S. federal government does not impose a tax on vapor products.
Heated tobacco is commonly taxed as cigarettes (only Virginia has a separate definition).
Several provinces in Canada levy a vapor tax. In British Columbia, Alberta, and Newfoundland and Labrador the tax is 20 percent of retail price. The Canadian federal government does not impose a tax on vapor products.
In Canada, heated tobacco is taxed by weight which, at the federal level, is set at C $7.76 per 50 grams. Even though packs of heated tobacco rarely contain 50 grams, the tax level remains the same. In other words, because of how the tax is structured, the C $7.76 functions as a minimum price. In addition to the federal tax, provinces also levy taxes as well as general sales taxes on the products.[38]
Although use is permitted, imports and sale of vaping products and heated tobacco products is illegal in Mexico.[39] In both Chile and Colombia, sale of vapor products is illegal (vapor products can be sold as medicinal products in Chile).[40]
Asia and Oceania
In Asia and Oceania, two (Australia and Japan) out of four OECD countries have banned the use of vapor products. Australia only allows nicotine consumption for recreational consumption in products for smoking, effectively banning both heated tobacco products and vapor products. The same used to be the case in New Zealand, but that changed in 2017 when vapor products were legalized to support smokers’ switch to less harmful products.[41]
South Korea levies a number of excise taxes on both heated tobacco and vapor products.
| Country | Excise Tax Rate (USD) | Additional Taxes | Category |
|---|---|---|---|
| Australia | Banned | Banned | Banned |
| Japan | 159 per kilogram | 30 percent of retail price before VAT | Heat-not-burn |
| New Zealand | Banned | Banned | Banned |
| South Korea | 0.081 per gram | Education tax: $0.034 per gram | Inhaling tobacco products using electronic devices |
|
Source: Vaporproductstax.com; “International Tobacco Control (ITC) Survey”; Japan Customs. |
|||
| Country | Excise Tax Rate (USD) | Additional Taxes | Category |
|---|---|---|---|
| Australia | Banned | Banned | Banned |
| Japan | Banned | Banned | Banned |
| New Zealand | Not levied | N/A | N/A |
| South Korea | 0.58 per ml | National Health Promotion Fund: $0.48 per ml; individual consumption tax: $0.34 per ml; local education tax: $0.25 per ml; Green Fund tax: $0.022 per 20 cartridges | Vapor liquid |
|
Source: Vaporproductstax.com; “International Tobacco Control (ITC) Survey.” |
|||
Recreational Marijuana
Another developing tax issue across the OECD is marijuana taxes. So far, 15 states in the U.S., Canada and the Netherlands allow (or tolerate) sale and consumption of recreational marijuana. Moreover, several nations are considering legalizing: New Zealand recently voted against a ballot measure to legalize, and Mexico’s and Israel’s legislatures are moving legislation which would legalize. Additionally, several other OECD members have decriminalized possession.
In the Netherlands, excise taxes are not levied as the product is technically illegal. However, general taxes are imposed on marijuana businesses (coffee shops). In the U.S., excise taxes on recreational marijuana are, so far, in a developmental stage. Most states in the U.S. impose price-based taxes as they are considered simpler.[42]
| State | Structure | Excise Tax Rate |
|---|---|---|
| Alaska | Specific | $50/oz. mature flower; $25/oz. immature flower; $15/oz. trim; $1 per clone |
| Arizona | Ad valorem | 16% excise tax (retail price) |
| California | Mixed | 15% retail excise tax; $9.65/oz. flower; $2.87/oz. leaves cultivation tax; $1.35/oz cannabis plant |
| Colorado | Ad valorem | 15% excise tax (levied at wholesale by weight at average market rate); 15% excise tax (retail price) |
| Illinois | Potency (ad valorem) | 7% excise tax of value at wholesale level; 10% tax on cannabis flower or products with less than 35% THC; 20% tax on products infused with cannabis, such as edible products; 25% tax on any product with a THC concentration higher than 35% |
| Maine | Mixed | 10% excise tax (retail price); $335/lb. flower; $94/lb. trim; $1.50 per immature plant or seedling; $0.30 per seed |
| Massachusetts | Ad valorem | 10.75% excise tax (retail price) |
| Michigan | Ad valorem | 10% excise tax (retail price) |
| Montana | Ad valorem | 20% excise tax (retail price) |
| Nevada | Ad valorem | 15% excise tax (levied at wholesale by weight at Fair Market Value); 10% excise tax (retail price) |
| New Jersey | TBD | TBD |
| Oregon | Ad valorem | 17% excise tax (retail price) |
| South Dakota | Ad valorem | 15% excise tax (retail price) |
| Vermont | Ad valorem | 14% excise tax (retail price) |
| Washington | Ad valorem | 37% excise tax (retail price) |
|
Sources: State statutes; Bloomberg Tax. Note: District of Columbia voters approved legalization and purchase of marijuana in 2014 but federal law prohibits any action to implement it. In 2018, the New Hampshire legislature voted to legalize the possession and growing of marijuana, but sales are not permitted. Alabama, Connecticut, Georgia, Idaho, Illinois, Iowa, Kansas, Kentucky, Louisiana, Massachusetts, Minnesota, Nebraska, North Carolina, Oklahoma, Rhode Island, South Carolina, and Tennessee impose a controlled substance tax on the purchase of illegal products (the tax is normally levied on a person in possession of controlled substances). Several states allow local taxes as well as general sales taxes on marijuana products. Those are not included here. |
||
In Canada, marijuana is taxed at either a flat rate or by price depending on which is greater. Infused products are taxed by THC content.
| Product type | Flat-rate Tax (USD) | Price-based Tax (Ad Valorem) | Additional Flat-rate Tax (USD) | Additional Price-based Tax (Ad Valorem) |
|---|---|---|---|---|
| Flower material | 0.20 per gram | 2.5% | 0.59 per gram | 7.5% |
| Non-flower material | 0.59 per gram | 2.5% | 0.59 per gram | 7.5% |
| Seed | 0.20 per seed | 2.5% | 0.59 per seed | 7.5% |
| Vegetative plant | 0.20 per plant | 2.5% | 0.59 per plant | 7.5% |
| Cannabis oil, edibles, extracts, and topicals | 0.0020 per milligram of total THC | 0.0059 per milligram of total THC | ||
|
Source: Canada Revenue Agency. Note: The additional rate payable is determined by which province the product is sold in. A full explanation of calculation methods can be found at https://www.canada.ca/en/revenue-agency/services/forms-publications/publications/edn55/calculation-cannabis-duty-additional-cannabis-duty-cannabis-products.html#_Toc523301215. |
||||
More OECD members are likely to establish legal markets for recreational marijuana in the years to come and designing excise taxes will be crucial to those markets’ success or failure. The tax burden must account for the fact that licensed recreational marijuana growers and retailers must compete with illicit operators. At the same time, lawmakers may be tempted to try to maximize revenue from this new source. In addition, there will be some cost associated with establishing a regulatory framework for a legal market which tax revenue and fees should cover.
Conclusion
Because consumption taxes are such significant contributors to government revenues, policymakers should pay particular attention to how efficiently (or not) those revenues are being raised. Governments should work to ensure that VAT policies apply to broad bases and reduced rates and exemptions are minimized if not eliminated. The same is true in areas where sales taxes are in operation, but, additionally, laws should be changed to ensure that business inputs are excluded from the tax base. Finally, excise taxes should be calibrated to harm and revenues used to mitigate those harms. Consumption taxes are a powerful tool for raising revenue and governments should steward that tool to avoid undermining its potential or creating unnecessary compliance costs and distorting behavior.
Stay informed on the tax policies impacting you.
Subscribe to get insights from our trusted experts delivered straight to your inbox.
SubscribeAppendix
To see the full Appendix tables, click the “Download PDF” link at the top of the report.
[1] Many VAT systems are proportional to consumption and regressive relative to income. For comparable measures of progressivity for VATs, see Alastair Thomas, “Reassessing the Regressivity of the VAT,” OECD Taxation Working Papers No. 49, Aug. 10, 2020, https://doi.org/10.1787/b76ced82-en.
[2] For comparisons of tax revenues during the recessionA recession is a significant and sustained decline in the economy. Typically, a recession lasts longer than six months, but recovery from a recession can take a few years. of 2008-09, see Daniel Bunn, “Tax Policy and Economic Downturns” Tax Foundation, Mar. 18, 2020, https://taxfoundation.org/government-revenue-most-hit-recession/, and Jared Walczak, “Income Taxes Are More Volatile Than Sales Taxes During an Economic Contraction” Tax Foundation, Mar. 17, 2020, https://taxfoundation.org/income-taxes-are-more-volatile-than-sales-taxes-during-recession/.
[3] Jared Walczak and Janelle Cammenga, 2021 State Business Tax Climate Index, Tax Foundation, Oct. 21, 2020, https://taxfoundation.org/2021-state-business-tax-climate-index/.
[4] Ibid.
[5] Daniel Bunn and Elke Asen, International Tax Competitiveness Index, Tax Foundation, Oct. 14, 2020, https://taxfoundation.org/publications/international-tax-competitiveness-index/.
[6] See the section on excise taxes in this report for more details.
[7] The different experiences could also be explained by differing excise tax policies. However, we have limited historical data on excise tax rates that would be needed to answer this question.
[8] In some countries the VAT is referred to as the Goods and Services Tax (GST). This includes countries like Australia, Canada, and New Zealand.
[9] OECD, Consumption Tax Trends 2020: VAT/GST and Excise Rates, Trends and Policy Issues (Paris: OECD Publishing, November 2020), https://doi.org/10.1787/152def2d-en.
[10] British Columbia, Manitoba, and Saskatchewan apply a provincial retail sales tax (PST) in addition to the 5 percent federal GST. See the section on sales taxes for more information.
[11] VAT Directive 2006/112/EC.
[12] A number of states which, on January 1, 1991, were applying reduced rates to goods and services not included in the VAT Directive list, may still apply the reduced rates, also called parking rates, as long as the rates are not lower than 12 percent.
[13] Appendix III of the VAT directive lists 21 categories of goods and services that reduced rates could be applied to. The list includes foodstuff, water supply, pharmaceutical products, medical equipment, transport of passengers, supply of books and newspapers, admission to cultural services and amusement parks, radio and television broadcasting services, services offered by writers or artists, social housing, agricultural inputs, accommodations, restaurant and catering services, admission to sporting events and use of sporting facilities, social services, supplies by undertakers and cremation services, medical and dental care, collection of domestic waste, minor repairing of bicycles, shores and clothing, domestic care services, and hairdressing.
[14] OECD, Consumption Tax Trends 2020: VAT/GST and Excise Rates, Trends and Policy Issues.
[15] Rita de la Feria and Michael Walpole, “The Impact of Public Perceptions on General Consumption Taxes,” British Tax Review 67:5 (Dec. 4, 2020), 637-669, https://papers.ssrn.com/sol3/papers.cfm?abstract_id=3723750.
[16] Modeling of VAT exemptions and reduced rates compared to universal cash transfer policies in Ethiopia, Ghana, Senegal, and Zambia show that a system of general cash transfers paired with a broad-based VAT is more effective for redistribution purposes than VAT reduced rates or exemptions. Refundable VAT for lower-income individuals or a credit for groceries could see similar impacts. See David Phillips et al., “Redistribution Via VAT and Cash Transfers: An Assessment in Four Low and Middle Income Countries” CEQ Institute Working Paper 78, March 2018, http://repec.tulane.edu/RePEc/ceq/ceq78.pdf.
[17] Li Liu et al., “VAT Notches, Voluntary Registration, and Bunching: Theory and UK Evidence,” IMF, Sept. 27, 2019, https://www.imf.org/en/Publications/WP/Issues/2019/09/27/VAT-Notches-Voluntary-Registration-and-Bunching-Theory-and-UK-Evidence-48669.
[18] Local currency amounts are converted to U.S. dollars using OECD purchasing power parity conversions from the OECD. See OECD, “Purchasing power parities (PPP),” accessed Dec. 22, 2020, https://data.oecd.org/conversion/purchasing-power-parities-ppp.htm.
[19] Center for Social and Economic Research (CASE), Economisti Associati, European Commission: DG Taxation and Customs Union, “Study and Reports on the VAT Gap in the EU-28 Member States: 2020 Final Report,” 2020.
[20] PwC, “Worldwide Tax Summaries,” https://taxsummaries.pwc.com/canada/corporate/other-taxes.
[21] Janelle Cammenga, “State and Local Sales Tax Rates, Midyear 2020,” Tax Foundation, July 8, 2020, https://taxfoundation.org/state-and-local-sales-tax-rates-2020/.
[22] OECD, Consumption Tax Trends 2012: VAT/GST and Excise Rates, Trends and Administration Issues (Paris: OECD Publishing, November 2020), 120,
https://read.oecd-ilibrary.org/taxation/consumption-tax-trends-2012_ctt-2012-en#page120.
[23] Ulrik Boesen, “Cigarette Taxes and Cigarette Smuggling by State, 2018,” Tax Foundation, Nov. 24, 2020, https://taxfoundation.org/cigarette-taxes-cigarette-smuggling-2020/.
[24] Ibid., 138
[25] OECD, Consumption Tax Trends 2020: VAT/GST and Excise Rates, Trends and Policy Issues.
[26] Tax Foundation, “Tax Basics: Pigouvian Tax,” accessed Dec. 15, 2020,
https://taxfoundation.org/tax-basics/pigouvian-tax/.
[27] Macrotrends, “Crude Oil Prices – 70 Year Historical Chart,” accessed Dec. 15, 2020, https://www.macrotrends.net/1369/crude-oil-price-history-chart.
[28] European Commission, “Excise Duties on Tobacco,” accessed Dec. 15, 2020,
[29] KPMG, Illicit cigarette consumption in the EU, UK, Norway and Switzerland: 2019 Results, June 18, 2020, 7, 10, https://www.stopillegal.com/docs/default-source/external-docs/kpmg-report—2019-results/kpmg-report-illicit-cigarette-consumption-in-the-eu-uk-norway-and-switzerland-2019-results.pdf.
[30] Ibid., 13.
[31] OECD, Consumption Tax Trends 2018: VAT/GST and Excise Rates, Trends and Administration Issues (Paris: OECD Publishing, December 2018), 150-151,
https://www.oecd-ilibrary.org/taxation/consumption-tax-trends-2018_ctt-2018-en.
[32] Ulrik Boesen, “Cigarette Taxes and Cigarette Smuggling by State, 2018.”
[33] Sarantis Michalopoulos, “EXCLUSIVE: EU countries to propose excise tax for e-cigarettes and heated tobacco products,” EURACTIV, May 26, 2020, https://www.euractiv.com/section/health-consumers/news/exclusive-eu-countries-to-propose-excise-tax-for-e-cigarettes-and-heated-tobacco-products/.
[34] European Commission, “Evaluation of the Council Directive 2011/64/EU of 21 June 2011 on the structure and rates of excise duty applied to manufactured tobacco,” Feb. 10, 2020, https://ec.europa.eu/taxation_customs/sites/taxation/files/10-02-2020-tobacco-taxation-report.pdf.
[35] Arbeitsgemeinschaft Tabakprävention Schweiz, “Heated Tobacco Products: Deep Dive Switzerland: A Policy Brief,” July 31, 2020, 6, 8, https://portal.at-schweiz.ch/images/pdf/wissenschfatliche_factsheets/htp_deep_dive_26_08_2020.pdf.
[36] L. Rosen, S. Kislev, Y. Bar-Zeev, and H. Levine, “Historic tobacco legislation in Israel: a moment to celebrate,” Israel Journal of Health Policy Research 9:22 (May 4, 2020), https://www.ncbi.nlm.nih.gov/pmc/articles/PMC7199353/.
[37] Victoria, “The World’s First Law Specific to Vaping Has Just Passed in Iceland,” Blog Vape, July 2, 2018,
https://blog-vape.com/2018/07/02/the-worlds-first-law-specific-to-vaping-has-just-passed-in-iceland/.
[38] Physicians for a Smoke-Free Canada, “Taxes on heat not burn cigarettes in Canadian jurisdictions,” August 2020, http://www.smoke-free.ca/SUAP/2020/taxrates-heatnotburn.pdf.
[39] Campaign for Tobacco-Free Kids, “Mexico Bans Import of E-cigarettes and Heated Tobacco Products to Protect Kids and Public Health,” Feb. 27, 2020, https://www.tobaccofreekids.org/press-releases/2020_02_27_mexico_bans_ecig_imports.
[40] Jim McDonald, “Vape Bans in the United States and Around the World,” Vaping360, Nov. 12, 2020,
https://vaping360.com/learn/countries-where-vaping-is-banned-illegal/.
[41] Stacey Kirk, “Government legalises e-cigarettes in effort to make New Zealand smokefree by 2025,” Stuff.nz, Mar. 29, 2017, https://www.stuff.co.nz/national/politics/90962129/government-legalises-ecigarettes-in-effort-to-make-new-zealand-smokefree-by-2025.
[42] For a more detailed discussion of marijuana taxation in the U.S. see: Ulrik Boesen, “A Road Map to Recreational Marijuana Taxation,” Tax Foundation, June 9, 2020, https://taxfoundation.org/recreational-marijuana-tax/.
Share this article