Note: The following is the testimony of Scott Hodge, President Emeritus and Senior Policy Advisor at the Tax Foundation, prepared for a Senate Budget Committee hearing on May 17, 2023, titled, “The Rich Get Richer, Deficits Get Bigger: How Tax Cuts for the Wealthy and Corporations Drive the National Debt.”
Mr. Chairman, Ranking Member Grassley, and distinguished members of the Senate Budget Committee, thank you for the opportunity to speak with you today about the causes of and solutions to the federal government’s current fiscal predicament.
If you are running a business and your CFO says the company’s finances are unsustainable, you should heed the warning.
The latest Financial Report of the U.S. Government warns that “The continuous rise of the debt-to-GDP ratio indicates that current policy under this report’s assumptions is unsustainable.” If lawmakers fail to take action soon, the report projects that the federal debt could “exceed 200 percent [of GDP] by 2046 and reach 566 percent by 2097.”
To stabilize the federal debt at current levels, the Financial Report estimates that the government will have to run “primary surpluses” equal to 0.6 percent of GDP, 4.9 percentage points higher than current projections, between 2023 and 2097. This is a tall order because of the widening gap between federal spending and tax revenues.
Many are pointing to taxA tax is a mandatory payment or charge collected by local, state, and national governments from individuals or businesses to cover the costs of general government services, goods, and activities. policy as both the cause of and solution to the debt crisis. Some have suggested that prior tax policies have contributed to the current debt crisis, and that returning to Clinton-era policies would close the deficit. President Biden’s FY 2024 budget proposes $4.5 trillion in new revenues over the next decade as a step toward reducing federal deficits, achieved in part by repealing some of the policies enacted in the Tax Cuts and Jobs Act (TCJA).
At the same time, lawmakers cannot seem to reconcile their demand that the rich and large corporations pay their “fair share” of taxes with Congress’s propensity to create new tax breaks for the wealthy and large corporations.
Let’s consider these issues one by one. Despite the well-worn rhetoric, the so-called Bush tax cuts and the TCJA made the federal tax burden much more progressive than it was during the Clinton administration.
In 2001, as the Bush tax cuts were being debated, the top 1 percent of taxpayers paid 33 percent of federal income taxes. In 2020, the top 1 percent of taxpayers paid more than 42 percent of federal income taxes.[1] Were the rich to pay the same share today that they paid in 2001, their share of the tax burden would fall by $159 billion.
At the other end of the income scale, in 2001, the bottom 50 percent of taxpayers paid 4.9 percent of all income taxes. In 2020, the bottom 50 percent of taxpayers paid 2.32 percent of all income taxes. In other words, over the past two decades, the tax burden on the lowest-income taxpayers has been cut in half. Were they to shoulder the same share of the tax burden today as they did in 2001, it would mean a tax hike of nearly $84 billion.
Tax Foundation economists used our General Equilibrium Tax Model to estimate the distributional impact of returning to Clinton-era tax policies, including tax brackets, the standard deduction, capital gains rates, and the Child Tax Credit amount.
Our model projected that every income group would see their after-tax incomes fall as a result.
Indeed, the poor and middle class would be hardest hit by returning to Clinton-era tax policies. Our model shows that the after-tax incomes of taxpayers in the bottom quintile would drop by 8.2 percent, while after-tax incomes of those in the second quintile would drop by 10.3 percent. Middle-income taxpayers would see their after-tax incomes fall by 7.9 percent.
Meanwhile, the taxpayers least impacted by rolling back the Bush tax cuts would be those in the top 1 percent, who would see their incomes drop by just 4.0 percent, half the rate suffered by taxpayers in the bottom quintile.
Why is the tax code today so much more progressive than in the Clinton era, especially since both the Bush tax cuts and the TCJA reduced marginal tax rates for the wealthy? It is easy to forget how much those tax plans did to reduce the burden on the poor and middle class. Both tax plans expanded the Child Tax CreditA tax credit is a provision that reduces a taxpayer’s final tax bill, dollar-for-dollar. A tax credit differs from deductions and exemptions, which reduce taxable income rather than the taxpayer’s tax bill directly., ultimately from $500 to $2,000, and introduced refundability. TCJA also greatly increased the standard deductionThe standard deduction reduces a taxpayer’s taxable income by a set amount determined by the government. Taxpayers who take the standard deduction cannot also itemize their deductions; it serves as an alternative., which simplified filing for millions of taxpayers, and lowered income tax rates broadly for individuals, leading the Congressional Budget Office to conclude it would reduce taxes and raise after-tax incomes for all income groups.[2]
The result is that millions more working families pay no income taxes today compared to 2000. In 2000, 25.4 percent of taxpayers paid no income taxes after claiming their deductions and credits.[3] In 2020, 37.4 percent of taxpayers paid no income taxes after credits and deductions. Returning to Clinton-era policies would put 20 million working families back on the tax rolls.[4]
It will surprise many Americans to learn that the U.S. does more to help the poor and working class through the tax code than most European countries. According to a study by the World Inequality Lab, a project of the Paris School of Economics, the U.S. tax system is more progressive and redistributive than European nations.[5]
President Biden’s Budget Plan Makes the Government’s Fiscal Crisis Worse
The Biden budget promises to raise $65 trillion in revenues over 10 years, $5 trillion more than the baseline. The budget also promises to spend $82 trillion over 10 years, $2 trillion more than the baseline.
That math leaves a deficit of $17 trillion over 10 years. This is $3 trillion less than the baseline, so the White House is technically correct that Biden’s budget “reduces” the deficit by $3 trillion.
But it does so only because a massive increase in spending is offset by one of the largest proposed tax increases in American history.[6] This is matched by one of the largest sustained levels of government spending and tax revenues in American history.
Under the budget plan, tax receipts would average 19.6 percent of GDP over the next decade, 1.2 percentage points more than any other 10-year period in U.S. history. Government spending would average 24.8 percent of GDP, 0.5 percentage points more than any other 10-year period in U.S. history, including World War II.[7]
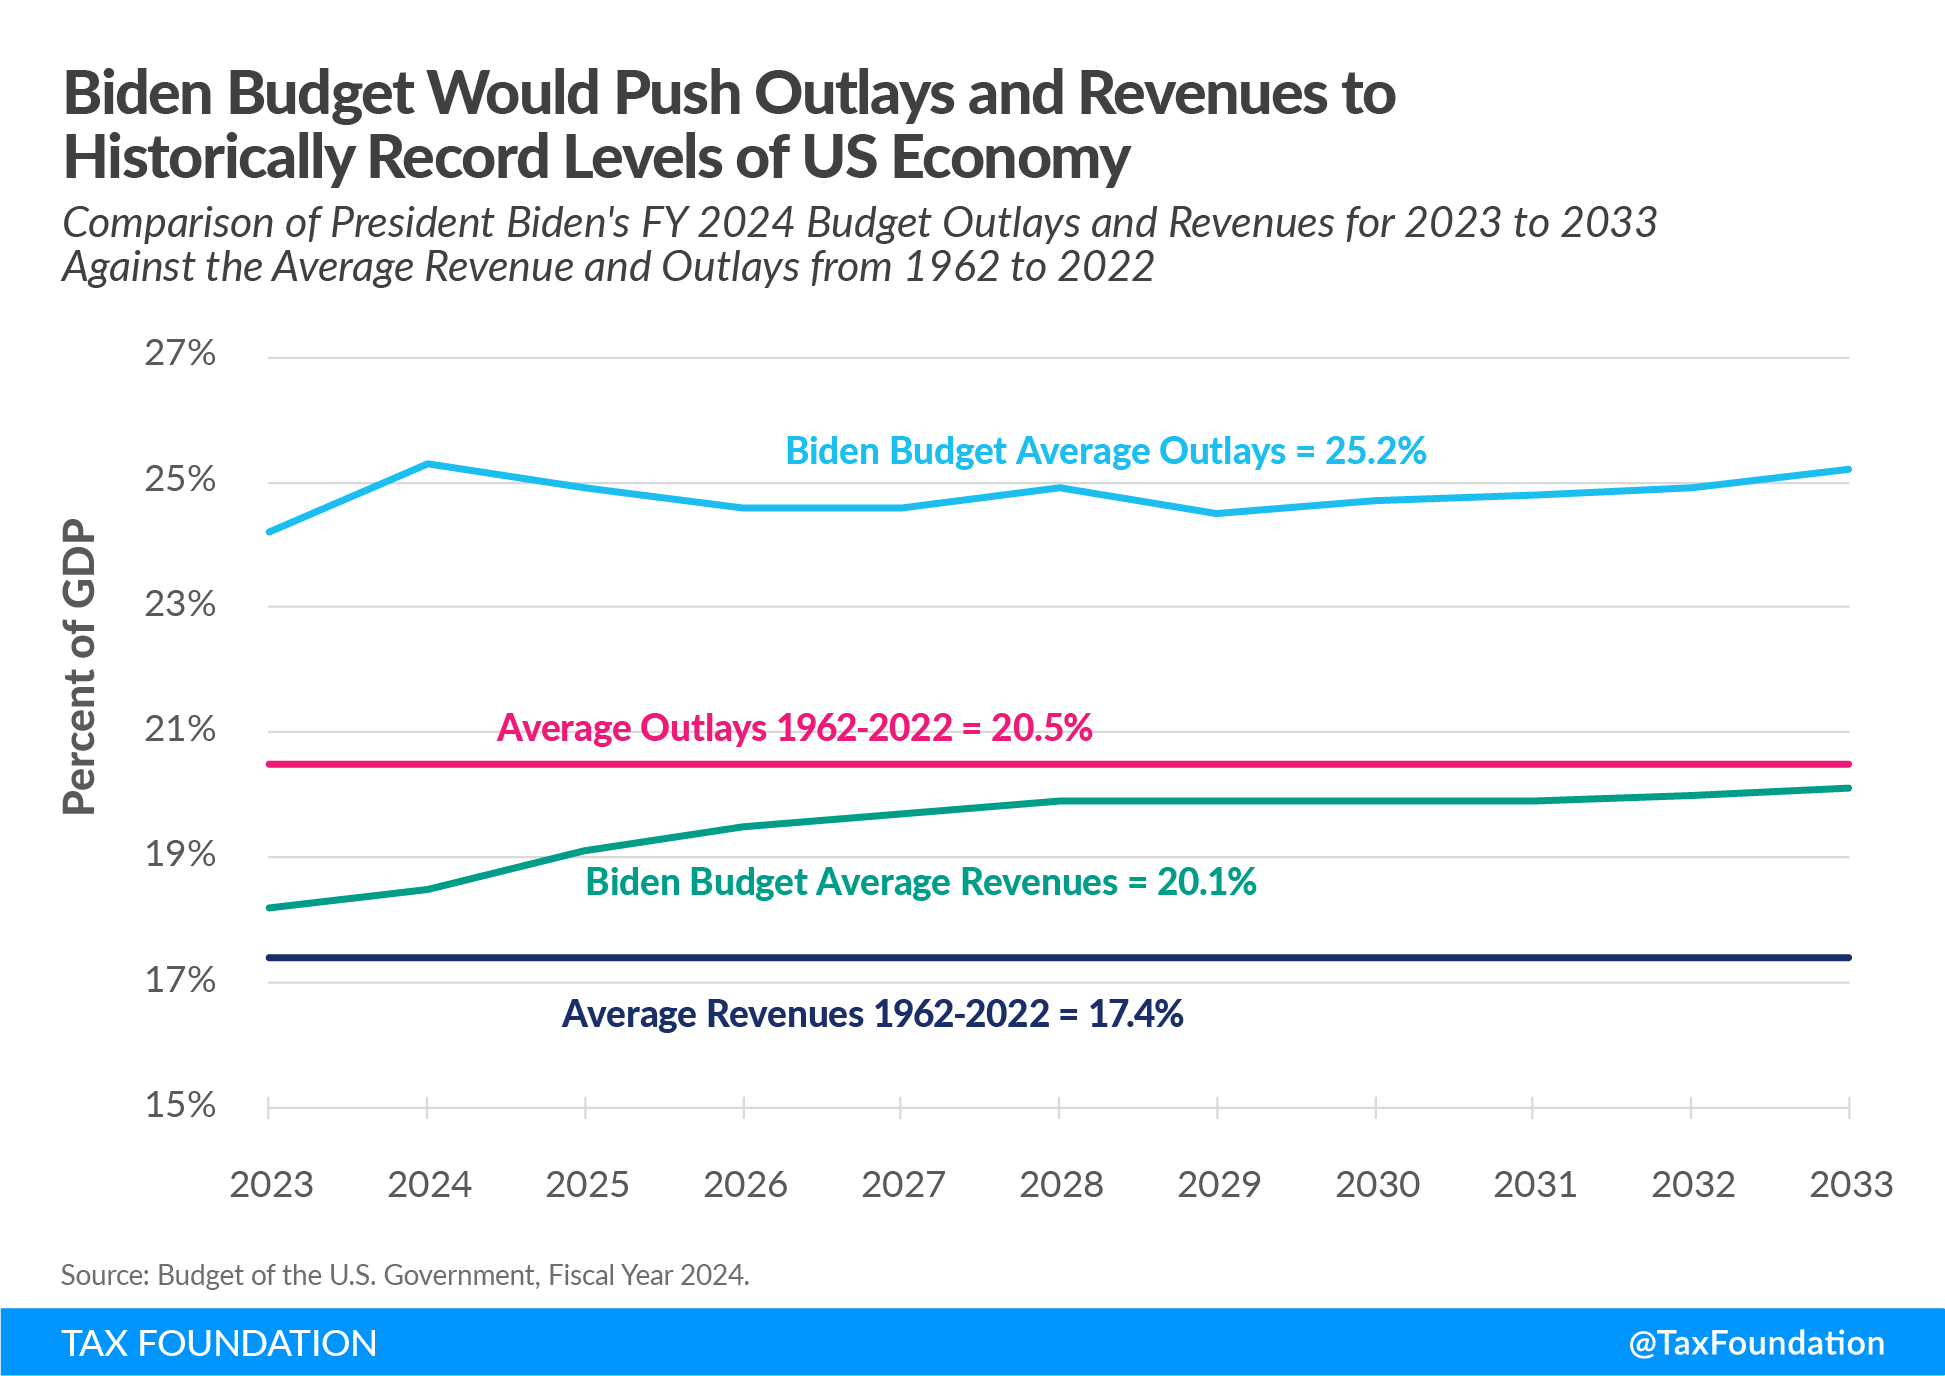
This means that the federal deficit under Biden’s budget would average 5.2 percent of GDP over the next decade, a larger sustained deficit than at any time in the nation’s history outside of World War II.
The budget adds further liabilities on our children by increasing the publicly held national debt from 98.4 percent of GDP to 109.8 percent by 2033.
The Biden Budget Is Bad for Taxpayers and the Economy
Using the Tax Foundation’s macroeconomic tax model, Tax Foundation economists estimate that the Biden budget plan would reduce the long-term size of the economy by 1.3 percent, reduce the capital stock by 2.4 percent, lower wages by 1 percent, and eliminate 335,000 private sector jobs.[8]
Our model estimates that the proposed tax increases in the Biden budget would raise $3.9 trillion over 10 years on a conventional basis, net of about $700 billion in tax credits. However, after accounting for the tax hike’s impact on the economy, the revenue estimate would fall to $3.4 trillion. Still, this is an enormous tax increase.
The Biden Budget Would Undermine U.S. Competitiveness
The tax rate increases in the Biden budget would elevate each of our major income tax rates to among the highest in the OECD, making the U.S. less attractive for investment and less competitive globally.
As the nearby table illustrates, the Biden tax rate increases would boost the top marginal rate on individual income above the top average rates in the OECD. The increase in the federal corporate tax rate to 28 percent would lift the combined corporate rate to a level nearly 50 percent above the OECD average. Lastly, taxing capital gains at ordinary rates would raise the top marginal rate in the U.S. to more than twice the OECD average.[9]
| Current Law | FY 2024 Budget | OECD Average (Excluding U.S.) | |
|---|---|---|---|
| Top Combined Marginal Rate on Individual Income | 42.80% | 45.40% | 42.60% |
| Top Combined Marginal Rate on Corporate Income | 25.70% | 32.30% | 22.80% |
| Top Combined Marginal Rate on Capital Gains Income | 29.40% | 50.10% | 18.90% |
| Combined Integrated Rate on Corporate Income | 47.50% | 66.20% | 41.40% |
|
Note: Estimates include average state and local taxes. Sources: State and local tax statutes; OECD; Tax Foundation calculations. |
|||
Tax Increases Don’t Bend the Cost Curve of Debt
Many in Washington continue to believe that new taxes must be part of any debt reduction solution. If so, lawmakers must consider the trade-off between how much revenue a tax proposal may generate and its impact on economic growth. Economic research tells us that not all taxes have the same effect on economic growth and, thus, will have varying impacts on bending the cost curve of the national debt.
Corporate income taxes are the most harmful taxes for economic growth because capital is highly mobile and, thus, very sensitive to high tax rates. Individual income taxes are less harmful than corporate taxes but do impact our decisions to work, save, and invest. Consumption taxes and property taxes are comparatively less harmful than income-based taxes.
In a recent study, my colleague Erica York used our General Equilibrium Tax Model to estimate the effects that three different tax increases would have on economic growth and altering the cost curve of the national debt.
The first tax increase we modeled was to increase the federal gas tax by $.35. Next, we eliminated the exclusion for employer-sponsored health insurance (ESI). The third simulation raised the corporate tax rate to 28 percent and boosted the top marginal individual tax rate to 50 percent for taxpayers earning above $400,000, similar to key elements of Biden’s tax proposals.
Raising the gas taxA gas tax is commonly used to describe the variety of taxes levied on gasoline at both the federal and state levels, to provide funds for highway repair and maintenance, as well as for other government infrastructure projects. These taxes are levied in a few ways, including per-gallon excise taxes, excise taxes imposed on wholesalers, and general sales taxes that apply to the purchase of gasoline. by $.35 had the smallest impact on GDP, reducing the size of the economy by 0.2 percent over the long term. After factoring in the economic effects of the tax, the model estimates that the gas tax hike would raise $797 billion over the next decade, which would lower the debt-to-GDP ratio by 2 percentage points in 2033. Over the long run, boosting the gas tax would improve the debt-to-GDP ratio by 4 percentage points.
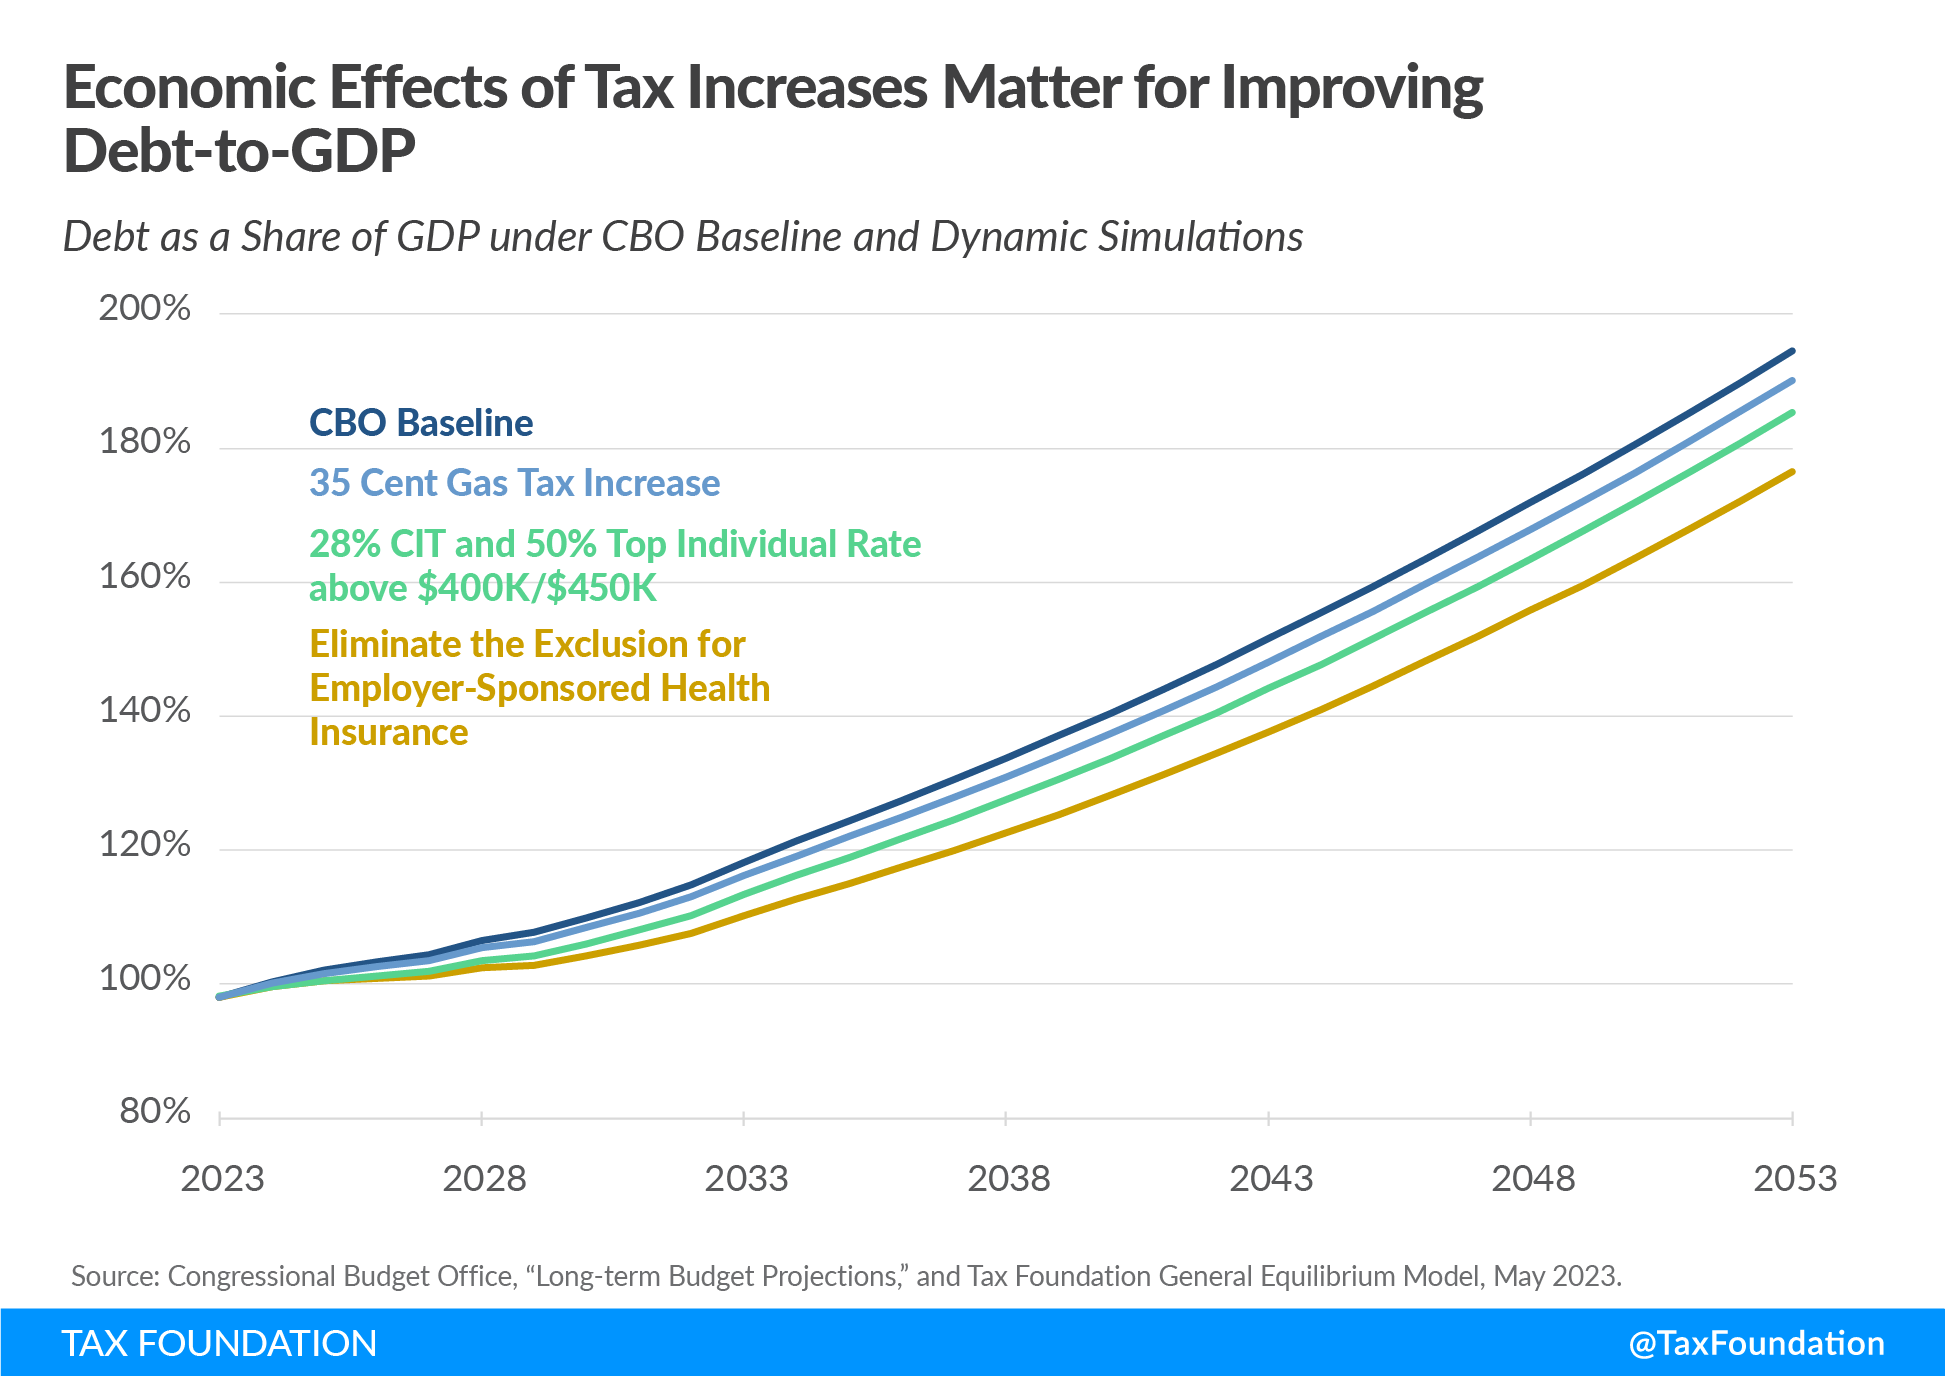
Eliminating the exclusion for ESI would have a slightly bigger impact on the economy than the gas tax, reducing long-run GDP by 0.5 percent. However, it would raise more than $3.1 trillion over a decade, the most amount of revenue of the three plans after accounting for the economic effects. By 2033, this revenue raiser would reduce the debt-to-GDP ratio by 8 percentage points, and by 18 percentage points over the long run.
Finally, the tax increases under Biden’s FY 2024 budget would reduce the long-run size of the economy by 1.3 percent, the largest impact of the three proposals. After accounting for its impact on economic growth, our model estimated that the plan would raise over $1.9 trillion over a decade, reducing the debt-to-GDP ratio by 4 percentage points. Over the long run, Biden’s tax hikes would lower the debt-to-GDP ratio by 14 percentage points.
While these results may seem impressive, the nearby chart shows that the projected growth in the debt as a share of GDP is so large that even major tax increases are insufficient to stabilize the debt over the near term or the long term. Not to mention, the weaker economy caused by the tax increases makes the challenge of reducing the debt that much more difficult.
The Tax Code Is Full of Questionable Tax Breaks for the Wealthy and Big Corporations
One lesson we can take from the three simulations is that eliminating a tax preference such as the ESI is less harmful to the economy than raising marginal tax rates as proposed by President Biden, and it can have a bigger impact on reducing the debt-to-GDP ratio. If lawmakers are looking to make the tax code fairer while raising revenues, they should evaluate the more than 200 tax expenditures in the federal budget and eliminate those that disproportionately benefit high-income taxpayers and large businesses, except for provisions that protect savings and the expensing of capital investments.
Perhaps one of the largest expansions of corporate welfare in recent memory is the InflationInflation is when the general price of goods and services increases across the economy, reducing the purchasing power of a currency and the value of certain assets. The same paycheck covers less goods, services, and bills. It is sometimes referred to as a “hidden tax,” as it leaves taxpayers less well-off due to higher costs and “bracket creep,” while increasing the government’s spendin Reduction Act (IRA). The IRA authorized $265 billion over a decade for more than two dozen tax credit programs aimed at incentivizing clean energy, carbon capture, alternative fuel sources, and energy-efficient buildings. Congress’s Joint Committee on Taxation recently raised the Inflation Reduction Act’s estimated cost to more than $570 billion, although independent estimates put the cost at more than $1 trillion over 10 years.[10]
The JCT has also determined that the Inflation Reduction Act will benefit a small number of the largest industries in the U.S. It is hard to reconcile the often-heard rhetoric that corporations should pay their “fair share” of taxes when the Inflation Reduction ACt is funneling billions of taxpayer dollars to the very same corporations.
Similarly, dozens more tax expenditures disproportionately benefit high-income families more than the middle class. Indeed, most of the deductions available for taxpayers who itemize benefit the wealthy far more than the middle class. Eliminating these deductions would streamline the tax code and make it more progressive. Ideally, this should be done within the context of fundamental tax reform, but it is a superior means of addressing the debt than raising tax rates.
Conclusion
The tax code is incredibly progressive and redistributive, in large measure due to the policies enacted in the Bush tax cuts and the Tax Cuts and Jobs Act. Reversing these policies and returning to the Clinton-era tax code would be regressive and very harmful to the economy. A slow economy only makes the job of reducing the debt more difficult.
To be sure, many elements of the tax code benefit the wealthy and big corporations. The Inflation Reduction Act is the most recent example. Removing these tax expenditures would be more effective than rate increases in altering the debt curve.
That said, our simulations suggest that even large tax increases are insufficient to stabilize the debt, which points to the only sustainable solution to stabilize the debt: controlling spending.
Related Resources
Learn more with our blog post series in which our experts explore the issues and potential solutions for America’s growing debt and deficits.
- Fast Approaching Debt Limit Deadline and Growing Debt Demand Action
- How America’s Debt Problem Compares to Other Countries—and Why It Matters
- Design Matters When Raising Taxes to Reduce the Deficit and Stabilize the Debt
- Tackling America’s Debt & Deficit Crisis Requires Social Security & Medicare Reform
- Debt Ceiling Deal Reduces Deficits in the Short Term But Delays a More Comprehensive Budget Reckoning
Taxes make more sense with us in your inbox.
Subscribe to our newsletter for tax insights that cut through the noise—and make sense of it.
Sign Up[1] Internal Revenue Service, Statistics of Income, “Number of Returns, Shares of AGI and Total Income Tax, AGI Floor on Percentiles in Current and Constant Dollars, and Average Tax Rates,” Table 1, and “Number of Returns, Shares of AGI and Total Income Tax, and Average Tax Rates,” Table 2, https://www.irs.gov/statistics/soi-tax-stats-individual-income-tax-rates-and-tax-shares; Erica York, “Summary of the Latest Federal Income Tax Data, 2023 Update,” Tax Foundation, Jan. 26, 2023, https://taxfoundation.org/publications/latest-federal-income-tax-data/.
[2] Huaqun Li and Kyle Pomerleau, “The Distributional Impact of the Tax Cuts and Jobs Act over the Next Decade,” Tax Foundation, Jun. 28, 2018, https://taxfoundation.org/the-distributional-impact-of-the-tax-cuts-and-jobs-act-over-the-next-decade/; Congressional Budget Office, “Distributional Analysis of the Tax Cuts and Jobs Act,” Nov. 27, 2017, https://www.cbo.gov/publication/53349; Garrett Watson, “Congressional Budget Office Shows 2017 Tax Law Reduced Tax Rates Across the Board in 2018,” Tax Foundation, Aug. 5, 2021, https://taxfoundation.org/congressional-budget-office-shows-2017-tax-law-reduced-tax-rates-across-board-2018/
[3] Internal Revenue Service, “Individual Income TaxAn individual income tax (or personal income tax) is levied on the wages, salaries, investments, or other forms of income an individual or household earns. The U.S. imposes a progressive income tax where rates increase with income. The Federal Income Tax was established in 1913 with the ratification of the 16th Amendment. Though barely 100 years old, individual income taxes are the largest source Returns, Tax Year 2000, Table 1.2—All Returns: Adjusted Gross IncomeFor individuals, gross income is the total of all income received from any source before taxes or deductions. It includes wages, salaries, tips, interest, dividends, capital gains, rental income, alimony, pensions, and other forms of income. For businesses, gross income (or gross profit) is the sum of total receipts or sales minus the cost of goods sold (COGS)—the direct costs of producing goods, Exemptions, Deductions, and Tax Items, by Size of Adjusted Gross Income and Marital Status,” https://www.irs.gov/pub/irs-soi/00in12ar.xls.
[4] Internal Revenue Service, “Table 1.2. All Returns: Adjusted Gross Income, Deductions, and Tax Items, by Size of Adjusted Gross Income and Filing Status, Tax Year 2020 (Filing Year 2021),” https://www.irs.gov/pub/irs-soi/20in12ms.xls.
[5] Thomas Blanchet, Lucas Chancel, and Amory Gethin, “Why is Europe More Equal than the United States?,” World Inequality Lab, Nov. 9, 2021.
[6] Erica York and Garrett Watson, “Placing Joe Biden’s Tax Increases in Historical Context,” Tax Foundation, Oct. 22, 2020, https://taxfoundation.org/joe-biden-tax-increases-historical-context/.
[7] The highest sustained federal tax revenue collections in history occurred over the period 1993-2002, when revenues averaged 18.4 percent of GDP. The highest sustained federal outlays in history occurred over the period 1942-1951, including World War II, when outlays averaged 24.3 percent.
[8] Garrett Watson, Erica York, Huaqun Li, Cody Kallen, William McBride, and Alex Muresianu, “Details and Analysis of President Biden’s Fiscal Year 2024 Budget,” Tax Foundation, Mar. 23, 2023. https://taxfoundation.org/biden-budget-tax-proposals-analysis/
[9] Erica York, Garrett Watson, and Alex Durante, “Biden’s FY 2024 Budget Would Result in More Than $4.5 Trillion in Gross Tax Increases,” Tax Foundation, Mar. 9, 2023, https://taxfoundation.org/biden-budget-taxes/.
[10] William McBride and Daniel Bunn, “Repealing Inflation Reduction Act’s Green Energy Tax Credits Would Raise $570 Billion, JCT Projects,” Tax Foundation, Apr. 26, 2023, https://taxfoundation.org/inflation-reduction-act-green-energy-tax-credits-analysis/.