Supporters and critics of President Biden’s taxA tax is a mandatory payment or charge collected by local, state, and national governments from individuals or businesses to cover the costs of general government services, goods, and activities. plan have made a variety of claims about the size of the tax proposals, ranging from “not big enough” to the “biggest tax increase in history.” Comparing his tax proposals—which include higher taxes on high-income earners and businesses paired with more generous provisions for households and specific activities—to historical tax changes is helpful for analyzing these claims.
This context shows that while Biden’s proposal would not result in the largest tax increase on record, it would be large by historical standards and would have a negative effect on long-run output.
We estimate that on a conventional basis, Biden’s tax plan would increase federal revenue by $143 billion in 2021 and by $336 billion in 2022, and by a total of $3.3 trillion from 2021 to 2030. Stated as a percentage of gross domestic product (GDP), this would amount to an increase in federal revenue of 0.68 percent of GDP for 2021, 1.52 percent in 2022, and a 1.30 percent increase over the 10 years from 2021 to 2030.
This is different from our original analysis in two ways. First, the Biden campaign has proposed several new tax policies that have impacted our revenue estimates, including a large temporary expansion of the Child Tax CreditA tax credit is a provision that reduces a taxpayer’s final tax bill, dollar-for-dollar. A tax credit differs from deductions and exemptions, which reduce taxable income rather than the taxpayer’s tax bill directly. in 2021. Second, the coronavirus pandemic and related economic downturn have impacted the federal government’s budget outlook over the next 10 years, including federal revenue projections. The large economic shock will also affect how much revenue the Biden tax plan would be expected to raise due to a lower baseline level of economic activity, especially in the first few years in the budget window. To account for this effect, we have used the Congressional Budget Office’s (CBO) September 2020 update to the budget outlook to adjust our revenue estimates.
According to a report from the Treasury Department, between 1940 and 2012, Congress enacted 21 major tax bills that increased federal tax revenues over at least one fiscal year. Of these 21 revenue-raising tax bills, the five largest tax increases since 1940 have raised annual federal revenue in the range of 1.33 percent of GDP up to 5.04 percent of GDP.
By comparison to these past tax increases, in the first year, Biden’s tax plan would increase federal revenue by 0.68 percent of GDP, making it the tenth largest tax increase since the 1940s. In the second year of Biden’s plan, when the temporary expansion of the Child Tax Credit expires, the plan would increase federal revenue by 1.52 percent of GDP, tying for the fourth largest tax increase as a share of GDP since the 1940s.
| Tax Bill | Revenue Effect as a Percentage of GDP (first fiscal year unless otherwise indicated) |
|---|---|
| Revenue Act of 1942 | 5.04% |
| Revenue Act of 1941 | 2.20% |
| Revenue and Expenditure Control Act of 1968 | 1.74% |
| Revenue Act of 1951 | 1.52% |
| Biden’s Tax Plan in year 2022 | 1.52% |
| Revenue Act of 1950 | 1.33% |
| Current Tax Payment Act of 1943 | 1.16% |
| Excess Profits Tax of 1950 | 0.97% |
| Revenue Act of 1940 | 0.91% |
| Second Revenue Act of 1940 | 0.71% |
| Biden’s Tax Plan in year 2021 | 0.68% |
| Tax Adjustment Act of 1966 | 0.60% |
| Tax Equity and Fiscal Responsibility Act of 1982 | 0.53% |
| Revenue Act of 1943 | 0.46% |
| Crude Oil Windfall Profit Tax Act of 1980 | 0.44% |
| Tax Reform Act of 1986 | 0.41% |
| Omnibus Budget Reconciliation Act of 1990 | 0.41% |
| Tax Reform Act of 1969 | 0.39% |
| Trump Administration Tariffs | 0.38% |
| Sources: Jerry Tempalski, “Revenue Effects of Major Tax Bills Updated Tables for all 2012 Bills,” Office of Tax Analysis, Department of the Treasury; Congressional Budget Office, “An Update to the Budget Outlook 2020 to 2030,” September 2020; Tax Foundation General Equilibrium Model, October 2020; and author calculations. | |
When examining Biden’s tax plan over a longer period, it would remain a large tax increase by historical standards. Take, for example, the four-year average revenue effect of tax increases since 1968: Biden’s tax plan would raise revenue by about 1.41 percent of GDP from 2021 to 2024, making it the largest tax increase by this measure. The Tax Equity and Fiscal Responsibility Act of 1982 raised revenue by about 0.98 percent of GDP over four years.
If we consider Biden’s proposal over the entire budget window (2021 to 2030) as a percentage of GDP—1.30 percent—it would rank as the sixth largest tax increase since the 1940s. For another comparison, we estimate that the Trump administration tariffs amount to a nearly $80 billion annual tax increase. These tariffs raise revenue by about 0.38 percent of GDP, making them the 17th largest tax increase since 1940. It is also worth noting that many of the tax increases historically were temporary, while Biden’s tax plan would raise taxes for each year over the budget window and are intended as permanent tax changes (expect for the temporary expansion of the Child Tax Credit). Another way to look at Biden’s tax plan is to examine how much federal revenue as a portion of economic output would be collected if the plan were enacted in comparison to historical revenue collection and the CBO’s revenue baseline.
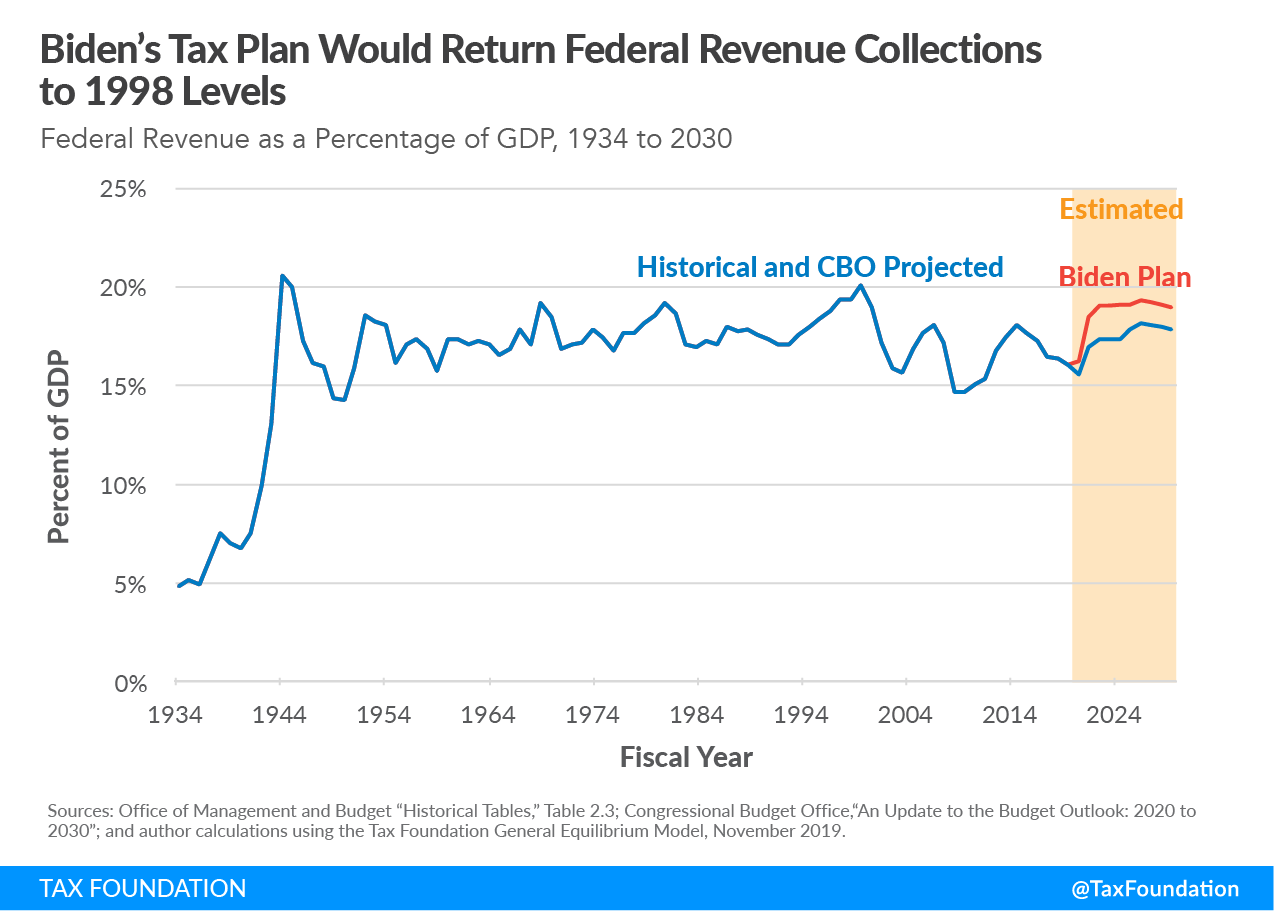
The Biden proposal would raise federal revenue as a portion of GDP from a baseline of 17.8 percent under current law in 2030 to about 18.9 percent, peaking in 2027 at about 19.3 percent of GDP (compared to 18.1 percent as projected by the CBO under current law).
This would bring the United States back up to a high point of revenue collection levels seen in 1998 to 2000, when the federal government collected about 19.3 percent of GDP in revenue for 1998 and 1999 and peaked at 20 percent in 2000 before falling to about 15.6 percent in 2004. For historical comparison, federal revenue collections as a portion of output hit their highest point during World War II, when revenue peaked at 20.5 percent of GDP in 1944.
We have also estimated that Biden’s tax plan would have a negative effect on the U.S. economy, reducing long-run GDP by 1.62 percent. The plan would shrink the capital stock by about 3.75 percent and reduce the overall wage rate by a little over 1 percent, leading to about 542,000 fewer full-time equivalent jobs.
| Gross Domestic Product (GDP) | -1.62% |
| Capital stock | -3.75% |
| Wage rate | -1.15% |
| Full-time Equivalent Jobs | -542,000 |
| Source: Tax Foundation General Equilibrium Model, October 2020. | |
By historical standards, the tax increases Biden has proposed are significant, ranking alongside tax increases used to help finance World War II, the Korean War, and the Vietnam War. While not the largest tax increase on record, Biden’s proposal would raise significant revenue. The plan would also have a negative long-run effect on the American economy, lowering long-run output and after-tax incomes across the income spectrum.
Stay informed on the tax policies impacting you.
Subscribe to our free newsletter to get the latest tax data, news and analysis.
Subscribe