Developed countries raise taxA tax is a mandatory payment or charge collected by local, state, and national governments from individuals or businesses to cover the costs of general government services, goods, and activities. revenue through a mix of individual income taxes, corporate income taxes, social insurance taxes, taxes on goods and services, and property taxes. The mix of tax policies can influence how distortionary or neutral a tax system is. Taxes on income can create more economic harm than taxes on consumption and property. However, the extent to which an individual country relies on any of these taxes can differ substantially.
While tax revenues have taken a hit due to the pandemic, many OECD countries are already seeing a recovery not only in growth measures but also in tax revenues. As the recovery continues, governments should pay close attention to how they raise revenue and avoid policy changes that could stifle an economic recovery or prove to be a complex burden on individuals and companies.
For instance, a country may decide to have a lower corporate income tax to attract investment, which may reduce its reliance on corporate income taxA corporate income tax (CIT) is levied by federal and state governments on business profits. Many companies are not subject to the CIT because they are taxed as pass-through businesses, with income reportable under the individual income tax. revenue and increase its reliance on other taxes, such as social insurance taxes or consumption taxes. On the other hand, a country may decide to raise revenue through broad-based and relatively flat taxes like social insurance taxes and consumption. Often those revenue sources are less volatile and less harmful to decisions to work and invest.
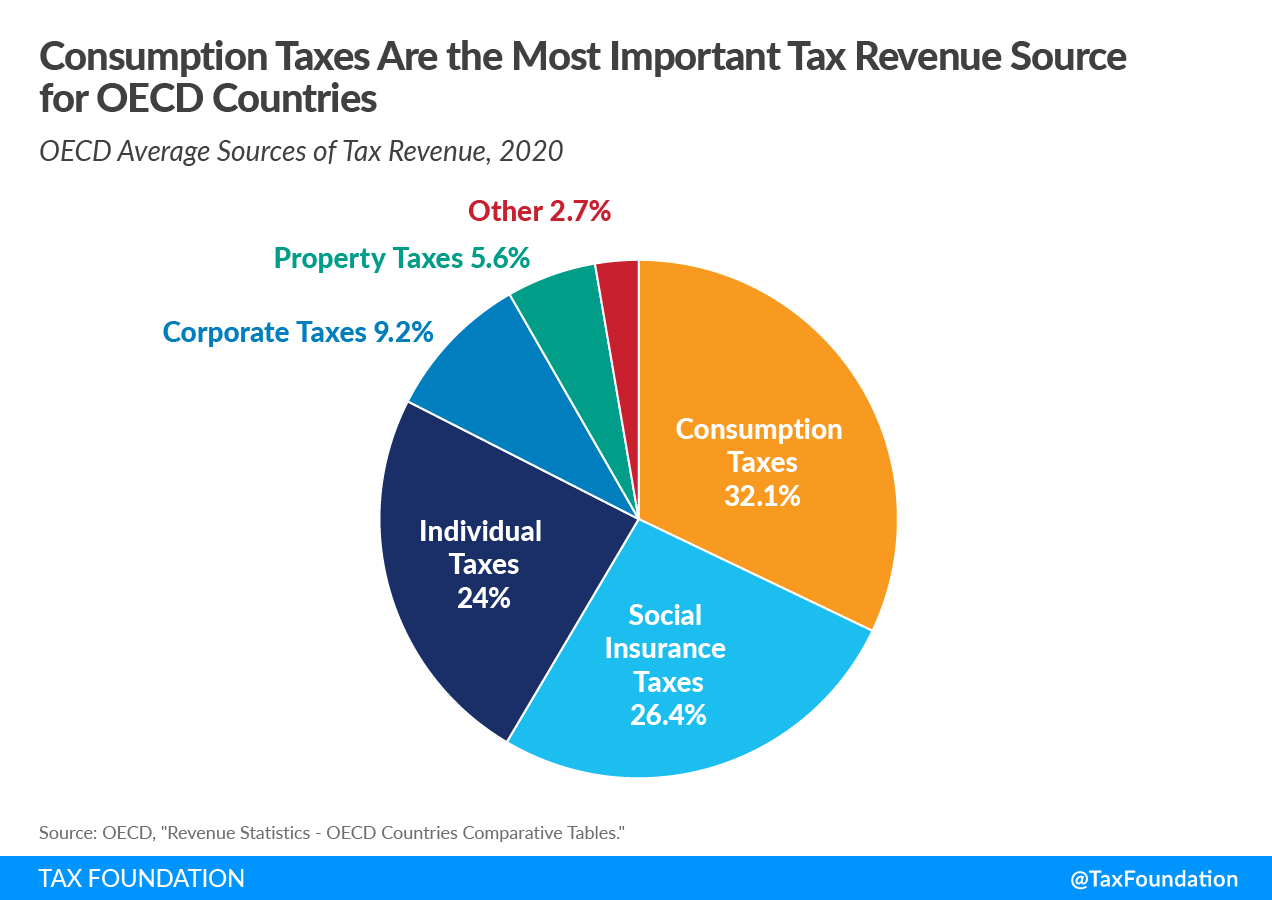
In general, OECD countries lean more on tax revenue from consumption taxes (32.1 percent), social insurance taxes (26.4 percent), and individual income taxes (24 percent) than on corporate income taxes (9.2 percent) and property taxes (5.6 percent).
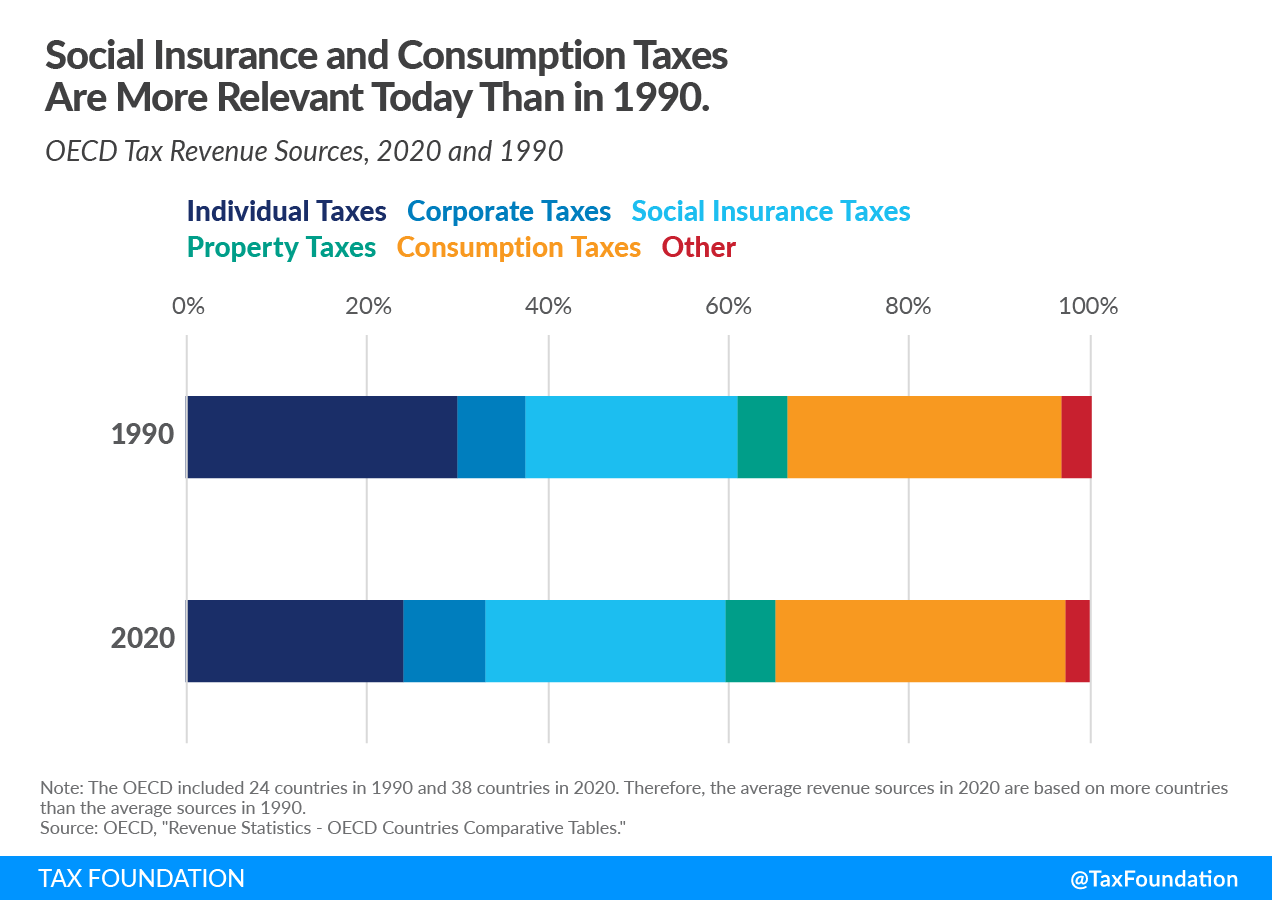
The reliance on different types of taxes has shifted over time. Compared to 1990, OECD countries have on average become more reliant on social insurance taxes (an increase of 3.1 percentage points) and less reliant on individual income taxes (a decrease of 6 percentage points). These policy changes matter. Social insurance taxes generally have broader bases and lower rates and taxes on personal income often have higher tax rates and can be more distortive to worker decisions.
OECD countries have also become more reliant on revenue from corporate income taxes. This has occurred despite a general decline in corporate tax rates around the world. One cause for this change has been a shift in the mix of OECD member countries. Since 1994, 14 countries have joined the OECD. Of this group, Colombia, Mexico, and Chile all raise more than 20 percent of their revenue from corporate income taxes. The average share of corporate tax revenue among the other 35 OECD countries is 7.7 percent.
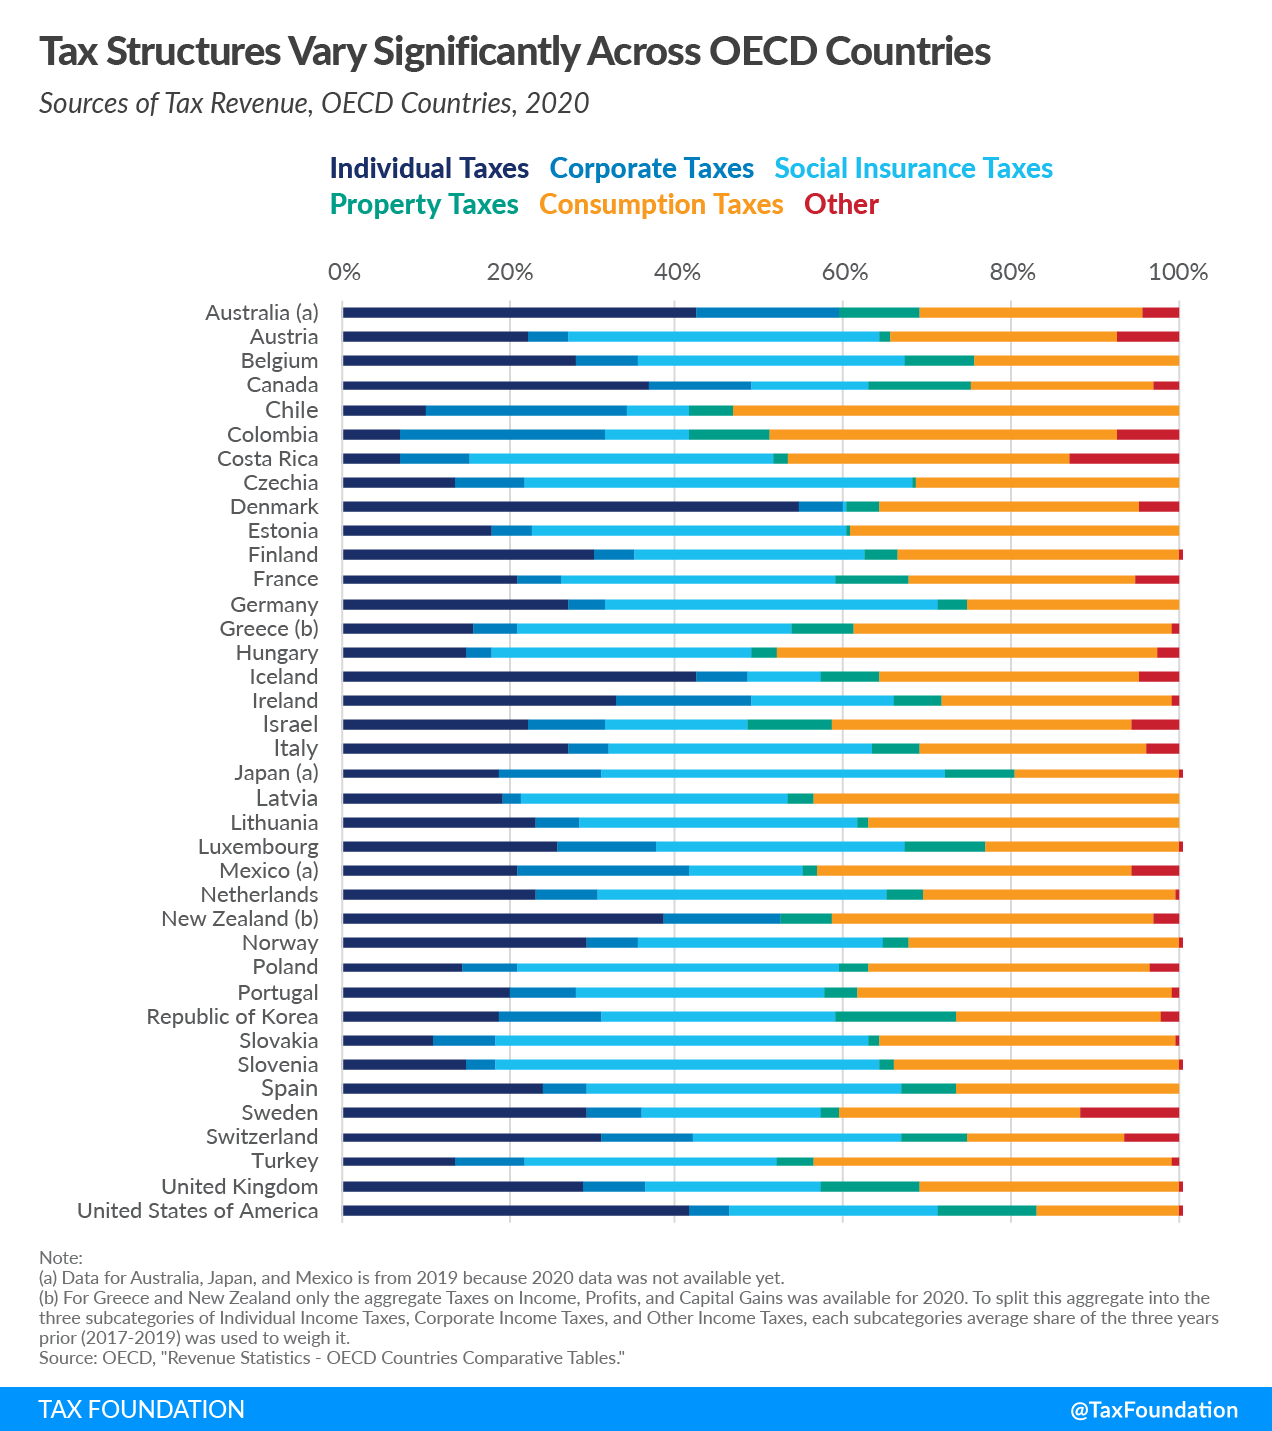
The United States is the only country in the OECD with no Value-added Tax (VAT). Instead, most U.S. state governments and many local governments apply a retail sales tax on the final sale of products and excise taxes on the production of goods such as cigarettes and alcohol. The lack of a VAT makes the U.S. a bit of an outlier as it raises just 16.9 percent of total government revenue from consumption taxes while the OECD average is nearly twice that amount at 32.1 percent.
Designing tax policy in a way that sustainably finances government activities while minimizing distortions is important for supporting a productive economy. Policymakers should continue to explore ways to shift from more distortive taxes like those on income toward taxes that are less likely to cause economic disruptions like consumption or property taxes.
| Percent of Total Revenue Raised | ||||||
|---|---|---|---|---|---|---|
| Country | Individual Taxes | Corporate Taxes | Social Insurance Taxes | Property Taxes | Consumption Taxes | Other |
| Australia (a) | 42 | 17.1 | 0 | 9.8 | 26.3 | 4.7 |
| Austria | 22 | 4.9 | 37 | 1.4 | 27.2 | 7.5 |
| Belgium | 27.7 | 7.7 | 31.8 | 8 | 24.8 | 0 |
| Canada | 36.3 | 12.3 | 14.2 | 12.1 | 21.6 | 3.4 |
| Chile | 10.3 | 24.3 | 8 | 5.2 | 54.9 | 0 |
| Colombia | 6.9 | 24.5 | 9.9 | 9.7 | 41.4 | 7.6 |
| Costa Rica | 6.8 | 8.4 | 36.1 | 2 | 33.3 | 13.4 |
| Czechia | 13.5 | 8.4 | 46.1 | 0.6 | 31.5 | 0 |
| Denmark | 54.2 | 5.6 | 0.1 | 4.2 | 30.7 | 5.1 |
| Estonia | 17.8 | 4.9 | 37.3 | 0.6 | 39.3 | 0 |
| Finland | 30 | 5 | 27.5 | 3.6 | 33.9 | 0.1 |
| France | 21 | 5.1 | 32.7 | 8.8 | 27 | 5.4 |
| Germany | 27 | 4.3 | 39.7 | 3.3 | 25.7 | 0 |
| Greece (b) | 15.8 | 5.4 | 33.2 | 7.9 | 38.5 | 1.1 |
| Hungary | 14.8 | 2.8 | 31 | 3 | 45.4 | 3 |
| Iceland | 42.3 | 6 | 8.9 | 6.8 | 31 | 5.1 |
| Ireland | 32.7 | 15.9 | 17 | 5.7 | 27.8 | 1 |
| Israel | 22.1 | 9.3 | 17 | 9.9 | 35.7 | 5.9 |
| Italy | 26.9 | 4.9 | 31.5 | 5.7 | 26.9 | 4.1 |
| Japan (a) | 18.8 | 12 | 41 | 8.2 | 19.7 | 0.3 |
| Latvia | 19.1 | 2.3 | 31.6 | 3 | 44 | 0 |
| Lithuania | 23 | 5.1 | 33.4 | 1 | 37.5 | 0 |
| Luxembourg | 25.5 | 12 | 29.3 | 10 | 23 | 0.1 |
| Mexico (a) | 21 | 20.1 | 13.9 | 1.6 | 37.2 | 6.1 |
| Netherlands | 22.8 | 7.8 | 34.3 | 4.2 | 30.3 | 0.6 |
| New Zealand (b) | 38.3 | 14.2 | 0 | 5.9 | 38.8 | 3.1 |
| Norway | 29.2 | 6.2 | 28.9 | 3.4 | 32.2 | 0.2 |
| Poland | 14.4 | 6.3 | 38.4 | 3.6 | 33.8 | 3.5 |
| Portugal | 19.9 | 7.9 | 29.5 | 4.2 | 37.5 | 1 |
| Republic of Korea | 18.8 | 12.1 | 28 | 14.2 | 24.4 | 2.4 |
| Slovakia | 10.9 | 7.2 | 44.6 | 1.4 | 35.1 | 0.7 |
| Slovenia | 14.7 | 3.6 | 45.7 | 1.7 | 34.2 | 0.1 |
| Spain | 23.8 | 5.4 | 37.5 | 6.7 | 26.7 | 0 |
| Sweden | 29.1 | 6.6 | 21.5 | 2.2 | 28.6 | 12 |
| Switzerland | 30.7 | 11.1 | 25.1 | 7.8 | 18.8 | 6.6 |
| Turkey | 13.2 | 8.7 | 29.7 | 4.4 | 43 | 1 |
| United Kingdom | 28.9 | 7.1 | 20.9 | 11.8 | 31 | 0.4 |
| United States of America | 41.1 | 5.1 | 24.8 | 11.9 | 16.9 | 0.1 |
|
Note: (a) Data for Australia, Japan, and Mexico is from 2019 because 2020 data was not available yet. (b) For Greece and New Zealand only the aggregate Taxes on Income, Profits, and Capital Gains were available for 2020. To split this aggregate into the three subcategories of Individual Income Taxes, Corporate Income Taxes, and Other Income Taxes, each subcategory’s average share of the three years prior (2017-2019) was used to weigh it. Source: OECD, “Revenue Statistics – OECD Countries Comparative Tables.” |
||||||
Stay informed on the tax policies impacting you.
Subscribe to get insights from our trusted experts delivered straight to your inbox.
Subscribe