Note: Each year we review and improve the methodology of the Index. For that reason, prior editions are not comparable to the results in this 2020 edition. All data and methodological notes are accessible in our GitHub repository.
Taxes make more sense with us in your inbox.
Subscribe to our newsletter for tax insights that cut through the noise—and make sense of it.
Sign UpIntroduction
The structure of a country’s tax code is an important determinant of its economic performance. A well-structured taxA tax is a mandatory payment or charge collected by local, state, and national governments from individuals or businesses to cover the costs of general government services, goods, and activities. code is easy for taxpayers to comply with and can promote economic development while raising sufficient revenue for a government’s priorities. In contrast, poorly structured tax systems can be costly, distort economic decision-making, and harm domestic economies.
Many countries have recognized this and have reformed their tax codes. Over the past few decades, marginal tax rates on corporate and individual income have declined significantly across the Organisation for Economic Co-operation and Development (OECD). Now, most OECD nations raise a significant amount of revenue from broad-based taxes such as payroll taxes and value-added taxes (VAT).[1]
Not all recent changes in tax policy among OECD countries have improved the structure of tax systems; some have made a negative impact. Though some countries like the United States and Belgium have reduced their corporate income taxA corporate income tax (CIT) is levied by federal and state governments on business profits. Many companies are not subject to the CIT because they are taxed as pass-through businesses, with income reportable under the individual income tax. rates by several percentage points, others, like Korea and Portugal, have increased them. Corporate tax base improvements have been put in place in the United States, United Kingdom, and Canada, while tax bases have been made less competitive in Chile and Korea.
The COVID-19 pandemic has led many countries to adopt temporary changes to their tax systems. Faced with revenue shortfalls from the downturn, countries will need to consider how to best structure their tax systems to foster both an economic recovery and raise revenue.
The variety of approaches to taxation among OECD countries creates a need for a way to evaluate these systems relative to each other. For that purpose, we have developed the International Tax Competitiveness Index to compare the ways that countries structure their tax systems.
The International Tax Competitiveness Index
The International Tax Competitiveness Index (ITCI) seeks to measure the extent to which a country’s tax system adheres to two important aspects of tax policy: competitiveness and neutrality.
A competitive tax code is one that keeps marginal tax rates low. In today’s globalized world, capital is highly mobile. Businesses can choose to invest in any number of countries throughout the world to find the highest rate of return. This means that businesses will look for countries with lower tax rates on investment to maximize their after-tax rate of return. If a country’s tax rate is too high, it will drive investment elsewhere, leading to slower economic growth. In addition, high marginal tax rates can lead to tax avoidance.
According to research from the OECD, corporate taxes are most harmful for economic growth, with personal income taxes and consumption taxes being less harmful. Taxes on immovable property have the smallest impact on growth.[2]
Separately, a neutral tax code is simply one that seeks to raise the most revenue with the fewest economic distortions. This means that it doesn’t favor consumption over saving, as happens with investment taxes and wealth taxes. This also means few or no targeted tax breaks for specific activities carried out by businesses or individuals.
As tax laws become more complex, they also become less neutral. If, in theory, the same taxes apply to all businesses and individuals, but the rules are such that large businesses or wealthy individuals can change their behavior to gain a tax advantage, this undermines the neutrality of a tax system.
A tax code that is competitive and neutral promotes sustainable economic growth and investment while raising sufficient revenue for government priorities.
There are many factors unrelated to taxes which affect a country’s economic performance. Nevertheless, taxes play an important role in the health of a country’s economy.
To measure whether a country’s tax system is neutral and competitive, the ITCI looks at more than 40 tax policy variables. These variables measure not only the level of tax rates, but also how taxes are structured. The Index looks at a country’s corporate taxes, individual income taxes, consumption taxes, property taxes, and the treatment of profits earned overseas. The ITCI gives a comprehensive overview of how developed countries’ tax codes compare, explains why certain tax codes stand out as good or bad models for reform, and provides important insight into how to think about tax policy.
Due to some data limitations, recent tax changes in some countries may not be reflected in this year’s version of the International Tax Competitiveness Index.
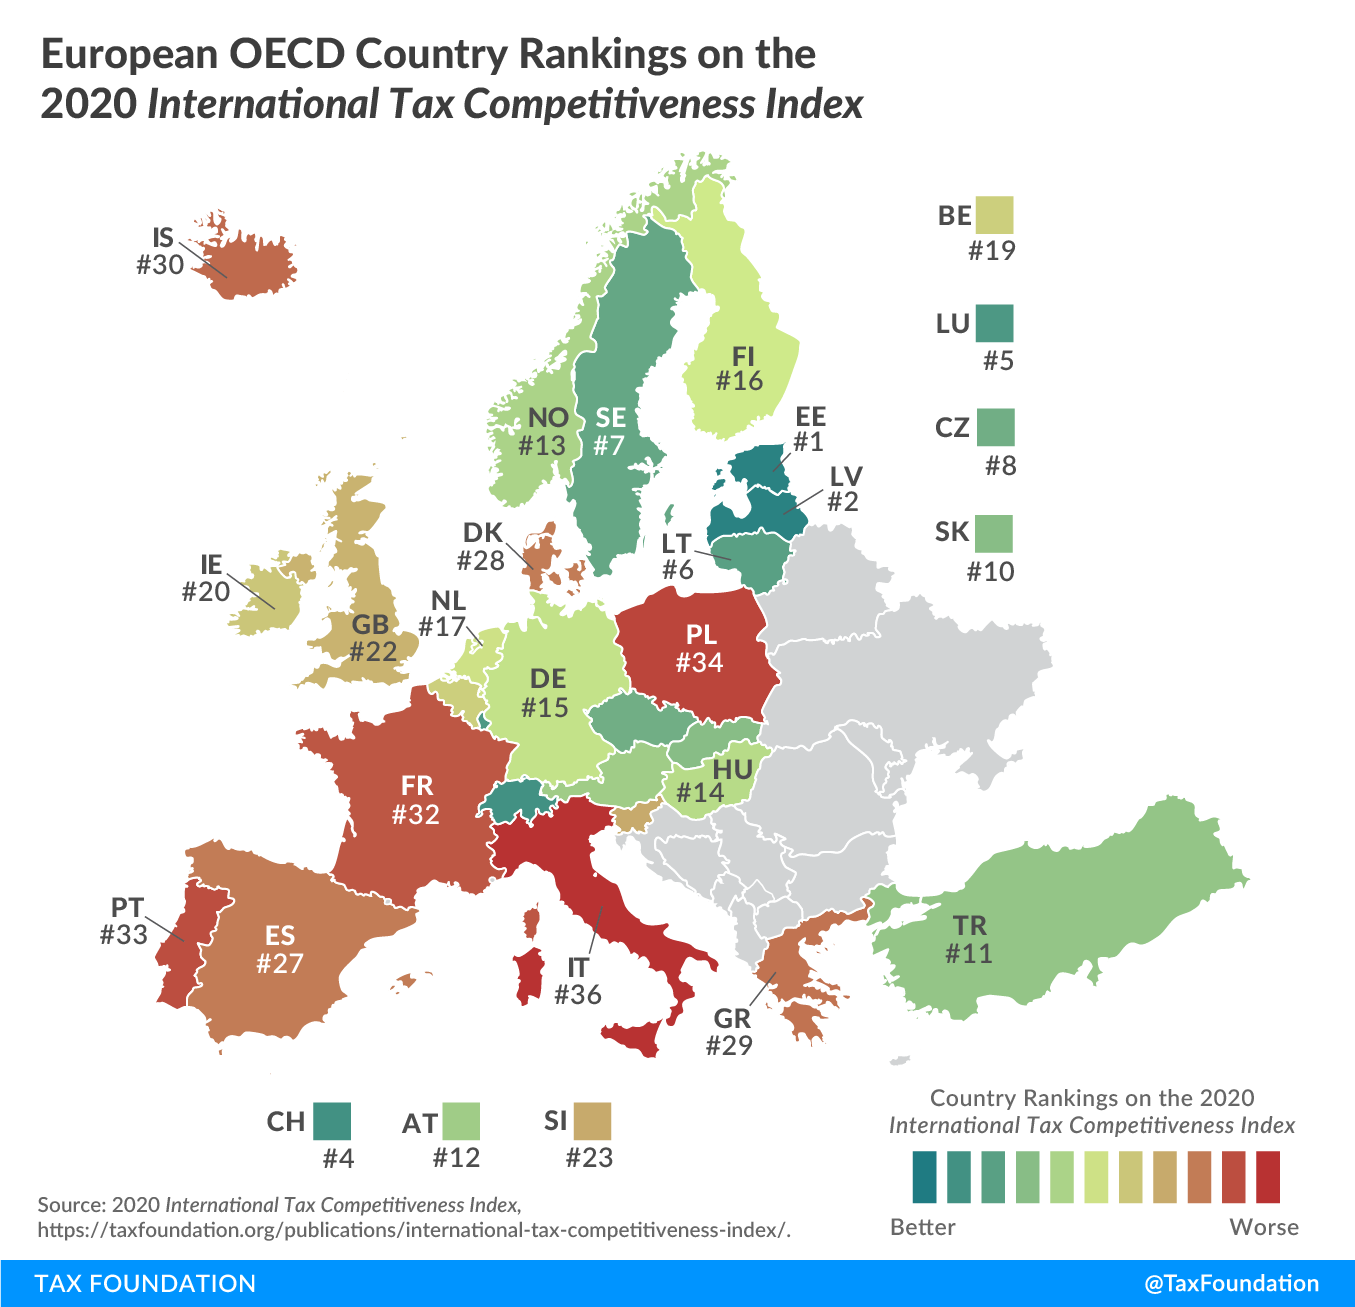
2020 Rankings
For the seventh year in a row, Estonia has the best tax code in the OECD. Its top score is driven by four positive features of its tax system. First, it has a 20 percent tax rate on corporate income that is only applied to distributed profits. Second, it has a flat 20 percent tax on individual income that does not apply to personal dividend income. Third, its property taxA property tax is primarily levied on immovable property like land and buildings, as well as on tangible personal property that is movable, like vehicles and equipment. Property taxes are the single largest source of state and local revenue in the U.S. and help fund schools, roads, police, and other services. applies only to the value of land, rather than to the value of real property or capital. Finally, it has a territorial tax system that exempts 100 percent of foreign profits earned by domestic corporations from domestic taxation, with few restrictions.
Taxes make more sense with us in your inbox.
Subscribe to our newsletter for tax insights that cut through the noise—and make sense of it.
Sign Up| Country | Overall Rank | Overall Score | Corporate Tax Rank | Individual Taxes Rank | Consumption Taxes Rank | Property Taxes Rank | International Tax Rules Rank |
|---|---|---|---|---|---|---|---|
| Estonia | 1 | 100 | 2 | 1 | 9 | 1 | 16 |
| Latvia | 2 | 84.4 | 1 | 5 | 26 | 6 | 9 |
| New Zealand | 3 | 82.4 | 24 | 4 | 6 | 2 | 20 |
| Switzerland | 4 | 77.1 | 14 | 14 | 1 | 34 | 3 |
| Luxembourg | 5 | 76 | 26 | 20 | 3 | 14 | 6 |
| Lithuania | 6 | 75.8 | 3 | 7 | 23 | 7 | 23 |
| Sweden | 7 | 74 | 8 | 19 | 16 | 5 | 11 |
| Czech Republic | 8 | 73.1 | 7 | 3 | 34 | 9 | 10 |
| Australia | 9 | 71.4 | 30 | 17 | 7 | 3 | 25 |
| Slovak Republic | 10 | 69.9 | 18 | 2 | 33 | 4 | 31 |
| Turkey | 11 | 69.9 | 15 | 6 | 20 | 21 | 12 |
| Austria | 12 | 68.7 | 21 | 29 | 13 | 13 | 5 |
| Norway | 13 | 68.1 | 11 | 15 | 18 | 19 | 14 |
| Hungary | 14 | 67.9 | 4 | 9 | 35 | 24 | 4 |
| Germany | 15 | 67.9 | 29 | 25 | 12 | 11 | 7 |
| Finland | 16 | 65.7 | 6 | 28 | 14 | 16 | 22 |
| Netherlands | 17 | 65.5 | 25 | 21 | 15 | 27 | 2 |
| Canada | 18 | 65.3 | 23 | 27 | 8 | 22 | 13 |
| Belgium | 19 | 64.1 | 13 | 10 | 28 | 20 | 19 |
| Ireland | 20 | 63.1 | 5 | 32 | 24 | 17 | 17 |
| United States | 21 | 62.9 | 19 | 23 | 5 | 28 | 32 |
| United Kingdom | 22 | 61.6 | 17 | 24 | 22 | 33 | 1 |
| Slovenia | 23 | 61.4 | 12 | 12 | 30 | 23 | 18 |
| Korea | 24 | 59.9 | 33 | 22 | 2 | 30 | 33 |
| Israel | 25 | 59.2 | 20 | 30 | 10 | 10 | 34 |
| Japan | 26 | 59.1 | 36 | 18 | 4 | 26 | 29 |
| Spain | 27 | 58.5 | 28 | 16 | 11 | 35 | 15 |
| Denmark | 28 | 58.3 | 16 | 35 | 17 | 15 | 28 |
| Greece | 29 | 55.9 | 22 | 8 | 31 | 32 | 24 |
| Iceland | 30 | 55.4 | 10 | 34 | 19 | 25 | 30 |
| Mexico | 31 | 51.5 | 31 | 13 | 25 | 8 | 35 |
| France | 32 | 50.7 | 35 | 36 | 21 | 29 | 8 |
| Portugal | 33 | 46.9 | 34 | 31 | 32 | 18 | 26 |
| Poland | 34 | 46.6 | 9 | 11 | 36 | 31 | 27 |
| Chile | 35 | 46.3 | 32 | 26 | 27 | 12 | 36 |
| Italy | 36 | 44.3 | 27 | 33 | 29 | 36 | 21 |
While Estonia’s tax system is the most competitive in the OECD, the other top countries’ tax systems receive high scores due to excellence in one or more of the major tax categories. Latvia, which recently adopted the Estonian system for corporate taxation, also has a relatively efficient system for taxing labor income. New Zealand has a relatively flat, low-rate individual income tax that also exempts capital gains (with a combined top rate of 33 percent), a well-structured property tax, and a broad-based value-added tax. Switzerland has a relatively low corporate tax rate (21.1 percent), a low, broad-based consumption taxA consumption tax is typically levied on the purchase of goods or services and is paid directly or indirectly by the consumer in the form of retail sales taxes, excise taxes, tariffs, value-added taxes (VAT), or income taxes where all savings are tax-deductible., and a relatively flat individual income taxAn individual income tax (or personal income tax) is levied on the wages, salaries, investments, or other forms of income an individual or household earns. The U.S. imposes a progressive income tax where rates increase with income. The Federal Income Tax was established in 1913 with the ratification of the 16th Amendment. Though barely 100 years old, individual income taxes are the largest source that exempts capital gains from taxation. Luxembourg has a broad-based consumption tax and a competitive international tax system.
Italy has the least competitive tax system in the OECD. It has a wealth taxA wealth tax is imposed on an individual’s net wealth, or the market value of their total owned assets minus liabilities. A wealth tax can be narrowly or widely defined, and depending on the definition of wealth, the base for a wealth tax can vary., a financial transaction tax, and an estate tax. Italy also has a high compliance burden associated with its individual tax system. It takes businesses an estimated 169 hours to comply with the individual income tax. The Italian consumption tax system covers less than 40 percent of final consumption, revealing both policy and enforcement gaps.
In general, countries that rank poorly on the ITCI levy relatively high marginal tax rates on corporate income. The five countries at the bottom of the rankings all have higher than average corporate tax rates, except for Poland, at 19 percent. In addition, all five countries have high consumption tax rates, with rates of 20 percent or higher, except for Chile, at 19 percent.
Notable Changes from Last Year[3]
Belgium
The corporate tax rate in Belgium fell from 29.58 percent to 25 percent, its wealth tax was abolished following a constitutional court decision, and CFC rules were enacted. Belgium’s ranking rose from 23rd to 19th.
France
France is in the process of reducing its corporate income tax rate over several years, concluding in 2022. As part of this scheduled reduction, France reduced its combined corporate rate (including a surtaxA surtax is an additional tax levied on top of an already existing business or individual tax and can have a flat or progressive rate structure. Surtaxes are typically enacted to fund a specific program or initiative, whereas revenue from broader-based taxes, like the individual income tax, typically cover a multitude of programs and services.) from 34.43 percent to 32.02 percent. Its withholding tax rates on dividends and royalties levied on individuals from non-treaty countries were also reduced slightly. Its Index rank remained unchanged at 32.
Israel
Israel’s ranking rose from 31st to 25th due to a reduction in required tax payments as measured by the PwC’s “Paying Taxes” data.[4] Labor tax payments fell from 12 to 1 and other tax payments fell from 14 to 3. Israel also concluded two new tax treaties, broadening its tax treaty network.
Japan
After multiple postponements, Japan increased its VAT rate from 8 percent to 10 percent. In addition, stricter interest deduction limitations were introduced. Japan’s rank fell from 22nd to 26th.
New Zealand
New Zealand implemented a temporary 1-year loss carryback provision as part of its COVID-19 response. The government is currently discussing making this provision permanent. New Zealand’s rank remained unchanged at 3.
Norway
As part of its COVID-19 response, Norway implemented a temporary 2-year loss carryback provision. Norway’s rank improved from 14th to 13th.
Slovenia
Slovenia increased the limit on loss carryforward provisions from a 50 percent to a 63 percent limitation, narrowing its tax baseThe tax base is the total amount of income, property, assets, consumption, transactions, or other economic activity subject to taxation by a tax authority. A narrow tax base is non-neutral and inefficient. A broad tax base reduces tax administration costs and allows more revenue to be raised at lower rates. and making it slightly more countercyclical. Slovenia’s ranking rose from 24th to 23rd.
Switzerland
Switzerland implemented a patent box regime at the cantonal level. Previously, only one canton—Nidwalden—had a patent boxA patent box—also referred to as intellectual property (IP) regime—taxes business income earned from IP at a rate below the statutory corporate income tax rate, aiming to encourage local research and development. Many patent boxes around the world have undergone substantial reforms due to profit shifting concerns.. The dividends tax rate was slightly increased from 21.14 percent to 22.29 percent. Switzerland’s rank remained unchanged at 4.
| Country | 2018 Rank | 2018 Score | 2019 Rank | 2019 Score | 2020 Rank | 2020 Score | Change in Rank from 2019 to 2020 | Change in Score from 2019 to 2020 |
|---|---|---|---|---|---|---|---|---|
| Australia | 11 | 68.9 | 9 | 71.3 | 9 | 71.4 | 0 | 0.1 |
| Austria | 12 | 67.8 | 12 | 69 | 12 | 68.7 | 0 | -0.4 |
| Belgium | 21 | 60.9 | 23 | 61 | 19 | 64.1 | 4 | 3.1 |
| Canada | 18 | 62.6 | 18 | 65.4 | 18 | 65.3 | 0 | -0.1 |
| Chile | 34 | 45.1 | 34 | 46.9 | 35 | 46.3 | -1 | -0.7 |
| Czech Republic | 8 | 71.4 | 8 | 72.9 | 8 | 73.1 | 0 | 0.2 |
| Denmark | 26 | 58.3 | 26 | 58.2 | 28 | 58.3 | -2 | 0.1 |
| Estonia | 1 | 100 | 1 | 100 | 1 | 100 | 0 | 0 |
| Finland | 17 | 64.4 | 17 | 65.8 | 16 | 65.7 | 1 | 0 |
| France | 36 | 43.1 | 32 | 49.2 | 32 | 50.7 | 0 | 1.5 |
| Germany | 15 | 65.8 | 13 | 68.1 | 15 | 67.9 | -2 | -0.2 |
| Greece | 31 | 48.1 | 29 | 53.4 | 29 | 55.9 | 0 | 2.5 |
| Hungary | 16 | 65.7 | 15 | 67.3 | 14 | 67.9 | 1 | 0.6 |
| Iceland | 28 | 55.3 | 28 | 56.7 | 30 | 55.4 | -2 | -1.3 |
| Ireland | 19 | 61.9 | 19 | 62.9 | 20 | 63.1 | -1 | 0.2 |
| Israel | 32 | 48 | 31 | 49.9 | 25 | 59.2 | 6 | 9.3 |
| Italy | 35 | 44.6 | 36 | 44.7 | 36 | 44.3 | 0 | -0.3 |
| Japan | 23 | 60.7 | 22 | 62.3 | 26 | 59.1 | -4 | -3.1 |
| Korea | 22 | 60.7 | 25 | 60.1 | 24 | 59.9 | 1 | -0.2 |
| Latvia | 2 | 82.1 | 2 | 83.9 | 2 | 84.4 | 0 | 0.6 |
| Lithuania | 6 | 75.8 | 5 | 78 | 6 | 75.8 | -1 | -2.1 |
| Luxembourg | 4 | 76.7 | 6 | 76.1 | 5 | 76 | 1 | -0.1 |
| Mexico | 29 | 51.7 | 30 | 52.9 | 31 | 51.5 | -1 | -1.4 |
| Netherlands | 9 | 69.8 | 16 | 67.2 | 17 | 65.5 | -1 | -1.7 |
| New Zealand | 3 | 79.9 | 3 | 83.2 | 3 | 82.4 | 0 | -0.7 |
| Norway | 13 | 66.2 | 14 | 68.1 | 13 | 68.1 | 1 | 0 |
| Poland | 30 | 50.3 | 35 | 45.9 | 34 | 46.6 | 1 | 0.6 |
| Portugal | 33 | 45.2 | 33 | 47 | 33 | 46.9 | 0 | 0 |
| Slovak Republic | 10 | 69.8 | 11 | 69.5 | 10 | 69.9 | 1 | 0.4 |
| Slovenia | 25 | 59.9 | 24 | 60.3 | 23 | 61.4 | 1 | 1 |
| Spain | 27 | 56.3 | 27 | 58.1 | 27 | 58.5 | 0 | 0.4 |
| Sweden | 7 | 73.7 | 7 | 74 | 7 | 74 | 0 | 0 |
| Switzerland | 5 | 76.5 | 4 | 78.7 | 4 | 77.1 | 0 | -1.7 |
| Turkey | 14 | 66.1 | 10 | 70.2 | 11 | 69.9 | -1 | -0.3 |
| United Kingdom | 24 | 60.5 | 21 | 62.4 | 22 | 61.6 | -1 | -0.9 |
| United States | 20 | 60.9 | 20 | 62.8 | 21 | 62.9 | -1 | 0.1 |
Methodological Changes
Each year we review the data and methodology of the Index for ways that could improve how it measures both competitiveness and neutrality. This year we have incorporated several changes to the way the Index treats corporate taxes, consumption taxes, and international taxes. No changes were made to the individual or property tax categories other than routine updates to incorporate the most recent data.
We have applied each change to prior years to allow consistent comparison across years. Data for all years using the current methodology is accessible in the GitHub repository for the Index,[1] and a description of how the Index is calculated is provided in the Appendix of this report. Prior editions of the Index, however, are not comparable to the results in this 2020 edition due to these methodological changes.
Corporate Tax
The two changes in the corporate tax data were adding a new variable (Allowances for Corporate Equity) and changing the data source for R&D tax credits.
Allowances for Corporate Equity (ACEs) contribute to the neutrality of corporate tax systems by providing a deduction for equity comparable to deductions for interest costs. This reduces the debt bias in corporate tax systems by lowering the cost of capital for equity-financed investments relative to debt-financed investments.
The ACE variable is now included in the Cost Recovery subcategory. This change improves the rank of countries that have ACE relative to those countries that do not.
We also changed the data source for R&D tax credits. Previously we treated countries as having an R&D tax creditA tax credit is a provision that reduces a taxpayer’s final tax bill, dollar-for-dollar. A tax credit differs from deductions and exemptions, which reduce taxable income rather than the taxpayer’s tax bill directly. as a binary option: either a country had an R&D tax credit, or it did not. However, we are now using OECD data on the implied tax subsidy of R&D credits and similar expenditure-based R&D tax incentives.[2] This measure captures the full extent of each country’s expenditure-based R&D tax incentives, and thus more accurately captures how distortive a country’s R&D tax subsidies are. The larger the implied tax subsidy, the lower a country will score on the Incentives/Complexity subcategory.
This change improves the rank of countries that have an R&D tax credit but a low implied tax subsidy rate and worsens the rank of countries that have a large implied tax subsidy rate.
Consumption Tax
While most countries in the OECD administer a value-added tax (VAT) at the national level, the U.S. is an exception as it instead levies retail sales taxes at the state level. For the Index this requires several calculations to compare the U.S. state retail sales taxes to national VATs. This year we are calculating the U.S. consumption tax base using the concept of the VAT revenue ratio (VRR) used by the OECD combined with a population-weighted average sales taxA sales tax is levied on retail sales of goods and services and, ideally, should apply to all final consumption with few exemptions. Many governments exempt goods like groceries; base broadening, such as including groceries, could keep rates lower. A sales tax should exempt business-to-business transactions which, when taxed, cause tax pyramiding. rate. The U.S. consumption tax revenue ratio was calculated using the following formula: VRR(US) = Sales Tax Revenue/[(Consumption – Sales Tax Revenue) x Average Sales Tax Rate Weighted by Population].
This change slightly worsens the U.S. rank on the Consumption Tax Base category relative to previous editions of the Index.
International Taxes
Prior editions of the Index included withholdingWithholding is the income an employer takes out of an employee’s paycheck and remits to the federal, state, and/or local government. It is calculated based on the amount of income earned, the taxpayer’s filing status, the number of allowances claimed, and any additional amount the employee requests. tax rates and a country’s tax treaty network in the same subcategory. This year we are separating the tax treaties variable from the withholding taxes variables, effectively giving the tax treaties variable more importance in the Index calculation.
This change reflects that most OECD countries’ tax treaty networks include the other OECD countries while the withholding taxes more commonly apply to non-OECD countries. Splitting the variables into two categories provides an in-network rank (the new Tax Treaties subcategory) and an out-of-network rank (the Withholding Taxes subcategory) for a country’s international tax policies.
This change benefits countries with large tax treaty networks.
Launch Interactive Country Pages
Taxes make more sense with us in your inbox.
Subscribe to our newsletter for tax insights that cut through the noise—and make sense of it.
Sign Up[1] Tax Foundation, “International Tax Competitiveness Index,” https://github.com/TaxFoundation/international-tax-competitiveness-index.
[2] OECD, “R&D Tax Incentive Indicators: Implied tax subsidy rates on R&D expenditures,” https://stats.oecd.org/Index.aspx?DataSetCode=RDSUB.
[1] Cristina Enache, “Sources of Government Revenue in the OECD,” Tax Foundation, Feb. 19, 2020, https://taxfoundation.org/publications/sources-of-government-revenue-in-the-oecd/.
[2] Organisation for Economic Co-operation and Development (OECD), “Tax and Economic Growth,” Economics Department Working Paper No. 620, July 11, 2008.
[3] Last year’s scores published in this report can differ from previously published rankings due to both methodological changes and corrections made to previous years’ data.
[4] PwC, “Paying Taxes 2020,” https://www.pwc.com/gx/en/services/tax/publications/paying-taxes-2020.html#tools.
Share this article