
What You’ll Learn
- Get answers to some of the taxA tax is a mandatory payment or charge collected by local, state, and national governments from individuals or businesses to cover the costs of general government services, goods, and activities. policy questions we hear most often from taxpayers, businesses, and journalists.
- Learn everything from the basics of who pays taxes and the difference between credits and deductions, to how taxes impact the economy and what constitutes sound tax policy.
- Discover additional resources to explore each question and topic in more depth.
Most Frequent Questions
The simple answer is that everyone pays taxes. The reality of who pays how much is more complicated.
The amount of taxes an individual pays is highly dependent on where they live, how much they earn, what they buy, and what they own, among other factors.
As with any progressive income tax system, U.S. taxpayers with higher incomes pay higher income tax rates. The result: half of taxpayers pay 97 percent of all income taxes.

In fact, after factoring in tax credits aimed at helping low-income individuals, about one-third of U.S. taxpayers pay no income tax at all.

Income taxes are only part of the story, though. Most Americans pay more in payroll taxes than they do in income taxes.

Unlike income taxes, payroll taxes, as well as sales and excise taxes, are regressive. That means lower-income individuals contribute a greater share of their total income towards these taxes than do higher-income individuals.
Even taking this into account, a steeply progressive income tax rate schedule, paired with tax credits that redistribute income from the rich to the poor, ensures that the U.S. tax code is progressive overall. As the chart below shows, the wealthy in America pay a disproportionate share of total federal taxes compared to their share of income.

All taxes have some impact on the economy because they have some impact on taxpayer behavior. That said, no two taxes impact the economy the same.
One way to think about this is as a hierarchy: Which taxes are most and least harmful for long-term economic growth? This hierarchy is determined by which factors are most mobile, and thus most sensitive to high tax rates—in other words, what economic activities, if taxed, can easily be moved, reduced, or otherwise changed to avoid that tax?
Taxes on the most mobile factors in the economy, such as capital, cause the most distortions and have the most negative impact. Taxes on factors that can’t easily be moved, such as land, are the most stable and least distortive.
It’s relatively easy for someone to invest less to avoid a wealth tax, for example. It’s much harder for someone to pull up stakes and move their home to avoid a property tax. This difference is how wealth taxes distort people’s decisions, and thus the economy, more than property taxes.

Now that we have a basic understanding of the relative impact that different types of taxes have on the economy, we can use this information to guide lawmakers on crafting tax policies to improve economic growth. Theoretically, reducing the most harmful taxes should have the biggest impact on economic growth.
We can test this theory using a dynamic economic tax model (see more on dynamic scoring below) to produce what we refer to as a “bang for your buck” analysis—a ranking of how much economic growth is produced per dollar of revenue forgone by different tax reductions.
The chart below takes the three income taxes from the chart above—corporate income tax, individual income tax, and payroll tax—and compares how much economic growth each would produce per dollar of revenue reduction.
As you can see, cutting the payroll tax rate is the least efficient way to produce economic growth. That’s because payroll taxes are already one of the least harmful forms of income taxation. Dollar-for-dollar, cutting the corporate income tax rate is the most efficient way for policymakers to generate economic growth because the corporate income tax is one of the most economically damaging forms of income taxation.

We believe there are four universal principles that should guide all good tax policy:
Simplicity
Tax codes should be easy for taxpayers to comply with and for governments to administer and enforce.
Transparency
Tax policies should clearly and plainly define what taxpayers must pay and when they must pay it. Disguising tax burdens in complex structures should be avoided. Additionally, any changes to the tax code should be made with careful consideration, input, and open hearings.
Neutrality
Taxes should neither encourage nor discourage personal or business decisions. The purpose of taxes is to raise needed revenue, not to favor or punish specific industries, activities, and products. Minimizing tax preferences broadens the tax base, so that the government can raise sufficient revenue with lower rates.
Stability
Taxpayers deserve consistency and predictability in the tax code. Governments should avoid enacting temporary tax laws, including tax holidays, amnesties, and retroactive changes.
Learn More
Tax brackets are the range of incomes taxed at given rates, which typically differ depending on filing status. In a progressive income tax system, rates rise as income rises.
When a taxpayer earns enough income to move into a higher income tax bracket, they typically pay the corresponding income tax rate only on the income earned above the bracket threshold.
For example, imagine a tax system consisting of only two brackets: one bracket taxed at 10 percent that applies to all income between $0 and $50 and a second bracket taxed at 20 percent that applies to all income between $51 and $100.
If a taxpayer earned $50 in this scenario, they would pay $5 in income taxes—$50 x 10%.
If a taxpayer earned $100, they would pay $15 in income taxes—($50 x 10%) + ($50 x 20%). Only the income earned above the first $50 bracket threshold is taxed at the corresponding 20 percent rate, not all $100 of the taxpayer’s income.
The chart below illustrates this in another way by showing the amount of tax owed in each U.S. federal income tax bracket for a hypothetical couple filing jointly with $1 million in taxable income. As you can see, not all of the couple’s income is subject to the top 37 percent bracket, only the income above the threshold of $622,050. The result is that only $139,842, less than 40 percent of their total taxes paid, falls in the top income tax bracket.

The marginal tax rate is the tax rate paid on your next dollar of income. For example, if you face a 10 percent marginal tax rate, 10 cents of every next dollar you earn would be taken as tax.
In terms of the U.S. federal income tax system, your statutory marginal tax rate corresponds to the highest tax bracket you face (see above). This is considered “statutory” since it simply describes the top income tax bracket your income falls into as set by law.
While useful in some contexts, statutory marginal tax rates do not paint a complete picture. “Effective” marginal tax rates are useful to calculate because they account for the multiple layers of taxes (such as the income tax and payroll tax) alongside relevant deductions and credits.
Take, for example, two taxpayers filing jointly with two children. At low levels of income, the taxpayers face negative marginal tax rates due to the fully refundable Earned Income Tax Credit (EITC) and partially refundable Child Tax Credit (CTC) (see below for more information on the refundability of tax credits).
Both credits have separate phase-in and phaseout rates, thresholds, and refundability rules, which create changing effective marginal tax rates as taxpayer income rises. As the couple’s income rises above $15,000, the CTC and EITC phase-ins end, and the effective marginal tax rate rises above 0. Eventually, the taxpayers face a marginal tax rate of up to 46.36 percent when earning over $36,801 due to the phaseout of the EITC, the 15.3 percent payroll tax, and the 10 percent individual income tax.

Effective marginal tax rates are important to calculate because they show how workers may be discouraged to work additional hours and earn higher incomes. Higher effective marginal tax rates disincentivize additional work at the margin, which translates into lower productivity and economic growth overall.
Let’s start at the top of the 1040 tax form with your total income, or what is known as Adjusted Gross Income AGI). From your AGI, you subtract your deductions, the largest being either your standard deduction or your itemized deductions. What’s left is your taxable income, the amount upon which you begin to calculate how much you owe in income taxes.
Tax deductions indirectly reduce the amount of taxes owed by reducing taxable income. If a taxpayer earns $200 in income taxed at 10 percent, they will owe $20 ($200 x 10%). If the same taxpayer receives a $50 deduction, their taxable income will be reduced to $150 and they will owe $15 instead ($150 x 10%).
Once you have determined your taxes owed, there is one more step. This involves subtracting any tax credits you may be eligible for, such as the Child Tax Credit or various education credits. Tax credits directly reduce the amount of taxes you owe, dollar-for-dollar. So if you owe $100, a $100 tax credit reduces the amount of income taxes you owe to zero; a $50 tax credit would reduce the taxes you owe to $50.
Tax exemptions typically exclude a certain amount of income from tax altogether. For example, the estate tax has a current exemption of $11 million. This means that estates valued up to $11 million are not subject to the estate tax. In other cases, exemptions can exclude certain taxpayers from having to pay certain taxes altogether, usually contingent on meeting a number of criteria. For example, the Tax Foundation is an educational nonprofit and is tax-exempt under section 501(c)(3) of the U.S. Internal Revenue Code. This means that we do not pay income taxes on the contributions we receive and people who give us contributions can deduct their gift as part of their itemized deductions.
Both refundable and nonrefundable tax credits reduce taxes owed dollar-for-dollar. Refundable tax credits can be used to lower a taxpayer’s liability below $0, with the remaining value of the credit being available as a tax refund. Nonrefundable tax credits can be used to reduce a taxpayer’s liability no lower than $0.
The Earned Income Tax Credit (EITC), for example, is a fully refundable tax credit. In fact, most households receive the EITC as a refund. In 2016, 27.3 million tax returns claimed the EITC for a total of $66.7 billion, of which $57.1 billion was refunded.
In contrast, the $500 Child and Dependent Care Tax Credit (CDCTC) is nonrefundable. If a taxpayer qualifying for the credit owes just $400, their tax liability will be reduced to $0 and they will not receive a refund for the remaining $100 of the credit.
Credits can also be partially refundable, such as the Child Tax Credit (CTC). If the CTC is greater than the taxpayer’s liability, they may receive a refund only up to $1,400 based on an earned income formula. The maximum credit amount is reduced by 5 percent once adjusted gross income (AGI) reaches $200,000 for single filers and $400,000 for married filing jointly.
Taxpayers can either reduce their taxable income by a fixed amount via the standard deduction or choose from a list of eligible expenses called itemized deductions.
If a taxpayer’s itemized deductions total more than the standard deduction, they are best off itemizing.
The Tax Cuts and Jobs Act of 2017 (TCJA) increased the standard deduction from $6,500 to $12,000 for single filers and $13,000 to $24,000 for taxpayers who are married filing jointly. This made the more complex process of itemization a less attractive option for millions of households.
Of those still itemizing, the three most-claimed deductions are for mortgage interest, state and local taxes, and charitable donations, which flow mostly to higher-income taxpayers.

Now, let’s put all the pieces together. Taking each of the concepts outlined above—marginal tax rates and brackets, refundable and nonrefundable credits, and standard and itemized deductions—here is an example of how a taxpayer’s overall liability might be calculated.
Nate is an engineer and earns $75,000. Emily teaches 7th grade and earns $50,000. The couple has two children, ages 7 and 9. In Scenario 1 they rent a townhouse and have no itemized deductions. In Scenario 2, they own their own home and pay $16,000 annually in mortgage interest. They pay a combined $10,000 in property taxes and state income taxes and contribute $2,000 to their church and various charities.
Let’s compare their tax liability in the two scenarios: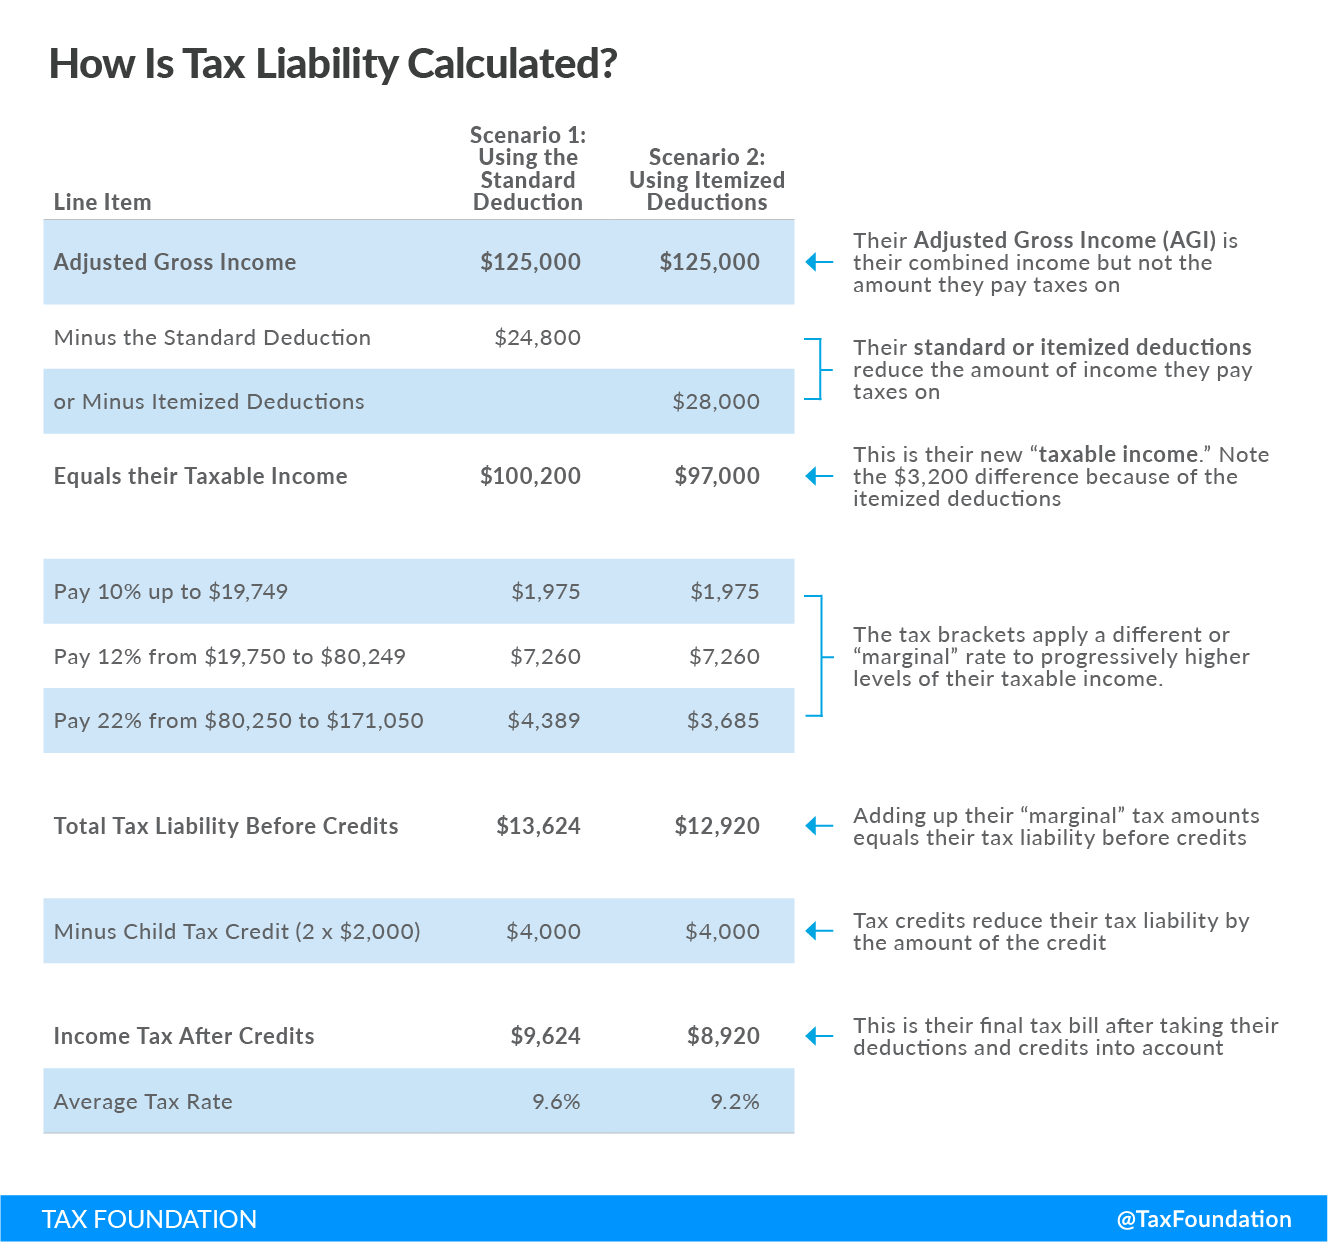
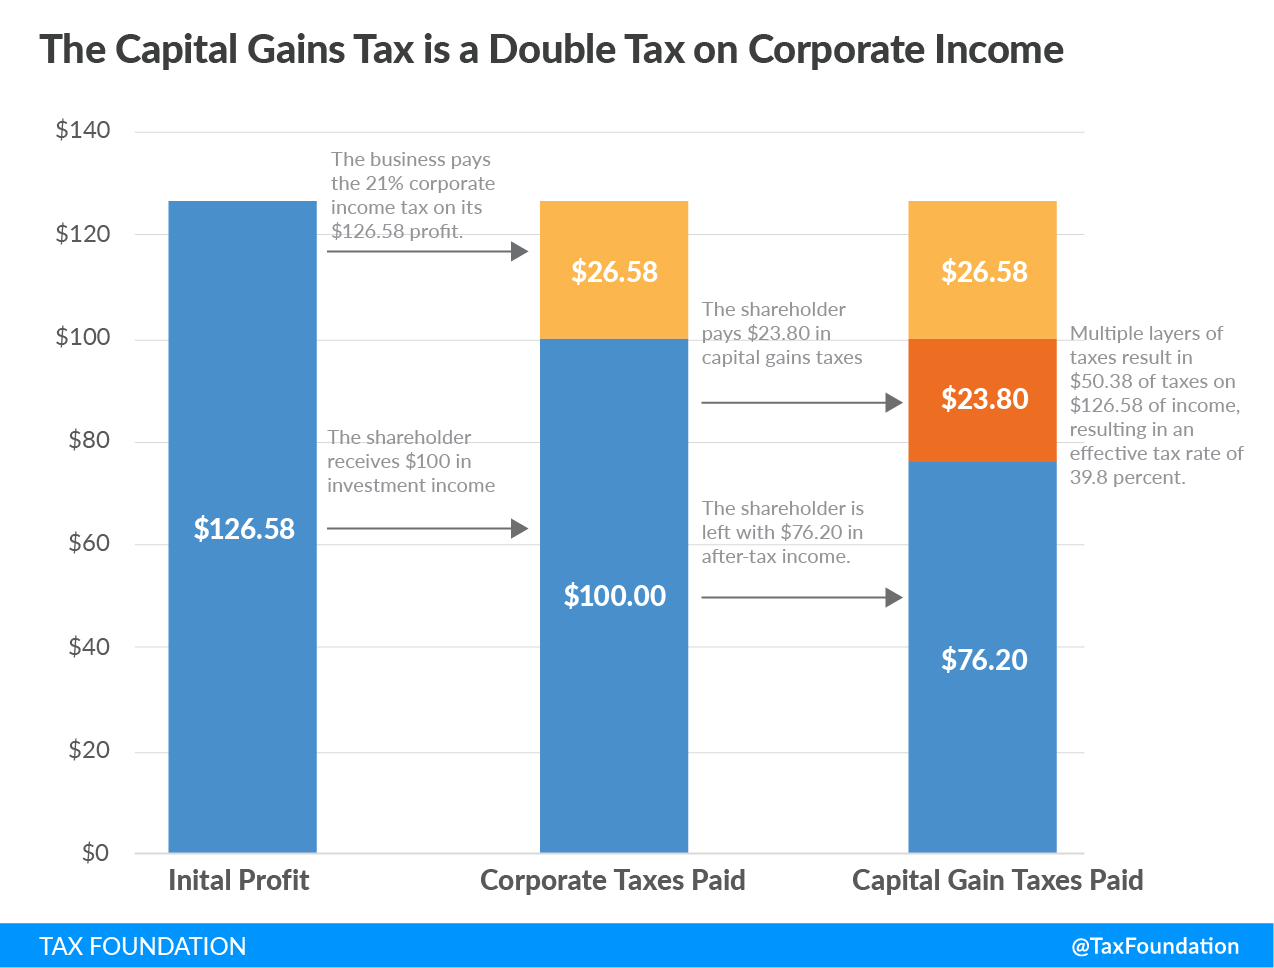
Double taxation is when taxes are paid twice on the same dollar of income.
For example, the United States’ tax code places a double-tax on corporate income with one layer of tax at the corporate level through the corporate income tax and a second layer of tax at the individual level through the dividend and capital gains taxes paid by shareholders.
Additionally, the estate tax creates a double-tax on an individual’s income and the transfer of that income to heirs upon death.
Corporate integration and the removal of the estate tax would address these instances of double taxation.
Businesses and individuals residing in one country but earning income in other countries could also face double taxation if more than one country taxes their earnings. Credits for foreign taxes, territorial taxation, and tax treaties can minimize the likelihood of double taxation of foreign income.
Yes! Tariffs are taxes. Tariffs are a type of excise tax that is levied on goods produced abroad at the time of import. They are intended to increase consumption of goods manufactured at home by increasing the price of foreign-produced goods but have a negative economic impact on all involved.
Though tariffs may shield domestic industries from foreign competition in the short term, they do so at the expense of others in the economy, including domestic consumers and other industries, resulting in reduced economic output, employment, and wages.
Ultimately, tariffs increase the tax burden on domestic consumers in the form of higher prices, landing hardest on lower and middle-income households.
If you’re familiar with our work, you may know that we produce estimates for how different U.S. federal tax policies could impact factors like GDP, wages, jobs, federal revenue, and the distribution of the tax system (who pays how much).
We produce these estimates using an in-house tool we call the Taxes and Growth (TAG) dynamic model.
In economic jargon, the Tax Foundation’s tax model is considered a “general equilibrium” model and consists of three main parts: a tax simulator, a neoclassical production function, and an allocation or demand function. Together, these three components work together to produce revenue and economic estimates.
The Tax Foundation model can produce two types of estimates: comparative statics (the comparison of two different economic scenarios, before and after a significant change), and year-by-year estimates over the 10-year budget window.
Using the comparative statics framework, the model estimates the long-run impact of tax policy by comparing a baseline tax policy and economy to an economy with an alternate tax policy. It essentially tries to answer the question: what would today’s economy look like if an alternative tax policy had always been in place?
In addition to long-run estimates, the Tax Foundation model can create estimates of federal revenues, GDP, wages, investment, capital stock, employment, consumption, and other measures of economic output for each year over a 10-year period.
The procedure for estimating the impact of policies over the 10-year budget window is similar to the procedure for comparative statics estimates. We compare baseline economic and tax parameters to alternative economic and tax parameters to estimate changes in economic output and tax revenue.
However, rather than comparing baseline and simulation parameters for two periods (current year and simulation year), we compare baseline and simulation parameters for each year over the budget window. This allows us to account for short-run economic effects and transitional revenue effects such as temporary tax policies, phase-ins, and phaseouts.
Underlying each of the three main components of the TAG model are a number of equations and assumptions based on our review of the economic literature. A detailed walkthrough of these equations and assumptions is available to explore in depth at the links below.
Taxes and You
Whether you support higher or lower taxes, the reality is that you likely benefit from what they make possible in your daily life. Taxes allow for projects and services that most people benefit from frequently: roads and infrastructure, emergency services, education, and national defense, just to name a few.
Businesses, like your local convenience store, cover the cost of expenses like employee salaries and rent from the profits generated by selling products. Governments don’t sell products and don’t have profits so the only way to cover the cost of services is by asking us to pay taxes on the money we earn, the things we buy, and the property we own.
Some taxes, like property taxes, fund local services such as schools, fire departments, and police. Others, like excise taxes on liquor, cigarettes, and sugar, are implemented as a disincentive to unhealthy behaviors that lead to broad, societal costs.
Taxes have been a staple of governance around the globe for over 5,000 years and are the mechanism by which a government can provide goods and services for its citizens, who may not be able to access them otherwise.
Individual income taxes are among the most significant sources of state tax revenue, accounting for 37 percent of all collections. They’re also one of the most visible tax types to most individuals. That’s because taxpayers are actively responsible for filing their income taxes, in contrast to the indirect payment of sales and excise taxes.
Forty-three states levy individual income taxes. Forty-one tax wage and salary income, while two states—New Hampshire and Tennessee—exclusively tax dividend and interest income. Seven states levy no income tax at all.

Forty-five states and the District of Columbia collect statewide retail sales taxes, one of the more transparent ways to collect tax revenue: consumers can see their tax burden printed directly on their receipts.
In addition to state-level sales taxes consumers also face local sales taxes in 38 states. These rates can be substantial, so a state with a moderate statewide sales tax rate could, in fact, have a very high combined state and local rate compared to other states.
The map below provides a population-weighted average of local sales taxes, to give a sense of the average local rate for each state.

Sales taxes are a form of consumption tax levied on retail sales of goods and services. If you live in the U.S., you are likely familiar with the sales tax from seeing it printed at the bottom of store receipts.
You’re likely less familiar with the use tax, however.
Use tax is owed on out-of-state purchases for which a sales tax was not charged but would be if purchased in-state.
Whereas retailers collect sales tax from consumers, then remit that to state governments, it’s the responsibility of consumers themselves to keep track of and pay their use tax liability.
For example, if you live in Massachusetts, but cross the border to purchase an item of furniture in New Hampshire, which doesn’t levy a sales tax, you’re required to report and pay use tax on that item when filing your personal income tax return.
The use tax rate is equivalent to the sales tax rate that would be owed if the purchase occurred where the taxpayer lives.
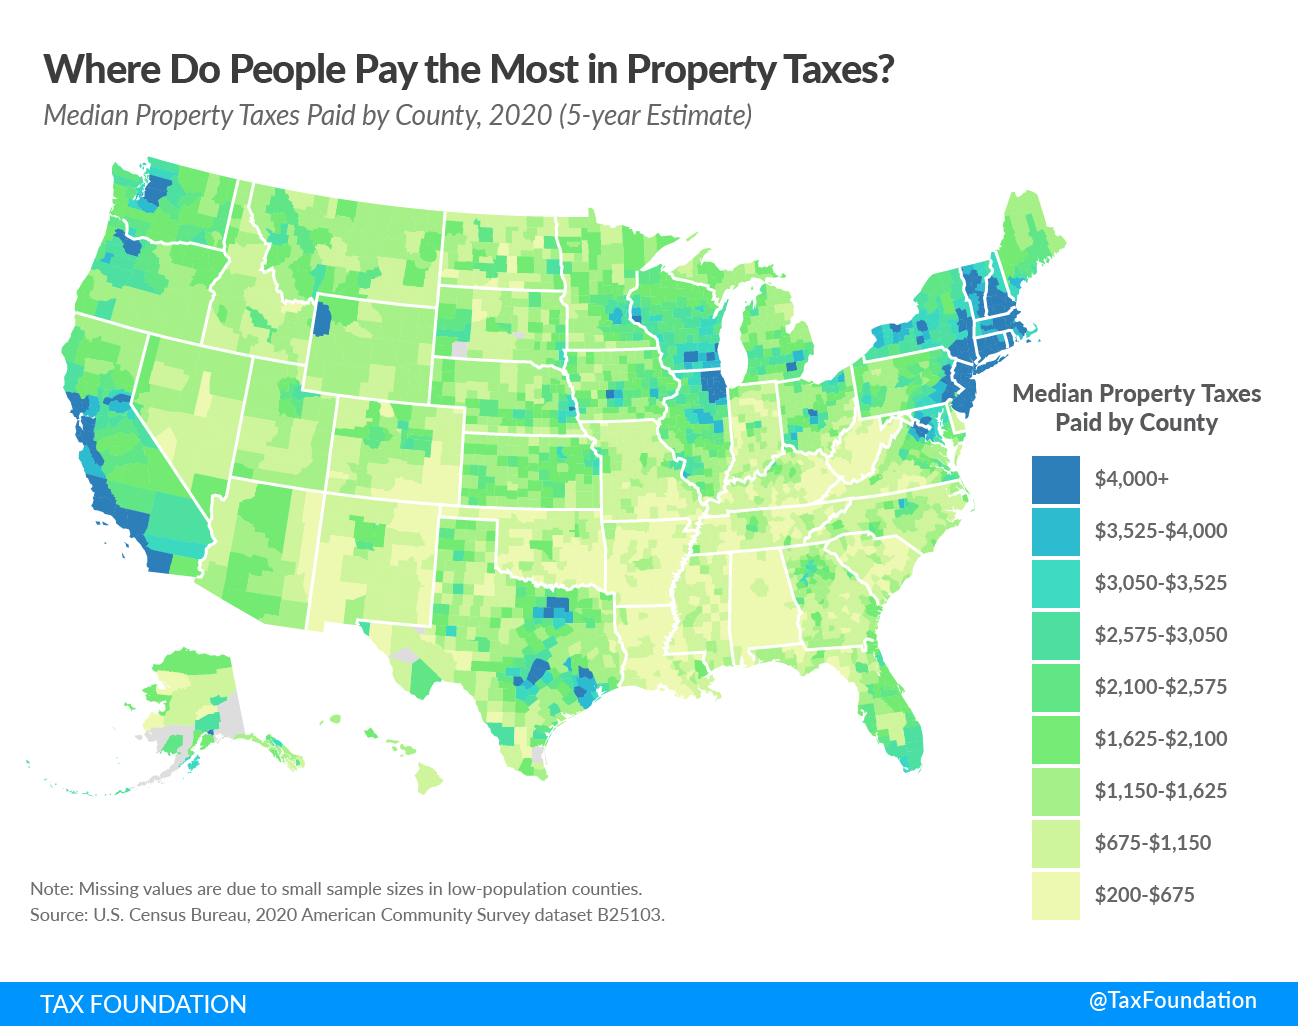
While states do rely on property taxes to a significant extent, they are primarily relied upon by localities in the U.S. to fund schools, roads, police departments, and fire and emergency medical services, as well as other services associated with residency or property ownership.
Property taxes generate just over 30 percent of total U.S. state and local tax collections and over 70 percent of local tax collections.
The map below compares per capita state and local property tax collections by state, to give you a sense of the property tax burden where you live.
Corporate income taxes are levied in 44 states. Though often thought of as a major tax type, corporate income taxes account for an average of just 4.73 percent of state tax collections and 2.27 percent of state general revenue.
It’s important to remember that while C corporations are required to pay the corporate income tax, the economic burden of the tax falls not only on the business itself but also on its consumers and employees through higher prices and lower wages.

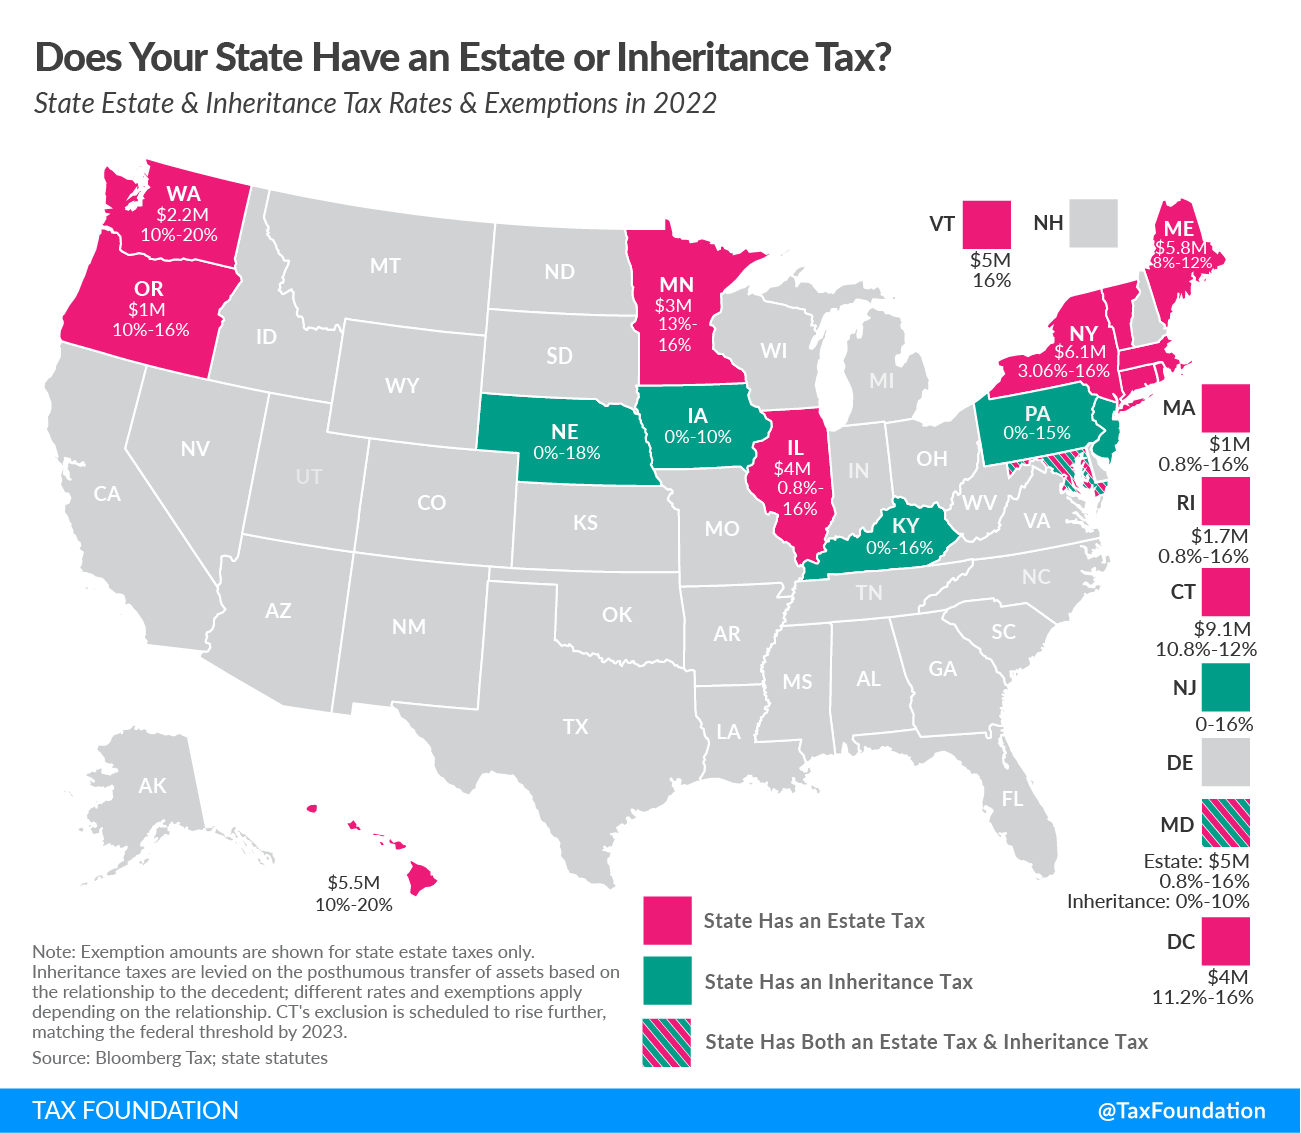
In addition to the federal estate tax of 40 percent, some states levy an additional estate or inheritance tax. Twelve states and the District of Columbia impose estate taxes and six impose inheritance taxes. Maryland is the only state to impose both.
State inheritance and estate taxes, together with the federal estate tax, reduce investment, discourage business expansion, and can sometimes drive wealthy taxpayers out of state. They also yield estate planning and tax avoidance strategies that are inefficient, not only for affected taxpayers, but for the economy at large.
Due to these issues, most states have been moving away from estate or inheritance taxes or have raised their exemption levels in recent years.
When it comes to tax competitiveness, rates matter but are only part of the story. How well a tax system is structured can have significant economic and revenue implications.
A well-structured tax code is easy for taxpayers to comply with and can promote economic growth while raising sufficient revenue. In contrast, a poorly structured tax system can be difficult to comply with, distort incentives, and harm the economy.
Our State Business Tax Climate Index has been designed as a straightforward tool for taxpayers, policymakers, and business leaders to determine how competitive their state’s tax code is both in terms of rates and overall tax structure.
The Index compares the states on more than 120 variables in the five major areas of taxation—corporate taxes, individual income taxes, sales taxes, unemployment insurance taxes, and property taxes—and then adds the results to yield a final, overall ranking. See how your state ranks at the link below.

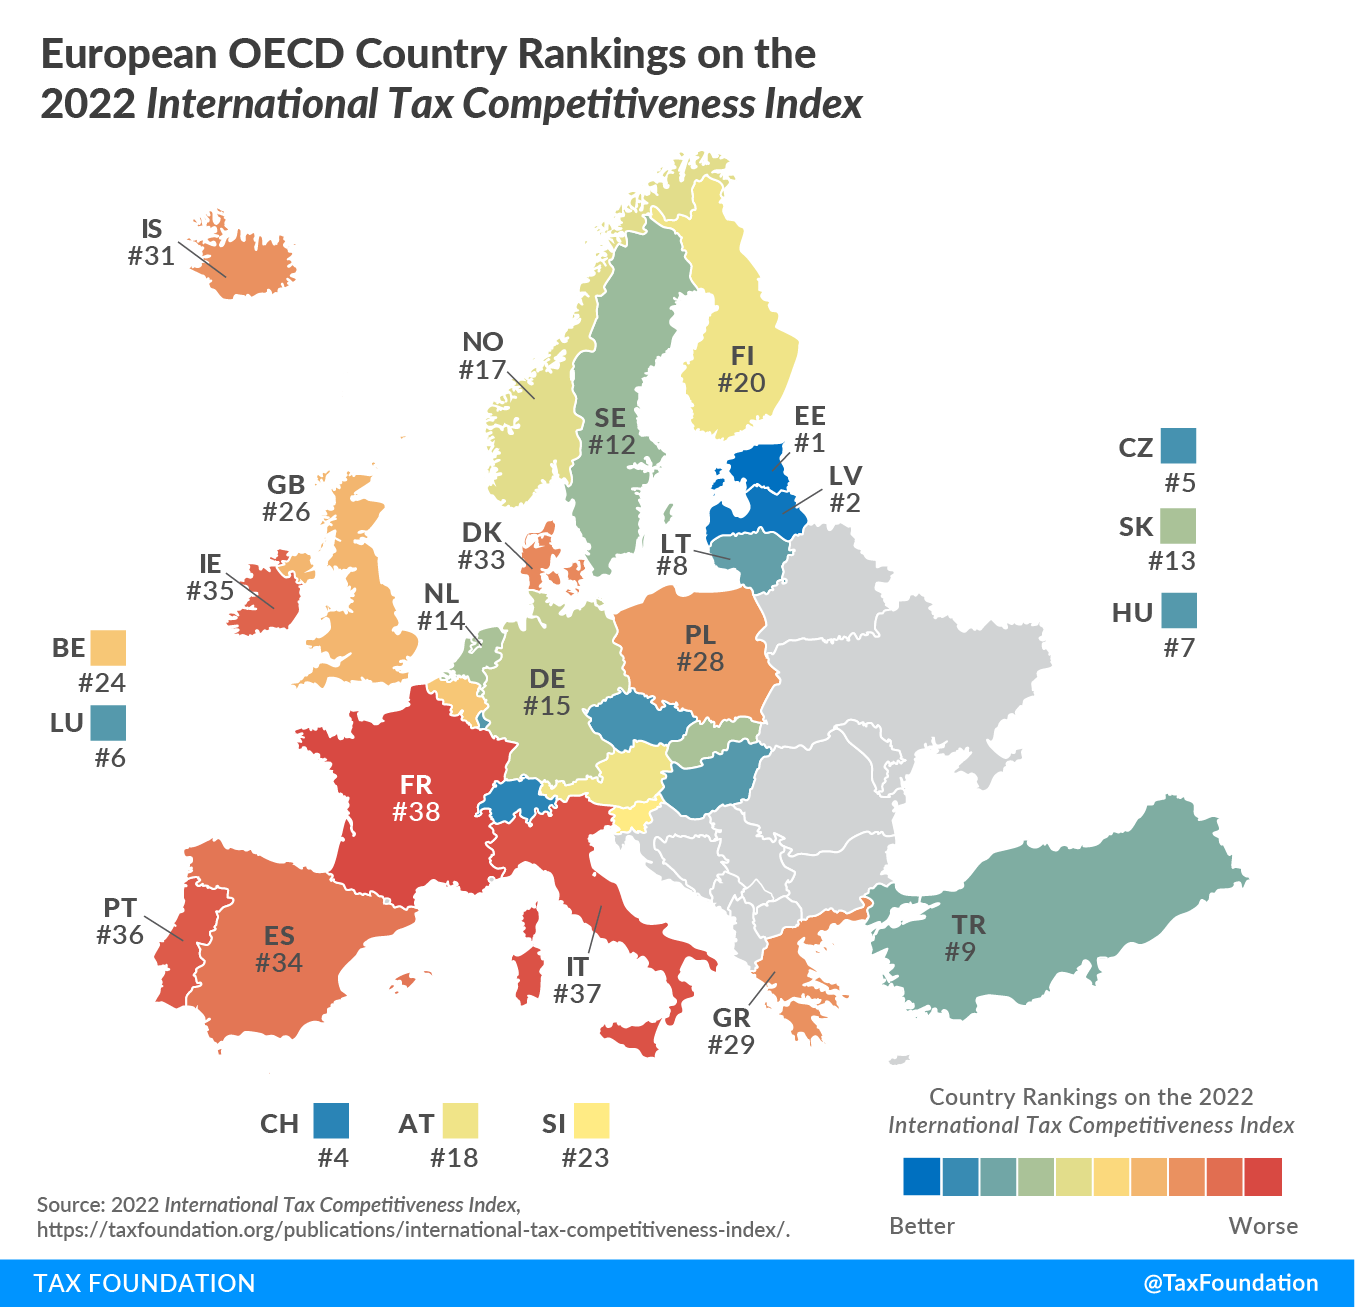
Our International Tax Competitiveness Index (ITCI) has been designed as a tool for taxpayers, policymakers, and business leaders to determine the competitiveness of their country’s tax code.
The ITCI looks at over 40 variables across five categories—corporate taxes, individual income taxes, consumption taxes, property taxes, and the treatment of profits earned overseas—and rates not only the level of taxation but also how taxes are structured. See how your country ranks at the link below.
As with any major tax reform, the Tax Cuts and Jobs Act (TCJA) of 2017 affected taxpayers in different ways depending on a number of factors, including income level, marital status, whether they had children, whether they owned a business, and more.
That said, chances are the TCJA lowered your taxes. On net, about 80 percent of taxpayers saw their taxes go down, 15 percent saw no material change in their taxes, and 5 percent saw their taxes go up.
To get a better sense of how the TCJA impacted you, we encourage you to explore our Tax Plan Calculator to model a scenario similar to your own and our interactive map to see the average tax change by income group and income range across the country. Both are linked below.
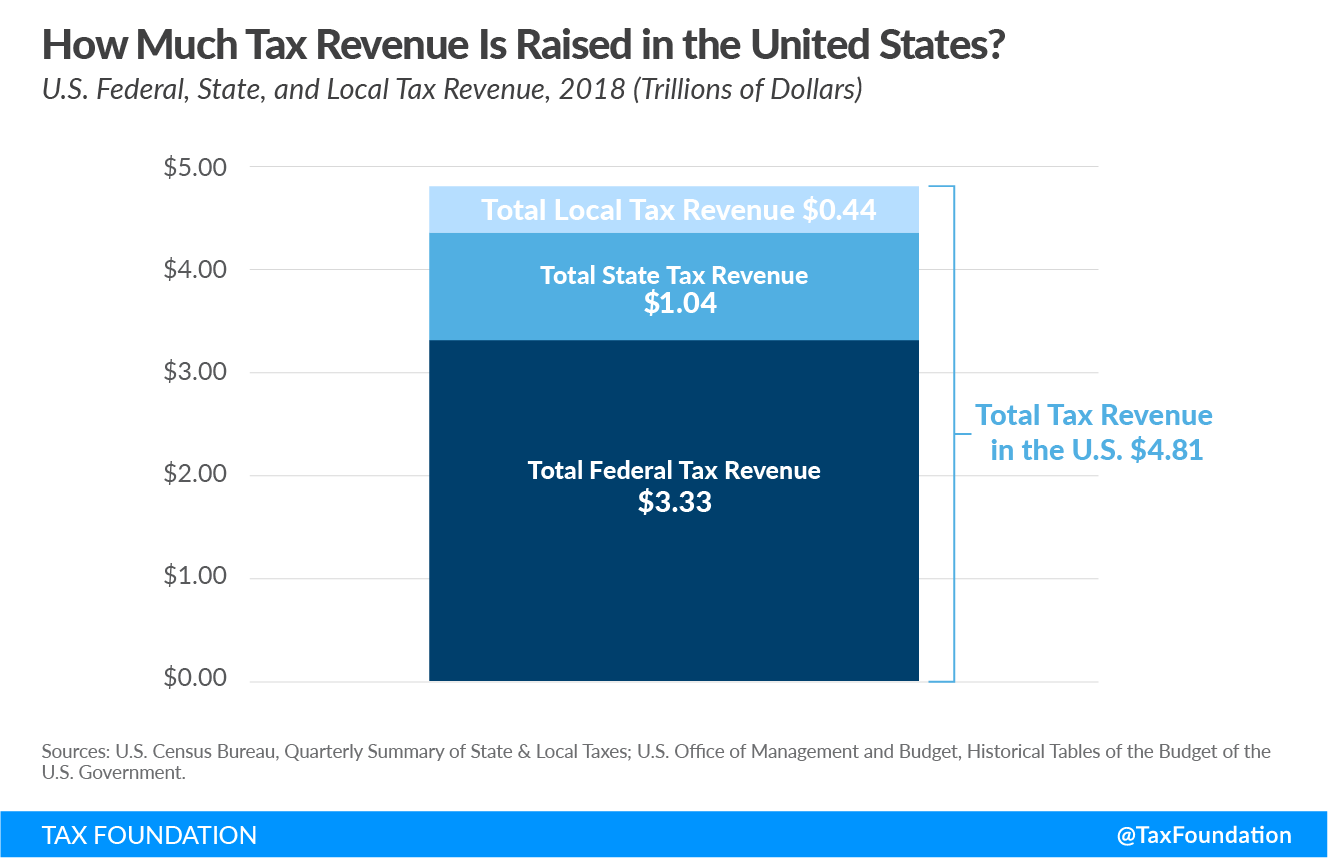
Taxes in the United States
The U.S. federal government collected $3.33 trillion in total tax revenue in 2018. Meanwhile, state governments collected a total of $1.04 trillion and local governments collected $0.44 trillion. Altogether, that means $4.81 trillion in tax revenues was collected in the U.S in 2018.
Learn More
Individual income taxes are the primary source of U.S. tax revenue when considering all local, state, and federal tax collections combined.
Social insurance taxes like payroll taxes make up the second-largest share of revenue, followed by consumption taxes, property taxes, and corporate income taxes.

Learn More
The exact mix of taxes used to raise revenue among U.S. states and localities varies greatly, though the majority of revenue comes from four primary sources: property taxes, sales taxes, individual income taxes, and corporate income taxes.
Other taxes used to raise state and local revenue include excise taxes, such as those on alcohol, tobacco, or motor fuel; estate taxes; and severance taxes, which are imposed on the extraction of nonrenewable natural resources, such as crude oil.
| State | Property | General Sales | Individual Income | Corporate Income | Other Taxes (a) |
|---|---|---|---|---|---|
| Alabama | 17.3% | 30.8% | 22.8% | 3.2% | 25.9% |
| Alaska | 51.8% | 7.7% | — | 2.9% | 37.6% |
| Arizona | 31.7% | 39.5% | 14.1% | 1.5% | 13.3% |
| Arkansas | 18.5% | 37.8% | 23.0% | 3.3% | 17.4% |
| California | 26.0% | 20.2% | 34.6% | 4.2% | 15.0% |
| Colorado | 31.6% | 27.4% | 24.8% | 1.9% | 14.3% |
| Connecticut | 39.5% | 15.5% | 29.2% | 3.3% | 12.5% |
| Delaware | 18.9% | — | 26.5% | 5.4% | 49.2% |
| Florida | 36.4% | 36.2% | — | 3.1% | 24.2% |
| Georgia | 31.0% | 23.9% | 28.2% | 2.5% | 14.4% |
| Hawaii | 18.6% | 36.6% | 22.2% | 2.0% | 20.7% |
| Idaho | 27.4% | 25.9% | 26.0% | 3.4% | 17.2% |
| Illinois | 38.8% | 19.6% | 18.0% | 3.9% | 19.7% |
| Indiana | 26.7% | 29.1% | 23.4% | 4.0% | 16.8% |
| Iowa | 32.7% | 22.6% | 24.0% | 2.8% | 18.0% |
| Kansas | 33.4% | 31.8% | 17.2% | 2.9% | 14.7% |
| Kentucky | 21.3% | 20.1% | 33.7% | 3.7% | 21.1% |
| Louisiana | 20.8% | 42.8% | 14.6% | 1.4% | 20.4% |
| Maine | 40.3% | 20.4% | 21.7% | 2.5% | 15.1% |
| Maryland | 25.8% | 12.1% | 37.9% | 2.6% | 21.5% |
| Massachusetts | 37.1% | 13.9% | 32.7% | 4.9% | 11.5% |
| Michigan | 33.8% | 22.1% | 24.0% | 2.9% | 17.3% |
| Minnesota | 25.9% | 17.8% | 31.9% | 3.6% | 20.9% |
| Mississippi | 27.7% | 32.1% | 16.7% | 3.7% | 19.9% |
| Missouri | 27.2% | 27.4% | 28.1% | 1.6% | 15.6% |
| Montana | 40.4% | — | 28.8% | 3.1% | 27.7% |
| Nebraska | 38.2% | 22.8% | 22.7% | 2.7% | 13.6% |
| Nevada | 22.5% | 41.1% | — | — | 36.4% |
| New Hampshire | 67.6% | — | 1.0% | 8.7% | 22.8% |
| New Jersey | 46.9% | 15.5% | 22.5% | 3.4% | 11.7% |
| New Mexico | 19.2% | 39.0% | 15.5% | 1.1% | 25.2% |
| New York | 32.0% | 17.1% | 31.7% | 6.0% | 13.2% |
| North Carolina | 24.6% | 25.9% | 29.7% | 1.9% | 17.9% |
| North Dakota | 24.8% | 22.1% | 6.3% | 1.2% | 45.5% |
| Ohio | 28.1% | 28.6% | 25.8% | 0.4% | 17.2% |
| Oklahoma | 20.6% | 33.5% | 22.4% | 1.1% | 22.4% |
| Oregon | 31.4% | — | 42.7% | 3.7% | 22.2% |
| Pennsylvania | 29.6% | 17.3% | 25.9% | 4.3% | 22.9% |
| Rhode Island | 43.3% | 17.0% | 21.1% | 2.2% | 16.5% |
| South Carolina | 34.1% | 21.6% | 23.4% | 2.1% | 18.8% |
| South Dakota | 38.0% | 38.7% | — | 0.8% | 22.5% |
| Tennessee | 25.7% | 40.9% | 1.1% | 7.6% | 24.7% |
| Texas | 45.0% | 34.3% | — | — | 20.7% |
| Utah | 25.5% | 26.4% | 28.7% | 2.6% | 16.8% |
| Vermont | 44.2% | 10.4% | 19.7% | 2.2% | 23.6% |
| Virginia | 34.4% | 13.4% | 32.1% | 2.0% | 18.0% |
| Washington | 28.0% | 46.4% | — | — | 25.6% |
| West Virginia | 24.0% | 19.2% | 25.2% | 1.6% | 30.0% |
| Wisconsin | 33.8% | 19.8% | 27.5% | 3.4% | 15.5% |
| Wyoming | 44.5% | 23.8% | — | — | 31.8% |
| District of Columbia | 32.6% | 18.4% | 26.3% | 7.4% | 15.3% |
| (a) “Other Taxes” include excise taxes (such as those on alcohol, tobacco, motor vehicles, utilities, and licenses), severance taxes, stock transfer taxes, estate and gift taxes, and other miscellaneous taxes. | |||||
| Note: Percentages may not add to 100 due to rounding. | |||||
| Sources: U.S. Census Bureau, “Annual Survey of State and Local Government Finances”; Tax Foundation calculations. | |||||
In many ways, the United States is unique in how it raises revenue. One important difference is that it relies significantly more on individual income taxes compared to other countries in the Organisation for Economic Co-operation and Development (OECD), a group of 36 countries with advanced economies.
The United States also relies much less on consumption taxes. This is because all OECD countries except the United States levy a value-added tax (VAT) at a relatively high rate. State and local sales tax rates in the United States are low by comparison.
