Key Findings
- Average wage earners in the OECD have their take-home pay lowered by three major taxes: individual income, payroll (both employee and employer side), and value-added (VAT) and sales taxes.
- Before accounting for VAT and sales taxA sales tax is levied on retail sales of goods and services and, ideally, should apply to all final consumption with few exemptions. Many governments exempt goods like groceries; base broadening, such as including groceries, could keep rates lower. A sales tax should exempt business-to-business transactions which, when taxed, cause tax pyramiding. , the average taxA tax is a mandatory payment or charge collected by local, state, and national governments from individuals or businesses to cover the costs of general government services, goods, and activities. burden a single average wage earner faced in the OECD was 36 percent of pretax earnings in 2019. The average OECD tax burden on labor has dropped 1.4 percentage points over the past two decades.
- The average tax burden varies substantially from one OECD country to another. In 2019, a worker in Belgium supported a tax burden seven times higher than that of a Chilean worker.
- In 2019, the average tax burden from income and payroll taxes that families in OECD countries faced was 26.4 percent, 9.6 percentage points lower than that of single taxpayers without children. In general, countries with higher tax wedges provide greater tax relief for families with children.
- Accounting for VAT and sales tax reveals that in 2019, the average tax burden on labor was 41.5 percent, which is 5.6 percentage points higher than when only income and payroll taxes are considered.
- When looking at the tax wedges for different employment forms, the United Kingdom, Netherlands, and Italy show a high degree of dispersion. The differences between the maximum and minimum tax wedgeBroadly speaking, a tax wedge is the difference between the pre-tax price or return and after-tax price or return. For labor income, it is the difference between the total labor costs to the employer and the corresponding net take-home pay of the employee. range from 10 percentage points in the United Kingdom up to 33 percentage points in Italy.
Introduction
Individual income taxes, payroll taxes, and consumption taxes like value-added taxes (VAT) make up a large portion of many countries’ tax revenue.[1] These taxes combined make up the tax burden on labor.
The Organisation for Economic Co-operation and Development (OECD) reports data on the composition of the tax burden on labor across 36 developed countries.[2] The most recent data available shows that, on average, single workers with no children, earning a nation’s average wage in the OECD, faced a tax burden from income and payroll taxes of 36 percent in 2019. After accounting for VAT and sales taxes, which reduce the purchasing power of earnings, the OECD average tax wedge was 41.5 percent in 2019.
In many countries, taxes are progressive, which means that higher-income workers are taxed at higher rates. However, this does not mean that the average worker is not also burdened by these taxes. It is also important to note that the tax burden on families is often lower than the burden on single, childless workers earning the same pretax income.
As noted in our primer on the tax wedge on labor, there is a negative relationship between the tax wedge and employment.[3] Because of this, countries should explore ways to make their taxation of labor less burdensome to improve the efficiency of their labor markets.
The Tax Burden on Labor
The tax burden on labor is referred to as a “tax wedge,” which simply refers to the difference between an employer’s cost of an employee and the employee’s net disposable income. For the purpose of the OECD study, the wedge is determined by several factors: the amount of pretax income (referred to as labor cost) of a worker, the taxes that apply to that income, and whether the taxpayer is filing as single or as a family.
The OECD calculates the tax burden by adding together the income tax payment, employee-side payroll taxA payroll tax is a tax paid on the wages and salaries of employees to finance social insurance programs like Social Security, Medicare, and unemployment insurance. Payroll taxes are social insurance taxes that comprise 24.8 percent of combined federal, state, and local government revenue, the second largest source of that combined tax revenue. payment, and employer-side payroll tax payment of a worker earning the average wage in a country. The OECD then divides this figure by the total labor cost of this average worker, or what the worker could have earned in the absence of these three taxes.
Personal Income Taxes
Personal income taxes are levied directly on an individual’s income, including wage income. These taxes are typically levied in a progressive manner, meaning that an individual’s average tax rate increases as income increases. The amount of income tax paid typically also depends on whether the taxpayer is filing as single or as family, as most countries allow for some targeted tax relief for families with children.
Payroll Taxes
Payroll taxes are typically flat-rate taxes levied on wages and are in addition to the taxes on income. In most OECD countries, both the employer and the employee pay payroll taxes. These taxes usually fund specific social programs, such as unemployment insurance, health insurance, and old age insurance.
The Economic Incidence of Payroll Taxes
Although payroll taxes are typically split between workers and their employers, economists generally agree that both sides of the payroll tax ultimately fall on workers.
In tax policy, there is an important distinction between the “legal” and the “economic” incidence of a tax. The legal incidence of a tax falls on the party that is legally required to write the check to the tax collector. However, the party that legally pays a tax is not always the one that ultimately bears the burden of the tax. The “economic” incidence of a tax can fall on any number of people and is determined by the relative elasticities of supply and demand of a taxed good, or how people and businesses respond to a tax.[4]
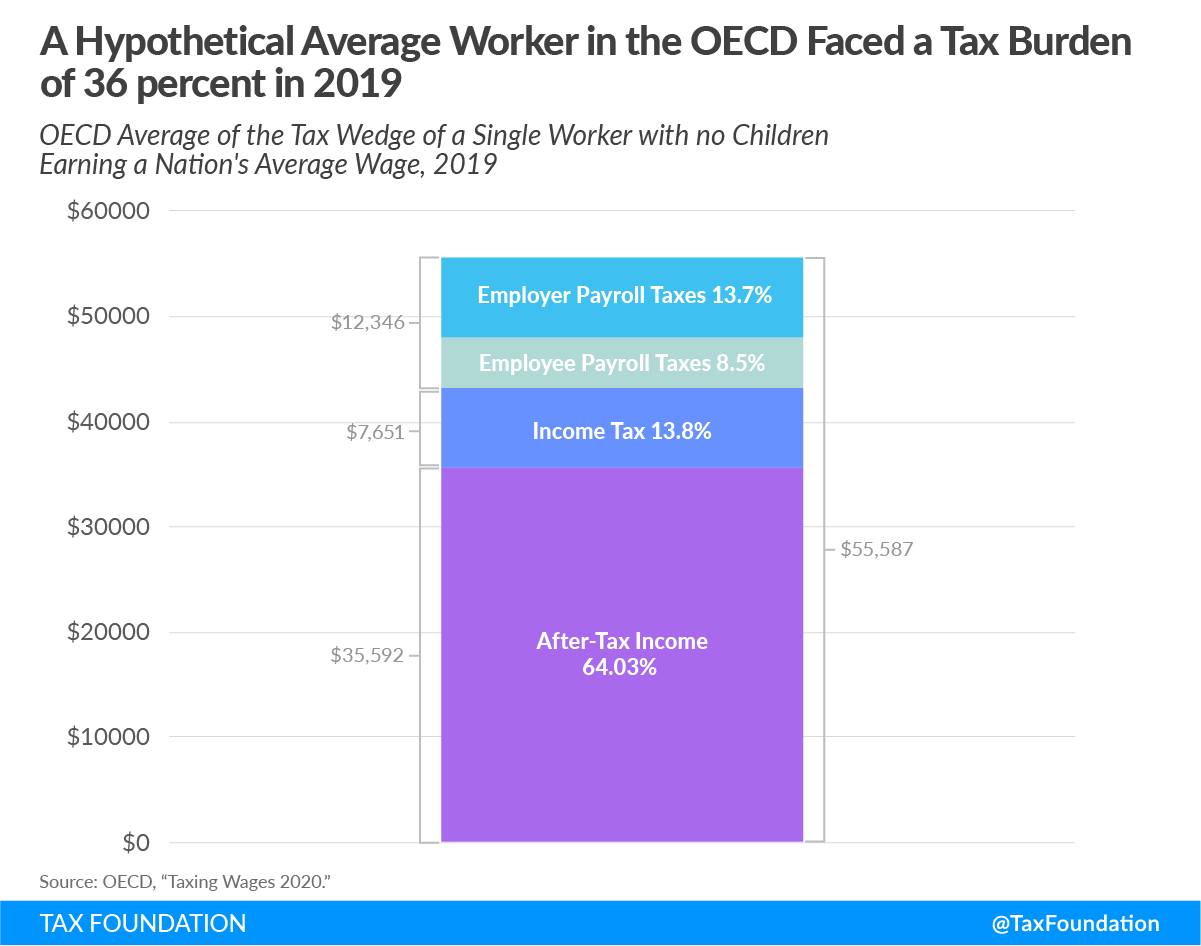
Average OECD Tax Burden
In 2019, the average OECD tax wedge for a single worker with no children earning a nation’s average wage was 36 percent. The average annual total labor cost per worker was $55,587. Income taxes accounted for 13.8 percent ($7,651) of the labor cost. Employee-side payroll taxes made up 8.5 percent ($4,718) and employer-side payroll taxes 13.7 percent ($7,628). The average annual disposable after-tax income of a worker in the OECD amounted to $35,592, or 64 percent of total labor cost.[5]
Stay informed on the tax policies impacting you.
Subscribe to get insights from our trusted experts delivered straight to your inbox.
SubscribeTax Burden by OECD Country
The OECD average described above reflects overall tendencies of the tax burden on labor among the 36 OECD countries. However, as shown below, many countries deviate from this average quite substantially, reflecting economic and policy differences across countries.
Single Worker with No Children
In 2019, the tax wedge faced by single workers without children ranged from only 7 percent in Chile to 52.2 percent in Belgium, a difference of 45.2 percentage points. Fourteen of the countries had a tax wedge above 40 percent, another 14 countries between 40 and 30 percent, and eight countries below 30 percent.
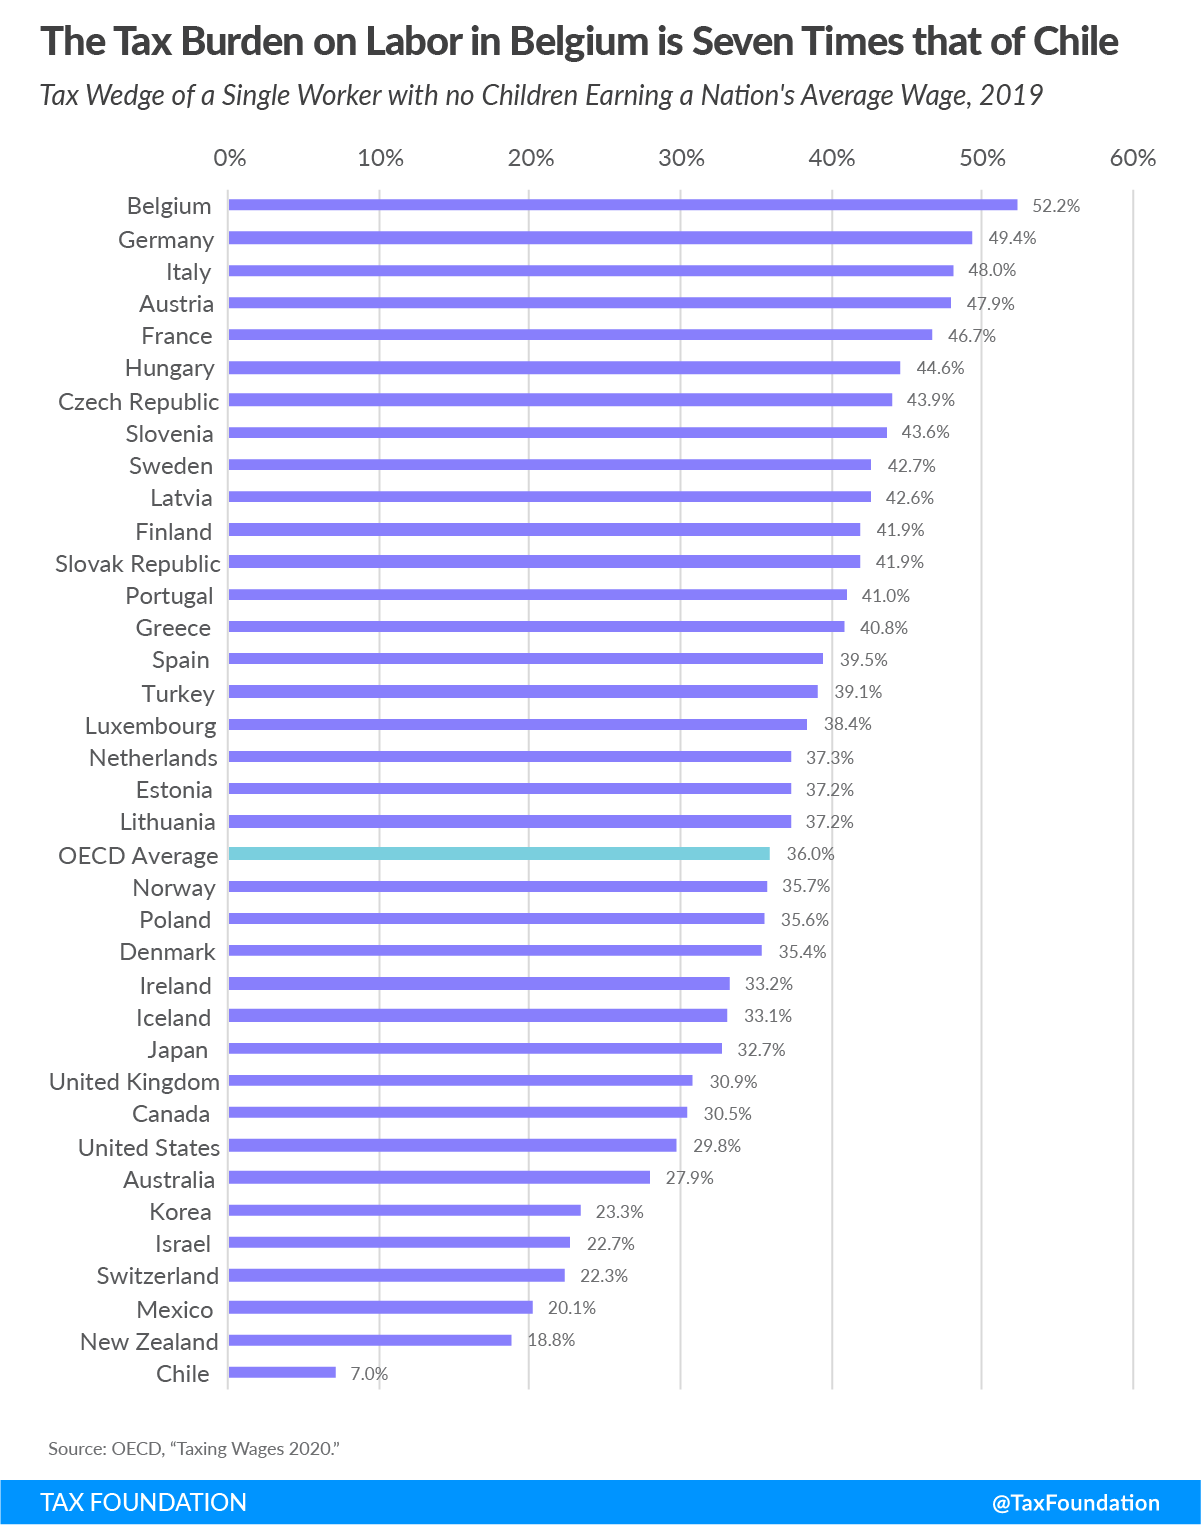
Tax wedges are particularly high in European countries—the 25 countries with the highest tax burden in the OECD are all European. In contrast, nine out of the 11 OECD countries with the lowest tax burden are non-European (the United Kingdom and Switzerland are the two European countries in this category).
In 30 out of 36 OECD countries, total payroll taxes accounted for a larger share of the tax burden on labor than income taxes did.[6] Australia, Denmark, Iceland, Ireland, New Zealand, and the United States were the only countries in which the share from income taxes exceeded payroll taxes.
Comparing a Single Worker with No Children to a Married Worker with Two Children
Most countries in the OECD provide some targeted tax relief for families with children, typically through lower income taxes. The average wedge for families, defined as a one-earner married couple with two children, was 26.4 percent in 2019, compared to an average tax wedge of 36 percent for single workers without children.
The following figure compares the tax burden faced by a one-earner married couple with two children with that of a single worker without children.
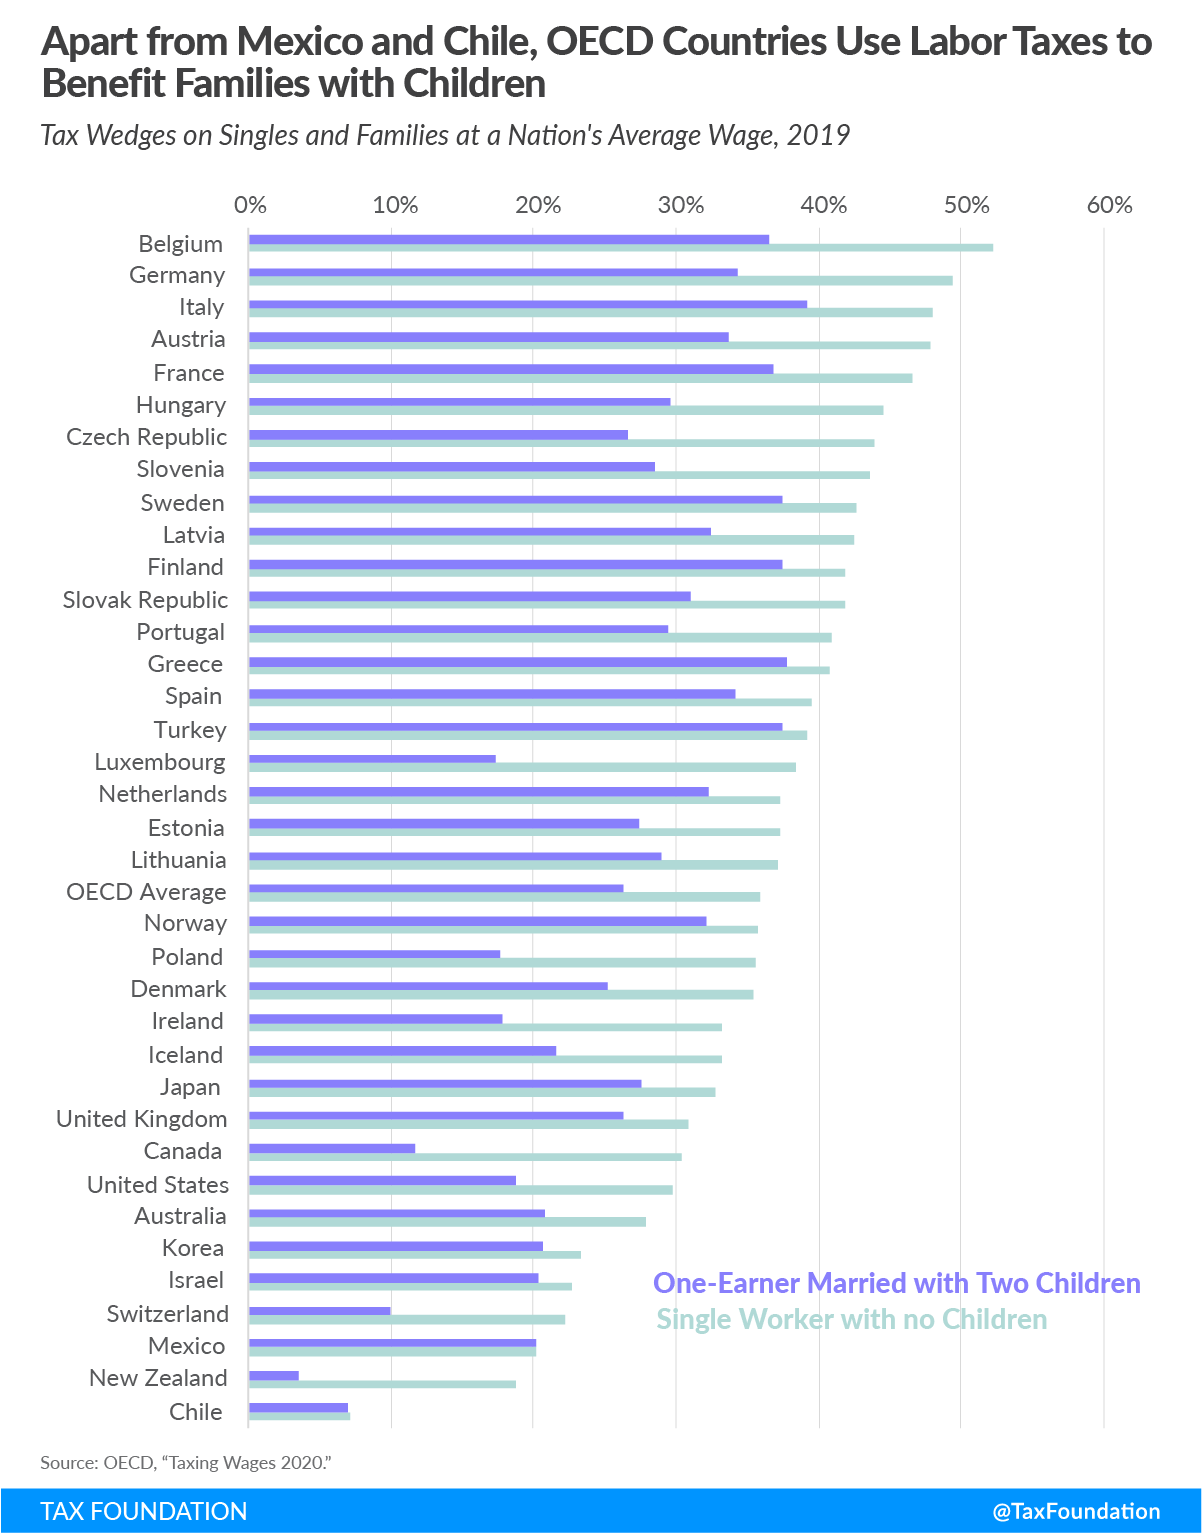
In general, countries with a higher tax wedge provide greater tax relief for families with children. Belgium, Germany, Austria, and Hungary, which had the first, second, fourth, and sixth-highest tax wedge for single workers without children, once the family relief is applied, drop more than six positions, ranking seventh, eighth, tenth and fifteenth respectively.
In 2019, the highest family tax wedge was in Italy, at 39.2 percent, followed by Greece, at 37.8 percent, while the lowest family tax wedge was in New Zealand, at 3.5 percent.
Luxembourg has the largest disparity between the two tax wedges, at 21.1 percentage points between its 38.4 percent wedge for single workers and 17.3 percent wedge for families. Chile and Mexico are the only countries that do not provide any tax relief for families with children but they keep the average tax wedge low.
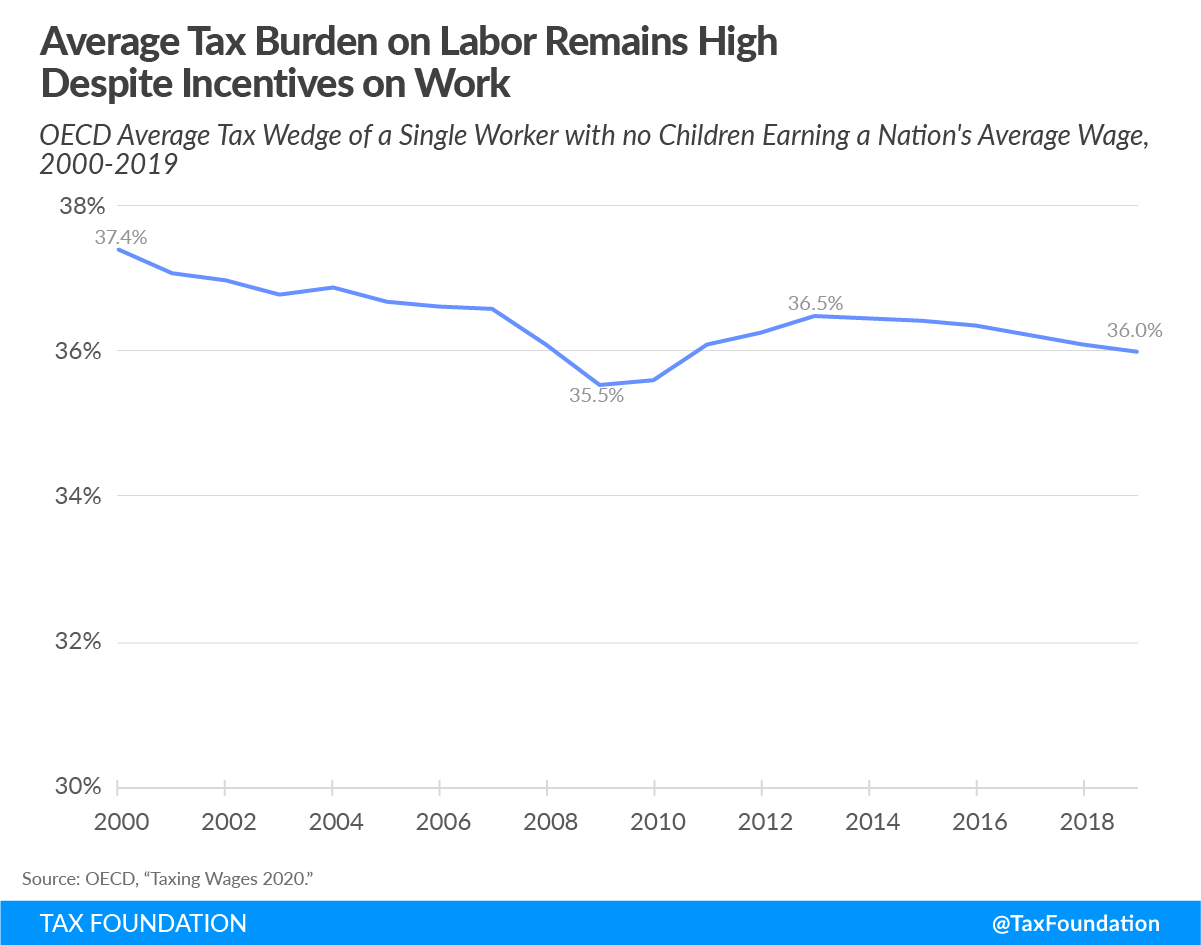
OECD Tax Burden from 2000 to 2019
Although the tax wedge has changed quite substantially in some countries over time, the average OECD tax burden on labor has dropped just 1.4 percentage points over the past two decades. In 2000, the average OECD tax wedge was 37.4 percent, compared to 36 percent in 2019. Nevertheless, in 2019, the average OECD tax burden was still 0.5 points higher than the 2009 post-financial crisis tax wedge, when it reached its lowest level at 35.5 percent.
Most Notable Changes in the Tax Burden since 2000
Some individual countries have made substantial changes to their income and payroll taxes in the last two decades. The following graph shows the OECD countries with the largest increases and decreases in their respective tax wedges.
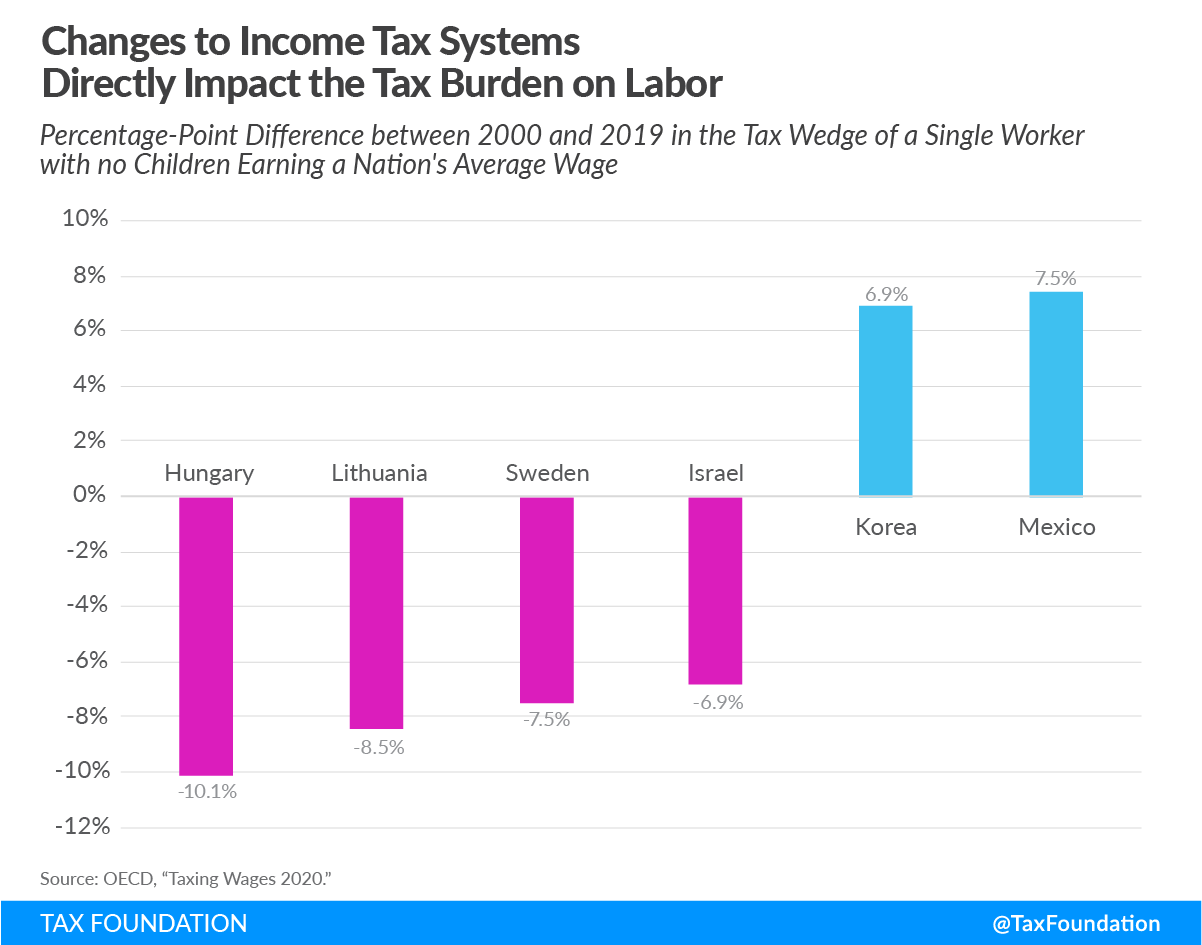
Hungary, the OECD country with the highest tax burden on labor in the year 2000, has had the most notable decrease in its tax wedge, from 54.7 percent to 44.6 percent in 2019. This is partially due to the introduction of a flat taxAn income tax is referred to as a “flat tax” when all taxable income is subject to the same tax rate, regardless of income level or assets. on income, which lowered the income tax burden relative to total labor costs. Additionally, Hungary reduced its payroll taxes relative to total labor costs. Israel, Sweden, and recently Lithuania have also lowered their tax burden on labor substantially, with a reduction between 7 and 8.5 percentage points each.
Mexico has seen the highest increase in its tax wedge since 2000, with an additional tax burden of 7.5 percentage points. While payroll taxes relative to total labor costs have roughly stayed the same in Mexico, income taxes as a percent of total labor costs have increased from 0.9 percent in 2000 to 8.5 percent in 2019. The tax wedge has also increased in South Korea, by 6.9 percentage points.
Marginal and Average Tax Wedges
Comparing the tax wedge on the average worker across countries is only a partial representation of how taxes on labor impact the economy, both by changing incentives to work and by raising revenue for the government at various levels.
The OECD’s “Taxing Wages 2020” report presents both average and marginal tax wedges. The average tax wedge is what has been presented so far and is the combined share of labor and payroll taxes relative to gross labor income, or the tax burden. The marginal tax wedge, on the other hand, is the share of labor and payroll taxes applicable to the next dollar earned and can impact individuals’ decisions to work. The marginal tax wedge is generally higher than the average tax wedge due to the progressivity of taxes on labor across countries—as workers earn more, they face a higher tax wedge on their marginal dollar of earnings.
Directly comparing marginal tax wedges across countries is less informative. Many countries’ marginal tax wedges are higher than others simply because their overall tax burden is high. For example, Belgium has a high marginal tax wedge of 65.1 percent while Poland has a marginal tax wedge of just 36.8 percent.[7]
One way to examine the efficiency of labor taxation in a country is to control for the level of labor taxation by taking the ratio of the marginal tax wedge to the average tax wedge. The ratio of the marginal tax wedge to the average tax wedge for a country is a rough proxy for the economic cost of a government funding $1 more of revenue through taxes on labor at any given level of labor taxation.
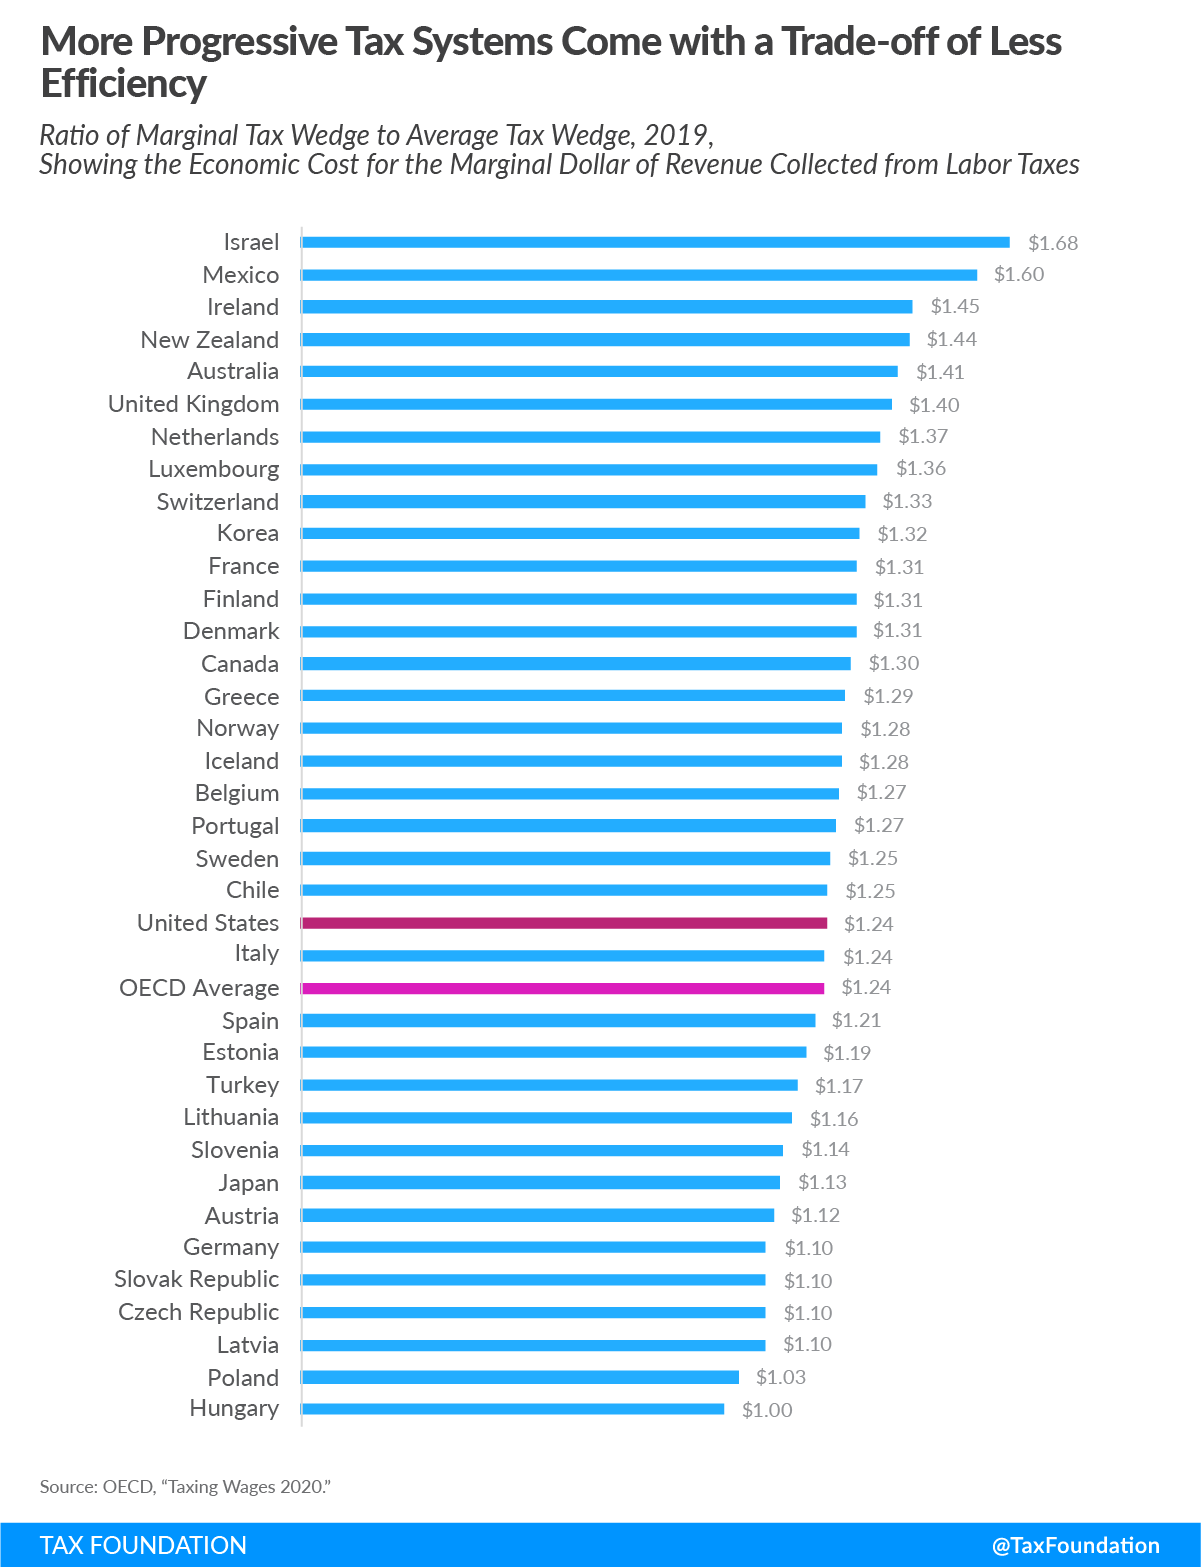
Comparing this metric across countries shows that Hungary has the lowest ratio of $1 in cost for each additional dollar raised from labor taxes. This is because Hungary has a flat income tax, so the marginal and average tax wedges are the same. In contrast, in Israel, the cost of raising an additional dollar in revenue from taxes on its workforce is $1.68. The average across OECD countries is $1.24.
This metric tends to show that countries with high labor tax burdens, such as Germany and Austria, raise revenue from labor taxes rather efficiently. These countries have labor tax wedges of 49.4 percent and 47.9 percent, respectively, but their ratios are both below the OECD average of $1.24.
Tax Burden Including VAT
The tax burden on labor is broader than personal income taxes and payroll taxes. In many countries, individuals also pay a value-added tax (VAT) on their consumption. Because a VAT diminishes the purchasing power of individual earnings, a more complete picture of the tax burden should include the VAT. Although the United States does not have a VAT, state sales taxes also work to diminish the purchasing power of earnings.
Accounting for VAT rates and bases in OECD countries increased the tax burden on labor by 5.6 percentage points on average in 2019. The effective VAT rate is much lower than the statutory rate for each country because of exclusions in the tax base. The distribution of VAT-inclusive tax wedges across countries is similar to that shown in Figure 2.
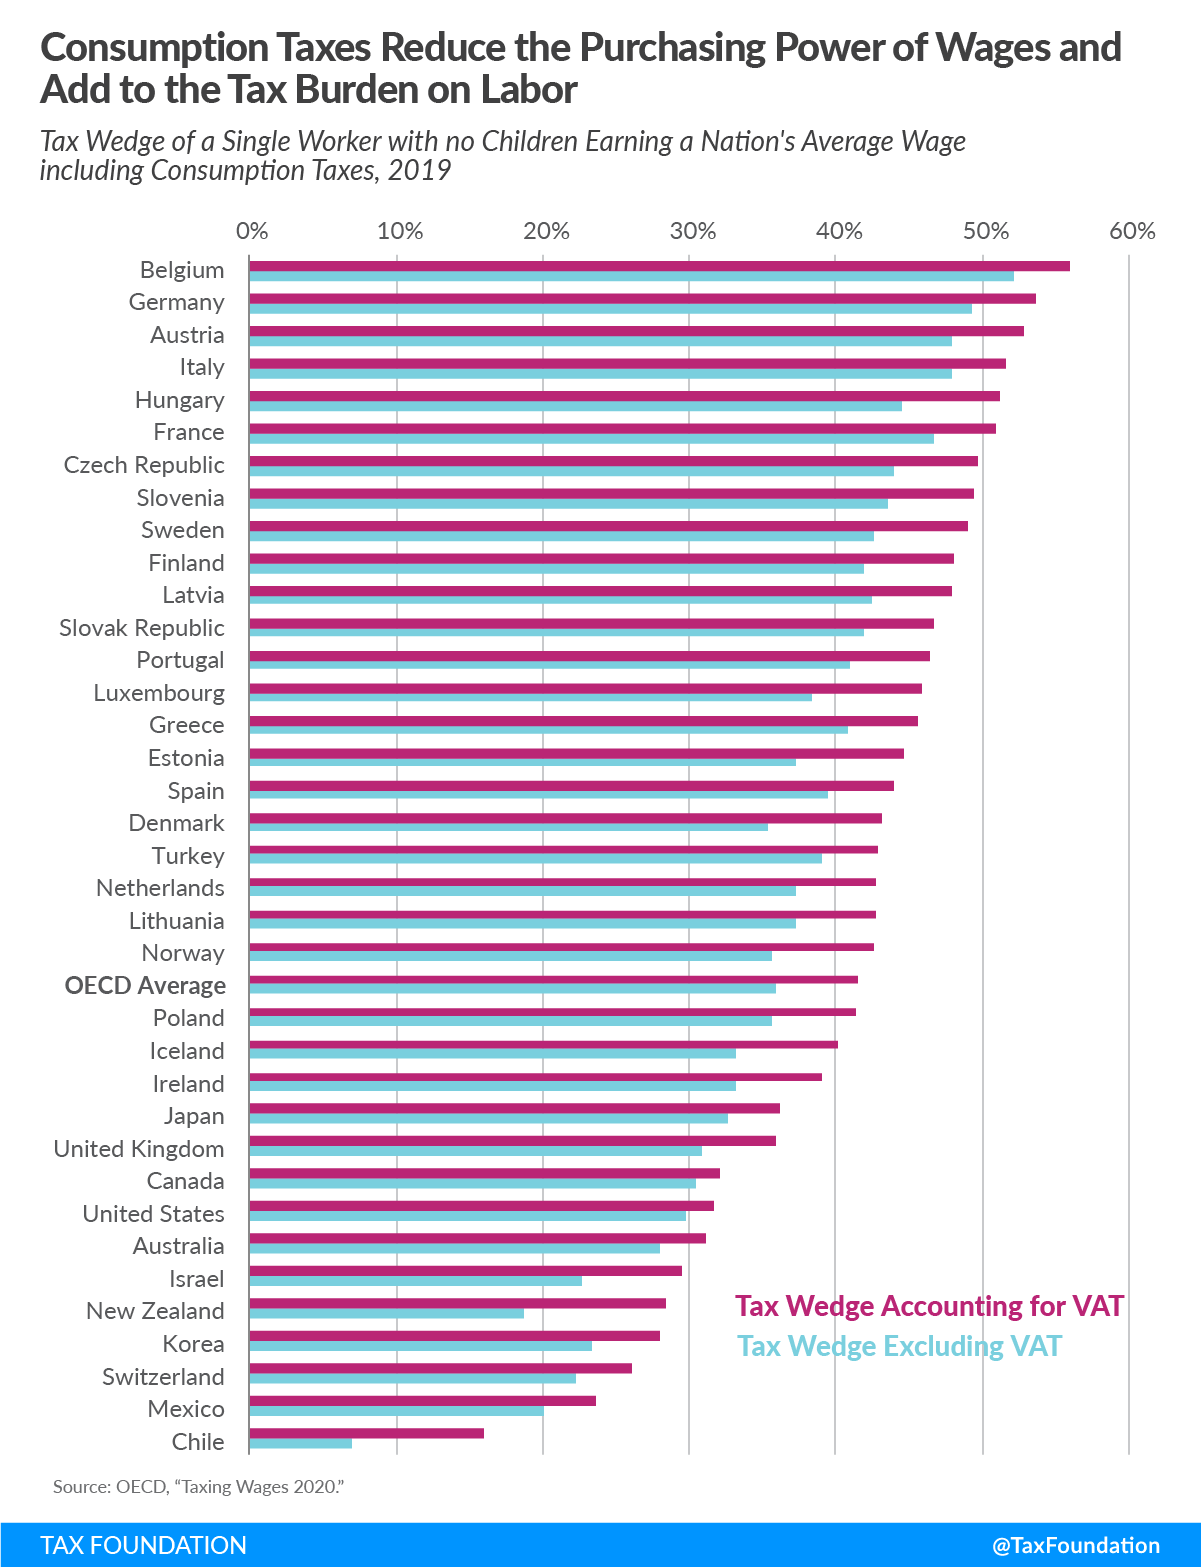
In 2019, the country with the largest difference between the two measures was New Zealand, with a tax wedge accounting for the VAT that is 28.5 percent, 9.7 percentage points larger than the tax wedge that only accounts for income and payroll taxes.
Canada had the smallest difference between the two measures, at 1.6 percentage points. This is partially because its goods and services tax rates are generally much lower than VAT rates in other OECD countries.
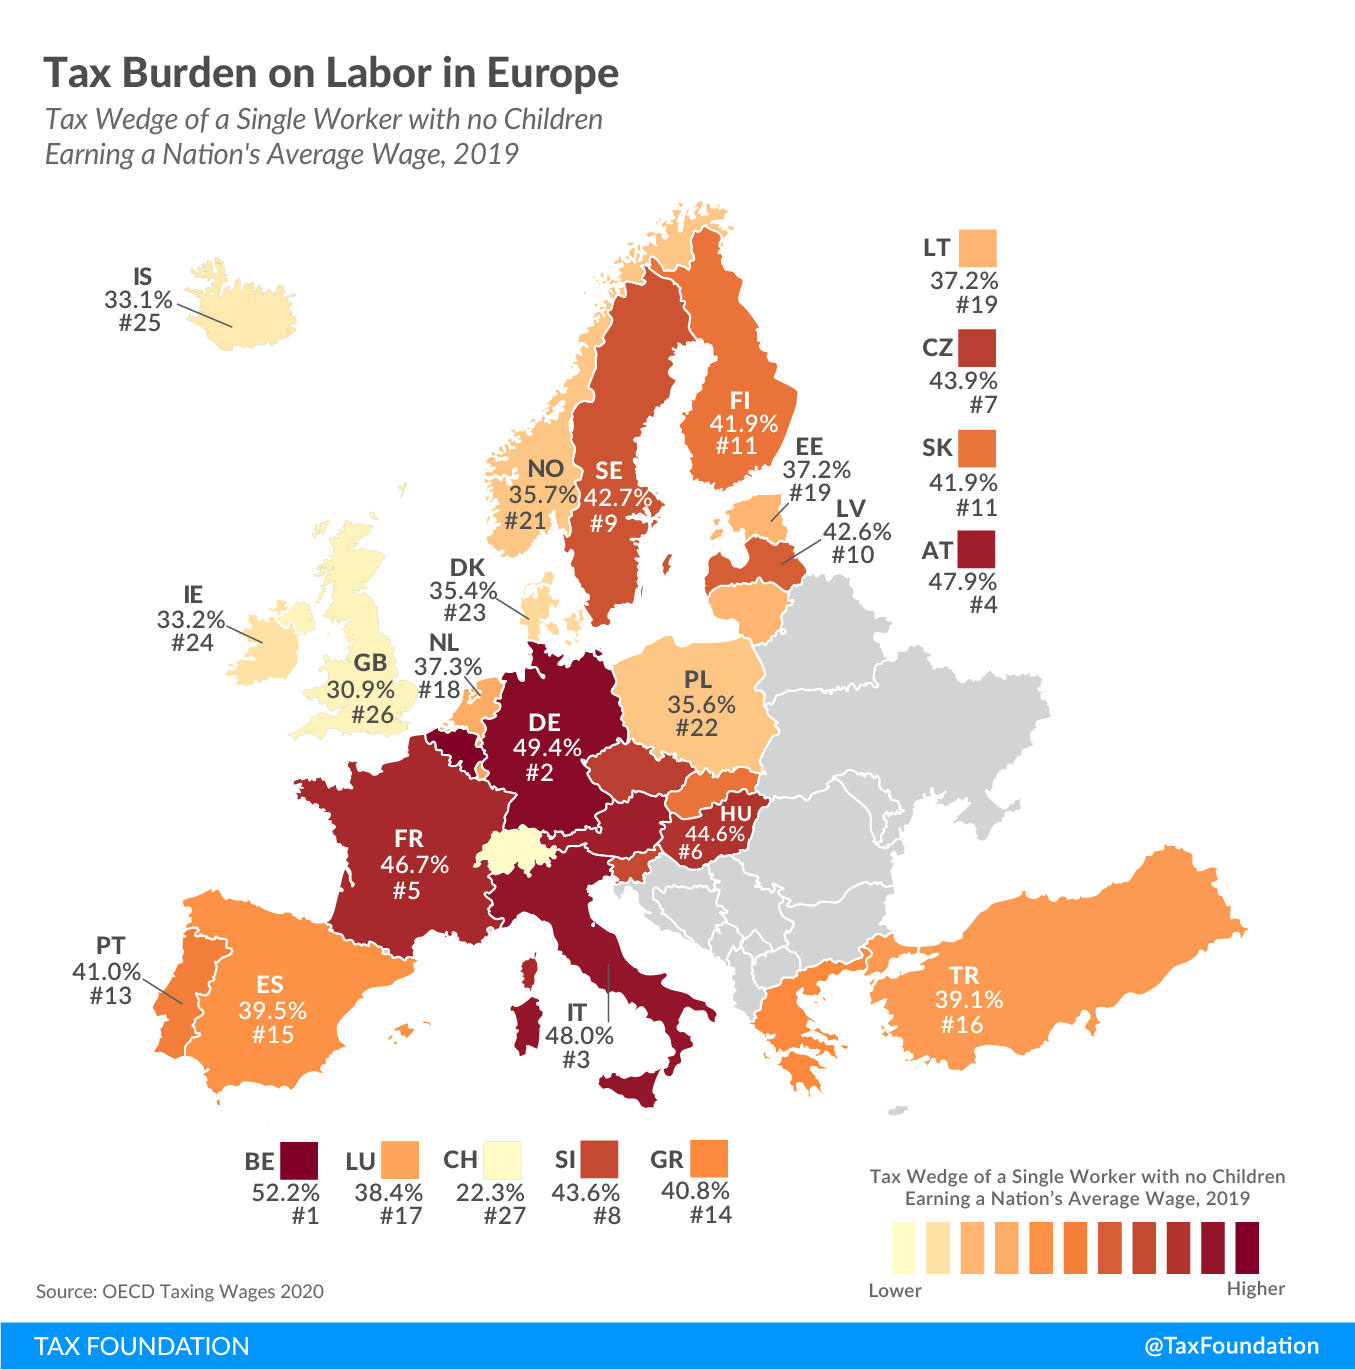
Tax Burden in Europe
Although the tax wedge in Europe is generally high, there is a relatively wide range. The following map illustrates how European countries differ in their tax burden on labor.
Stay informed on the tax policies impacting you.
Subscribe to get insights from our trusted experts delivered straight to your inbox.
SubscribeIn 2019, the average tax wedge of the 27 countries covered in this Europe map was 40.1 percent for a single worker without children, compared to the OECD average of 36 percent. Belgium had the highest tax burden on labor, at 52.2 percent (also the highest of all OECD countries), while Switzerland had the lowest tax burden, at 22.3 percent.
Tax Burden for Different Employment Form
Differences in the tax burden that standard workers face versus non-standard workers such as an independent contractor may generate arbitrage opportunities both for workers and businesses. On one hand, companies might be inclined to offer a certain labor contract that conveys smaller labor costs. On the other, workers will have to choose their organizational form and opt between becoming an employee, for example, or self-employed.
The following figure shows the tax wedge of each employment form for three OECD countries. The tax wedges for standard employees are determined by the average wage in each country, and the tax wedges for other employment forms have been determined by equalizing take-home pay.
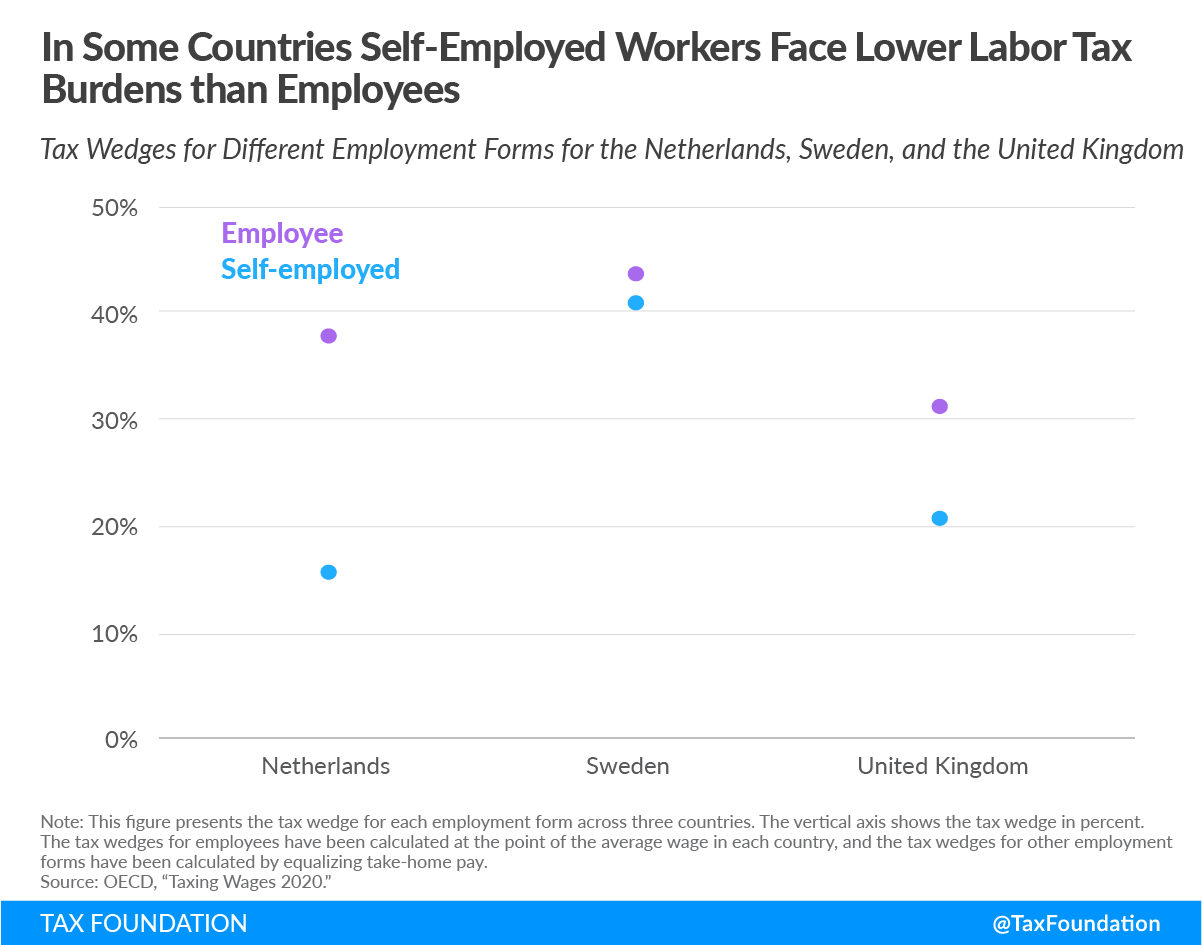
The biggest dispersion is observed in the Netherlands, where the difference between the maximum and minimum tax wedge is 22.3 percentage points. In the United Kingdom, the difference reaches almost 10 percentage points, while in Italy there is a 33.3 percentage-point difference between an employee with a permanent contract and a merchant under the forfeit regime (see Table 3). A moderate degree of dispersion is observed in Australia with a dispersion of more than 4 percentage points (see Table 3).
When big differences are observed between the minimum and maximum tax wedge, businesses have an incentive to shift between employment forms for tax reasons. Tax systems should be neutral across employment forms, so that both workers and businesses decide the type of contract given the characteristics of the job without distortions from the tax system.
Conclusion
In 2019, single, average-wage workers paid about one-third of their wages in taxes. In most OECD countries, families had smaller tax burdens than single workers earning the same income, but how much less families paid varied. Accounting for consumption taxes reveals higher tax wedges than when just accounting for income and payroll taxes. Differences in the tax burden observed between different employment forms may generate arbitrage opportunities both for workers and businesses, especially in the United Kingdom and the Netherlands. Governments with higher taxes generally explain their high tax burdens with more extensive public services. However, the cost of these services can be more than half of an average worker’s salary, and for most, at least a third of their salary.
Stay informed on the tax policies impacting you.
Subscribe to get insights from our trusted experts delivered straight to your inbox.
SubscribeAppendix
| Rank | Tax Wedge in % (As a Share of Labor Cost) | Income Tax in % | Employee Payroll Taxes in % | Employer Payroll Taxes in % | Total Average Annual Labor Cost per Employee in $ | |
|---|---|---|---|---|---|---|
| Belgium | 1 | 52.2% | 19.9% | 11.0% | 21.3% | $82,002 |
| Germany | 2 | 49.4% | 16.1% | 16.8% | 16.5% | $84,303 |
| Italy | 3 | 48.0% | 16.8% | 7.2% | 24.0% | $61,635 |
| Austria | 4 | 47.9% | 11.9% | 14.0% | 22.0% | $81,034 |
| France | 5 | 46.7% | 11.7% | 8.3% | 26.6% | $66,048 |
| Hungary | 6 | 44.6% | 12.5% | 15.4% | 16.7% | $37,687 |
| Czech Republic | 7 | 43.9% | 10.5% | 8.2% | 25.3% | $43,528 |
| Slovenia | 8 | 43.6% | 10.7% | 19.0% | 13.9% | $41,598 |
| Sweden | 9 | 42.7% | 13.4% | 5.3% | 23.9% | $68,056 |
| Finland | 10 | 41.9% | 16.8% | 8.1% | 17.0% | $63,396 |
| Latvia | 10 | 42.6% | 14.3% | 8.9% | 19.4% | $32,518 |
| Slovak Republic | 12 | 41.9% | 8.3% | 10.3% | 23.3% | $33,818 |
| Portugal | 13 | 41.0% | 12.9% | 8.9% | 19.2% | $40,469 |
| Greece | 14 | 40.8% | 8.2% | 12.7% | 19.9% | $47,575 |
| Spain | 15 | 39.5% | 11.6% | 4.9% | 23.0% | $56,495 |
| Turkey | 16 | 39.1% | 11.5% | 12.8% | 14.9% | $37,600 |
| Luxembourg | 17 | 38.4% | 15.5% | 10.8% | 12.1% | $80,921 |
| Netherlands | 18 | 37.3% | 14.8% | 11.7% | 10.7% | $75,638 |
| Estonia | 19 | 37.2% | 10.8% | 1.2% | 25.3% | $41,627 |
| Lithuania | 20 | 37.2% | 16.3% | 19.2% | 1.8% | $32,304 |
| Norway | 21 | 35.7% | 16.9% | 7.3% | 11.5% | $72,394 |
| Poland | 21 | 35.6% | 6.2% | 15.3% | 14.1% | $38,942 |
| Denmark | 23 | 35.4% | 35.6% | 0.0% | 0.0% | $63,426 |
| Ireland | 24 | 33.2% | 19.7% | 3.6% | 9.9% | $69,266 |
| Iceland | 25 | 33.1% | 26.7% | 0.3% | 6.2% | $72,961 |
| Japan | 26 | 32.7% | 6.9% | 12.5% | 13.3% | $58,341 |
| United Kingdom | 27 | 30.9% | 12.5% | 8.5% | 9.8% | $65,654 |
| Canada | 28 | 30.5% | 14.3% | 6.7% | 9.5% | $50,615 |
| United States | 29 | 29.8% | 15.1% | 7.1% | 7.6% | $61,723 |
| Australia | 30 | 27.9% | 22.3% | 0.0% | 5.6% | $63,242 |
| Korea | 31 | 23.3% | 6.0% | 7.8% | 9.4% | $64,602 |
| Israel | 32 | 22.7% | 9.7% | 7.6% | 5.4% | $44,991 |
| Switzerland | 33 | 22.3% | 10.5% | 5.9% | 5.9% | $83,958 |
| Mexico | 34 | 20.1% | 8.5% | 1.2% | 10.4% | $15,839 |
| New Zealand | 35 | 18.8% | 18.8% | 0.0% | 0.0% | $42,757 |
| Chile | 36 | 7.0% | 0.0% | 7.0% | 0.0% | $24,160 |
| OECD Average | 36.0% | 13.7% | 8.5% | 13.8% | $55,587 | |
| Source: OECD, “Taxing Wages 2020.”
Note: Individual items may not sum to total because of rounding. |
||||||
| Rank | Tax Wedge Including VAT in % (As a Share of Labor Cost and VAT) | Income Tax in % | Employee and Employer Payroll Taxes in % | VAT in % | Total Average Annual Labor Cost per Employee Including VAT in $ | |
|---|---|---|---|---|---|---|
| Belgium | 1 | 56.1% | 18.3% | 29.7% | 8.0% | $89,118 |
| Germany | 2 | 53.7% | 14.7% | 30.4% | 8.6% | $92,244 |
| Austria | 3 | 52.9% | 10.7% | 32.6% | 9.6% | $89,677 |
| Italy | 4 | 51.7% | 15.6% | 29.0% | 7.0% | $66,303 |
| Hungary | 5 | 51.2% | 11.0% | 28.2% | 12.0% | $42,815 |
| France | 6 | 51.0% | 10.8% | 32.1% | 8.1% | $71,882 |
| Czech Republic | 7 | 49.7% | 9.4% | 30.0% | 10.3% | $48,514 |
| Slovenia | 8 | 49.5% | 9.6% | 29.5% | 10.5% | $46,474 |
| Sweden | 9 | 49.1% | 11.9% | 26.0% | 11.2% | $76,631 |
| Finland | 10 | 48.1% | 15.0% | 22.5% | 10.6% | $70,881 |
| Latvia | 11 | 48.0% | 12.9% | 25.6% | 9.4% | $35,904 |
| Slovak Republic | 12 | 46.8% | 7.6% | 30.8% | 8.4% | $36,918 |
| Portugal | 13 | 46.5% | 11.7% | 25.5% | 9.3% | $44,631 |
| Greece | 15 | 45.7% | 7.5% | 30.0% | 8.2% | $51,811 |
| Luxembourg | 15 | 45.9% | 13.6% | 20.2% | 12.1% | $92,091 |
| Estonia | 16 | 44.6% | 9.5% | 23.3% | 11.8% | $47,177 |
| Spain | 17 | 44.0% | 10.7% | 25.8% | 7.4% | $61,005 |
| Denmark | 19 | 43.2% | 31.4% | 0.0% | 11.8% | $71,925 |
| Netherlands | 20 | 42.8% | 13.5% | 20.5% | 8.9% | $82,989 |
| Lithuania | 21 | 42.8% | 14.9% | 19.1% | 8.9% | $35,443 |
| Turkey | 21 | 43.0% | 10.7% | 25.9% | 6.3% | $40,123 |
| Norway | 22 | 42.7% | 15.1% | 16.7% | 10.9% | $81,226 |
| Poland | 23 | 41.4% | 5.6% | 26.8% | 9.0% | $42,801 |
| Iceland | 24 | 40.2% | 23.9% | 5.8% | 10.6% | $81,575 |
| Ireland | 25 | 39.1% | 18.0% | 12.3% | 8.9% | $76,001 |
| Japan | 26 | 36.2% | 6.5% | 24.5% | 5.2% | $61,539 |
| United Kingdom | 27 | 35.9% | 11.6% | 17.0% | 7.3% | $70,796 |
| Canada | 28 | 32.1% | 13.9% | 15.8% | 2.4% | $51,844 |
| United States | 29 | 31.6% | 14.7% | 14.2% | 2.7% | $63,416 |
| Australia | 30 | 31.1% | 21.3% | 5.4% | 4.4% | $66,174 |
| Israel | 31 | 29.5% | 8.9% | 11.8% | 8.8% | $49,306 |
| New Zealand | 32 | 28.5% | 16.5% | 0.0% | 11.9% | $48,557 |
| Korea | 33 | 28.0% | 5.7% | 16.2% | 6.1% | $68,831 |
| Switzerland | 34 | 26.2% | 10.0% | 11.1% | 5.0% | $88,374 |
| Mexico | 35 | 23.6% | 8.1% | 11.1% | 4.4% | $16,560 |
| Chile | 36 | 16.0% | 0.0% | 6.3% | 9.7% | $26,745 |
| OECD Average | 41.5% | 12.5% | 20.3% | 8.7% | $60,870 | |
| Source: OECD, “Taxing Wages 2020”; OECD, “What drives consumption tax revenues?” 2020; Tax Foundation staff calculations.
Note: Individual items may not sum to total because of rounding. The data for the VAT Revenue Ratio used for this calculation is from 2017 and is the latest data available. |
||||||
| Country | Employment Form | Tax Wedge |
|---|---|---|
| Australia | Employee | 28.6% |
| Unincorporated contractor | 28.6% | |
| Sole trader | 24.4% | |
| Hungary | Employee | 46.2% |
| Quasi self-employed | 44.9% | |
| Sole trader — low-skilled |
43.0% | |
| Sole trader — high-skilled |
43.4% | |
| Italy | Employee — permanent contract |
47.7% |
| Employee — fixed-term contract |
48.2% | |
| Continuous and coordinated staff |
44.6% | |
| Unincorporated self-employed |
49.7% | |
| Forfeit regime | 14.4% | |
| Netherlands | Employee | 37.4% |
| Unincorporated self-employed worker | 15.1% | |
| Sweden | Employee | 43.1% |
| Unincorporated self-employed |
40.4% | |
| United Kingdom | Employee | 30.9% |
| Self-employed — Sole trader | 20.4% | |
| United States | Employee | 31.8% |
| Sole proprietorship | 31.8% | |
| Source: OECD, “Taxing Wages 2020.” | ||
Methodology
Ratio of Marginal to Average Tax Wedge
The ratio of marginal to average tax wedges is calculated using the OECD data of marginal and average total tax wedges at four levels of income for single individuals without dependents. It is the average of marginal total tax wedges at 67 percent, 100 percent, 133 percent, and 167 percent of average earnings divided by the average of average total tax wedges at 67 percent, 100 percent, 133 percent, and 167 percent of average earnings.
Tax Wedges Accounting for VAT
The formula for calculating tax wedges that account for VAT utilizes the VAT rates and the VAT revenue ratio (VRR) from the OECD’s “What drives consumption taxA consumption tax is typically levied on the purchase of goods or services and is paid directly or indirectly by the consumer in the form of retail sales taxes, excise taxes, tariffs, value-added taxes (VAT), or income taxes where all savings are tax-deductible. revenues?” taxation working paper.[8],[9] We first calculate the tax-inclusive VAT rate, which is VAT rate/(1 + VAT rate). Next, we multiply the tax-inclusive VAT rate by the VAT revenue ratio and by the total labor cost to calculate the VAT amount. The formula for calculating the tax wedge including the VAT is then:

VAT/sales taxes are in both the numerator and the denominator because the tax wedge is taxes on labor as a share of total labor costs. For employees, VAT/sales taxes are part of taxes on labor, and they are also part of the total labor costs that employers face. By definition, a VAT is the rate of tax placed on the value added by a business by employing capital and labor. The added value is measured by the difference between the purchase price of materials and the sale of those materials (most often after a business turns those materials into something more useful). Though businesses may raise prices to pass the cost of a VAT or sales tax on to consumers in the short run, over the long run, the economic incidence of the VAT falls on workers.[10]
[1] Cristina Enache, “Sources of Government Revenue in the OECD,” Tax Foundation, Feb. 19, 2020, https://taxfoundation.org/publications/sources-of-government-revenue-in-the-oecd/.
[2] OECD Publishing, “Taxing Wages 2020,” https://www.oecd.org/ctp/tax-policy/taxing-wages-20725124.htm.
[3] Scott A. Hodge and Bryan Hickman, “The Importance of the Tax Wedge on Labor in Evaluating Tax Systems,” Tax Foundation, 2018, /wp-content/uploads/2018/09/Global-Primer_tax_wedge.pdf.
[4] Congressional Budget Office, “The Distribution of Household Income and Federal Taxes, 2013,” June 8, 2016, https://www.cbo.gov/publication/51361.
[5] Individual items may not sum to total because of rounding.
[6] See Table 1 in the Appendix.
[7] OECD, “Taxing Wages 2020.”
[8] OECD Publishing, “What drives consumption tax revenues?” 2020, https://doi.org/10.1787/94ed8187-en.
[9] The most recent OECD data available for the VAT revenue ratio is from 2017. VAT rates are from 2018. The U.S. sales tax rate is the average of all U.S. state sales tax rates (weighted by population); see Jared Walczak and Scott Drenkard, “State and Local Sales Tax Rates 2018,” Tax Foundation, Feb. 13, 2018, https://taxfoundation.org/state-and-local-sales-tax-rates-2018/. The U.S. sales tax revenue ratio was calculated as the ratio of the implicit sales tax baseThe tax base is the total amount of income, property, assets, consumption, transactions, or other economic activity subject to taxation by a tax authority. A narrow tax base is non-neutral and inefficient. A broad tax base reduces tax administration costs and allows more revenue to be raised at lower rates. to state personal income.
[10] Eric Toder, James R. Nunns, and Joseph Rosenberg, “Implications of Different Bases for a VAT,” Tax Policy Center and The Pew Charitable Trusts, Feb. 14, 2012, https://www.taxpolicycenter.org/publications/implications-different-bases-vat/full.
Share this article