Key Findings
- The taxation of capital—at both the individual and the corporate level—is much debated and affects economic growth by lowering the incentives to save and invest.
- It is useful to compare capital income taxation across countries; this is not trivial. Countries have many different taxA tax is a mandatory payment or charge collected by local, state, and national governments from individuals or businesses to cover the costs of general government services, goods, and activities. rates, exemptions, and special rules.
- We compute the average tax burden on capital income from aggregate statistics by dividing total capital tax revenue by total capital income. This is an approximation because households’ capital income taxes are not observed directly. Our method is well-used in the literature but has to our knowledge not been used to compare capital taxation across countries in recent years.
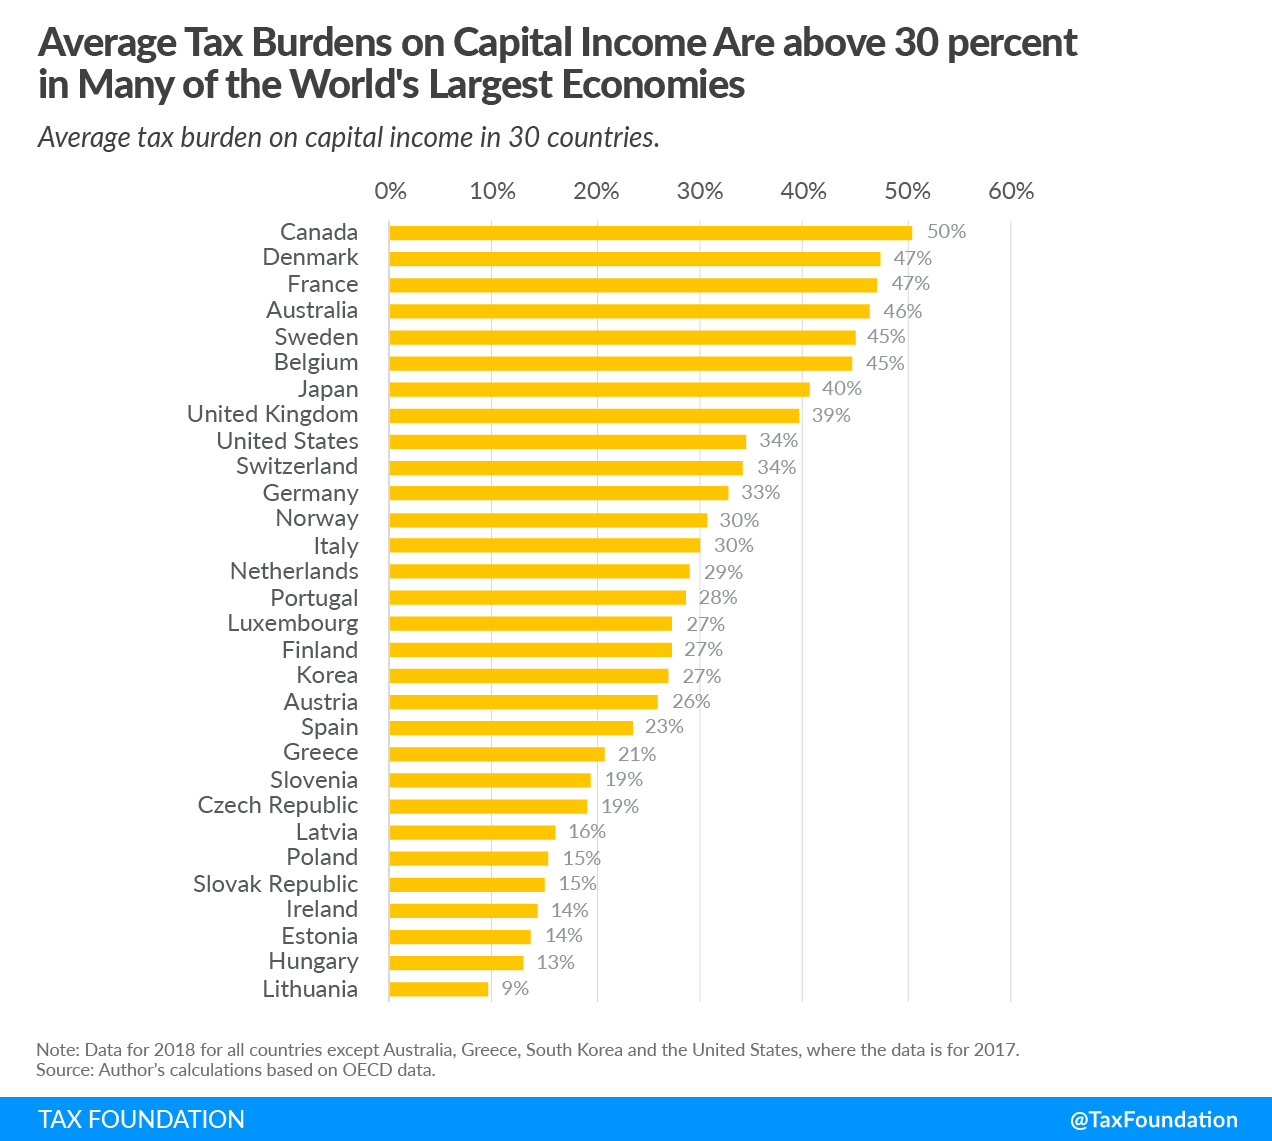
- Among the 30 OECD countries for which data is available, the average tax burden on all types of capital income is 29 percent, with a range from 9 percent in Lithuania to 50 percent in Canada. In general, English-speaking countries tend to have high capital taxes and Eastern European countries tend to have the lowest capital taxes. The data is from 2018 in most cases.
Introduction
The taxation of capital is a complex and controversial issue. Taxes on capital include individual capital income taxes and the corporate income tax as well as property and transaction taxes.
Capital is highly mobile. This is especially true for the corporate income tax base, as many firms nowadays have a global perspective when making investment decisions. High taxes on profits and capital gains also reduce the return to entrepreneurship. High capital and corporate income taxA corporate income tax (CIT) is levied by federal and state governments on business profits. Many companies are not subject to the CIT because they are taxed as pass-through businesses, with income reportable under the individual income tax. rates exacerbate well-known problems caused by the tax system; for example, the incentive for firms to borrow rather than finance investments with shareholders’ equity, as interest usually is deductible. In addition, the taxation of capital gains upon realization causes lock-in effects in financial and housing markets.
The textbook result in economics—due to model results from economists Christophe Chamley (in 1986) and Kenneth Judd (in 1985)—is that capital should not be taxed at all. Taxing capital distorts individuals’ savings decisions.[1] By reducing the return on savings, capital taxes penalize those who postpone their consumption rather than consuming their income as it is earned. Due to compounding interest, capital taxation penalizes saving more the longer the saving horizon is. For long saving horizons, the distortion is very large. This leads to lower saving, a lower capital stock, and lower GDP. Therefore, not taxing capital is in the interest of everyone, even those who spend everything they earn. The Chamley-Judd result is still discussed but remains the benchmark for the academic debate on capital taxation.[2]
As capital taxation is a much debated and economically significant issue, it is useful to compare taxation levels across countries. Data on statutory tax rates, as well as effective corporate income tax rates calculated from statutory tax rates and various factors determining the corporate tax baseThe tax base is the total amount of income, property, assets, consumption, transactions, or other economic activity subject to taxation by a tax authority. A narrow tax base is non-neutral and inefficient. A broad tax base reduces tax administration costs and allows more revenue to be raised at lower rates., is readily available from international organizations such as the OECD. However, we are not aware of any recent comparisons of the average tax burden on all types of capital income calculated from national accounts aggregates.[3]
Results: Average Tax Burden on Capital Income
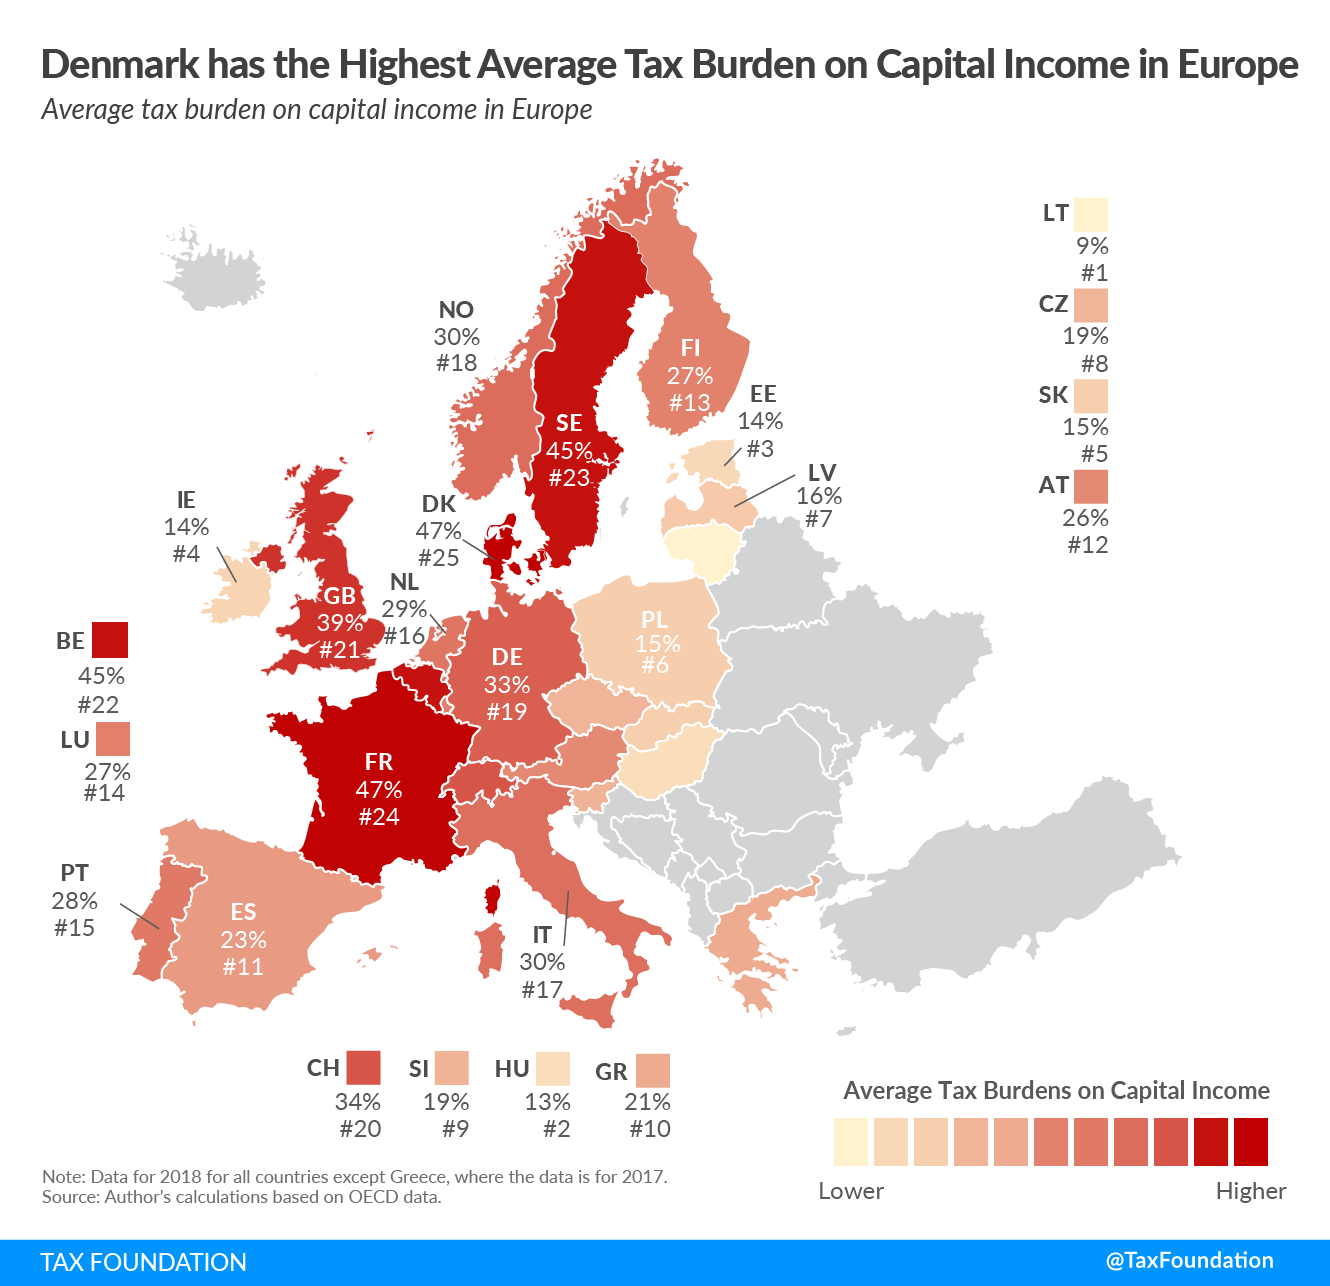
We report the average tax burden on capital income for 30 OECD countries in 2018, or 2017 in a few cases. The average among the countries is 29 percent, with a range from 9 percent in Lithuania to 50 percent in Canada. Eastern European countries, along with Ireland, have the lowest levels of capital taxation. Many Eastern European countries have flat or nearly flat income taxes and light corporate taxation. For example, the Hungarian corporate income tax rate is 9 percent and Estonia and Latvia only tax distributed profits. English-speaking countries, on the other hand, tend to tax capital relatively heavily.
Methodology
To compute the average tax burden on capital income, we use the formula from economist Enrique Mendoza and his coauthors from their study published in1994 which is well-used in the literature:[4]
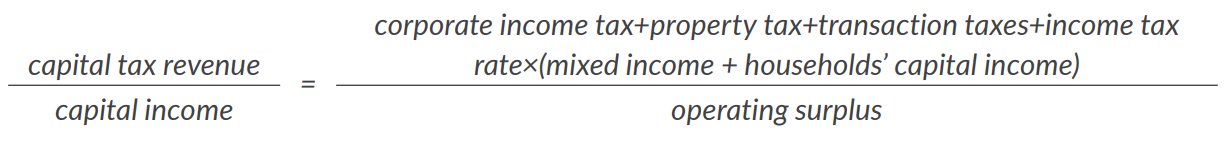
Looking first at the numerator, corporate income tax, property tax, and transaction taxes (such as stamp duty) are easily identified. The main challenge is to identify the amount of capital income tax paid by households. Most countries operate a comprehensive income tax, where capital and labor incomes are taxed together. Mendoza et al. (1994) solve this problem by assuming that the tax rate on capital income is the same as the tax rate on all income. They therefore multiply the average personal income tax rate with households’ capital income plus mixed income from owner-operated businesses. This implies that the formula is an approximation, but as we use the same formula for all countries, the ranking should not be affected very much.
Sweden is one of the countries that tax capital and labor income separately. This fact can be used to test the robustness of the formula. When using actual rather than estimated capital income tax revenues, Sweden’s capital income tax rate drops by 8 percentage points, implying that Sweden drops from 5th to 8th place in the country rankings. Thus, there is some uncertainty in the method, but we still believe it is the most robust and transparent way of comparing the average tax burden on capital income across countries.
The denominator is the total operating surplus in the economy, a national accounts term for profits. On an aggregate level, this corresponds to total capital income, including imputed rent for homeowners. Operating surplus can be reported gross or net, depending on whether depreciation of the capital stock is deducted. We use net operating surplus in our calculations, as this conceptually is the best definition of capital income: Capital owners care about the amount they can keep after expenses to replace worn-out capital. The country ranking changes little if we use gross operating surplus instead.
We calculate tax rates for all 30 OECD countries where data is available. The data is for 2018 for all countries except Australia, Greece, South Korea, and the United States, where the data is for 2017.
Stay informed on the tax policies impacting you.
Subscribe to our free newsletter to get the latest tax data, news and analysis.
Subscribe[1] Christophe Chamley, “Optimal taxation of capital income in general equilibrium with infinite lives,” Econometrica 54:3 (1986), and Kenneth L. Judd, “Redistributive taxation in a simple perfect foresight model,” Journal of Public Economics 28 (1985).
[2] For recent discussion of the Chamley and Judd results, see Ludwig Straub and Iván Werning, “Positive Long-Run Capital Taxation: Chamley-Judd Revisited,” American Economic Review 110:1 (2020), and Varadajan V. Chari, Juan Pablo Nicolini, and Pedro Teles, “Optimal capital taxation revisited,” Journal of Monetary Economics 116 (2020).
[3] See David Carey and Josette Rabesona, “Tax Ratios on Labour and Capital Income and on Consumption,” in Peter Birch Sørensen (ed.), Measuring the Tax Burden on Capital and Labor (Cambridge, Mass.: MIT Press, 2004), and Cara McDaniel, “Average tax rates on consumption, investment, labor and capital in the OECD 1950-2003,” Mimeo, Arizona State University, 2007 for older calculations, and Peter Birch Sørensen, “Measuring Taxes on Capital and Labor: An Overview of Methods and Issues,” in Peter Birch Sørensen (ed.), Measuring the Tax Burden on Capital and Labor (Cambridge, Mass.: MIT Press, 2004), for a discussion of conceptual issues.
[4] Enreique G. Mendoza, Assaf Razin, and Linda L. Tesar, “Effective tax rates in macroeconomics: cross-country estimates of tax rates on factor incomes and consumption,” Journal of Monetary Economics 34:3 (1994).
Share this article