Note: The following is the testimony of Scott A. Hodge, President of the Tax Foundation, prepared for the Senate Finance Subcommittee on Fiscal Responsibility and Economic Growth for a hearing on April 27, 2021, titled, “Creating Opportunity Through a Fairer Tax System.” You can watch a recording of the testimony here or at the video link below.
Thank you, Madame Chairman, ranking member Cassidy, members of the committee. I appreciate the opportunity to speak to you today about tax fairness, economic growth, and funding government investments.
A famous economist once said, “There are no solutions, there are only trade-offs.” That lesson is especially true in taxA tax is a mandatory payment or charge collected by local, state, and national governments from individuals or businesses to cover the costs of general government services, goods, and activities. policy and in the choices lawmakers must make in funding public investments.
The scales of justice may have two trays, but tax policy has three trays that lawmakers must balance—revenues, equity, and economic growth. But, these factors cannot be balanced equally.
In other words, lawmakers must decide which is most important: (1) how much revenues a tax will raise, (2) progressivity, or who bears the burden of the tax, or (3) what impact those tax changes will have on economic growth.
Extensive economic modeling and empirical evidence tells us that there is a clear trade-off between progressivity and economic growth. This is especially true with so-called success taxes—taxes on capital and business income.
Understanding these dynamics matters in how you fund government investments. Research by the Congressional Budget Office (CBO) has found that government investments deliver only half of the economic returns of private sector investments. Given the opportunity costs that come with government spending, lawmakers must be careful in choosing offsets that don’t do more harm to the economy than the modest benefits generated by the public investments.
Indeed, the U.S. tax system is already very progressive and redistributive, so making the tax code even more progressive through proposals such as a wealth tax, a minimum tax on book incomeBook income is the amount of income corporations publicly report on their financial statements to shareholders. This measure is useful for assessing the financial health of a business but often does not reflect economic reality and can result in a firm appearing profitable while paying little or no income tax. , or an increase in the corporate tax rate are among the most economically damaging options that lawmakers could use to fund government investments. Inevitably, these tax policies would slow the economy and reduce the living standards of the very people the new government investments are intended to help.
There are less economically harmful options to fund new government investments. These include cutting wasteful spending, expanding user fees, eliminating tax expenditures, and shifting the tax burden to consumption-based taxes.
Table of Contents
- Is the Tax System Fair?
- Corporate Tax Is Most Economically Harmful, Especially for Workers
- Trade-offs in Tax Policy: Balancing Revenues, Equity, Growth, and Simplicity
- The Economic Consequences of a Wealth Tax
- Trade-offs in Infrastructure
- Modeling Options for Financing Infrastructure Spending
- Conclusion
Watch Tax Foundation President Scott Hodge’s Testimony
Is the Tax System Fair?
Before we explore the trade-offs in tax policy, we should first address the perceived lack of fairness in the tax code.
By any objective measure, the U.S. tax code is extremely progressive and very redistributive. Indeed, a study by economists at the Organisation for Economic Co-Operation and Development (OECD) found that only Israel has a more progressive and more redistributive income tax system than the U.S. among the leading industrialized nations.[1]
As I outlined recently in testimony before the Senate Budget Committee,[2] Internal Revenue Service (IRS) data indicates that the wealthy in America are bearing the heaviest share of the income tax burden than in any time in recent history.
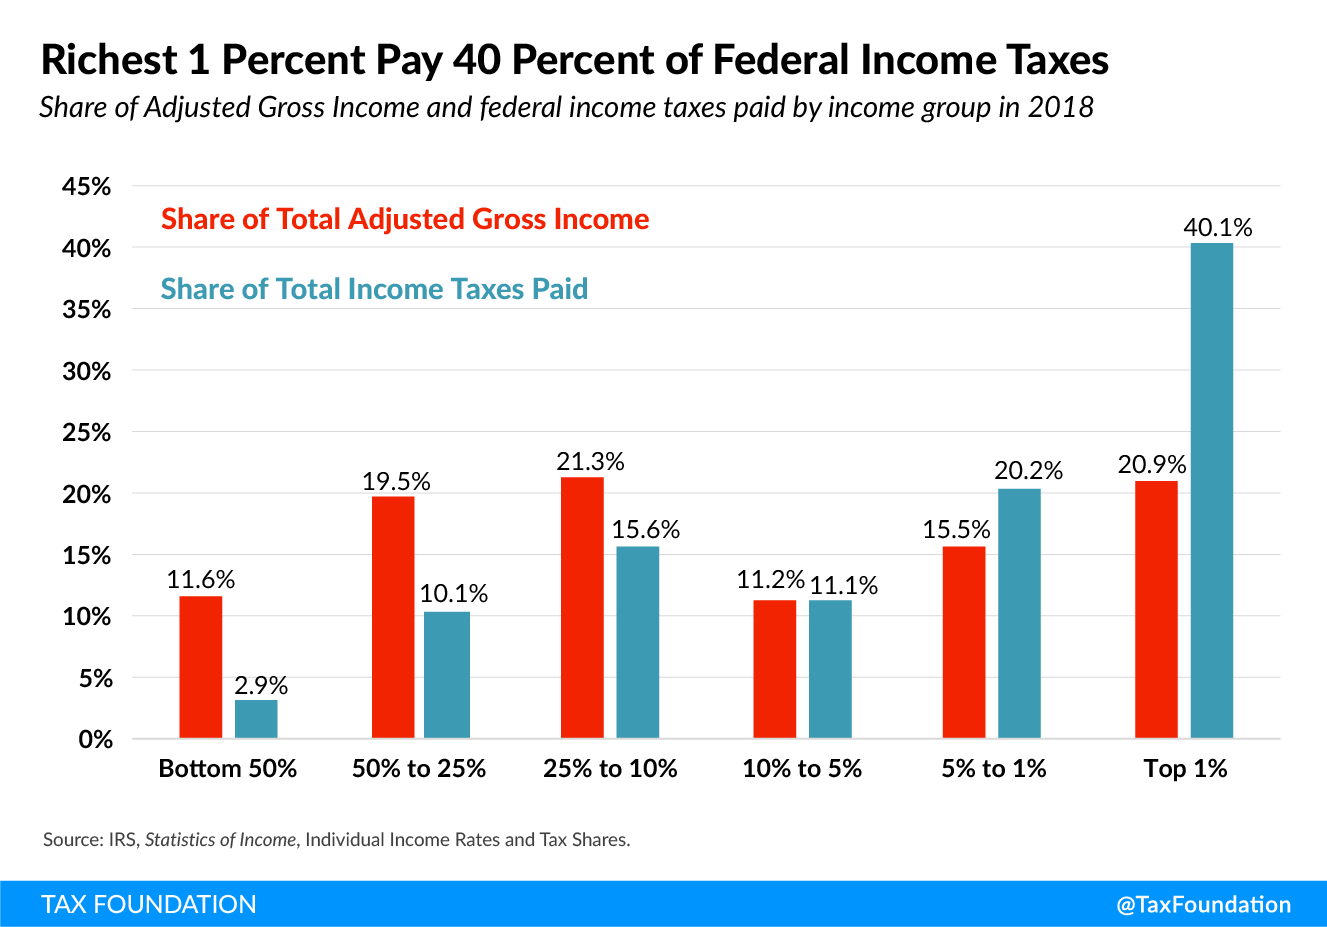
According to the latest IRS data for 2018—the year following enactment of the Tax Cuts and Jobs Act (TCJA)—the top 1 percent of taxpayers paid $616 billion in income taxes. As we can see in Figure 1, that amounts to 40 percent of all income taxes paid, the highest share since 1980, and a larger share of the tax burden than is borne by the bottom 90 percent of taxpayers combined (who represent about 130 million taxpayers).[3]
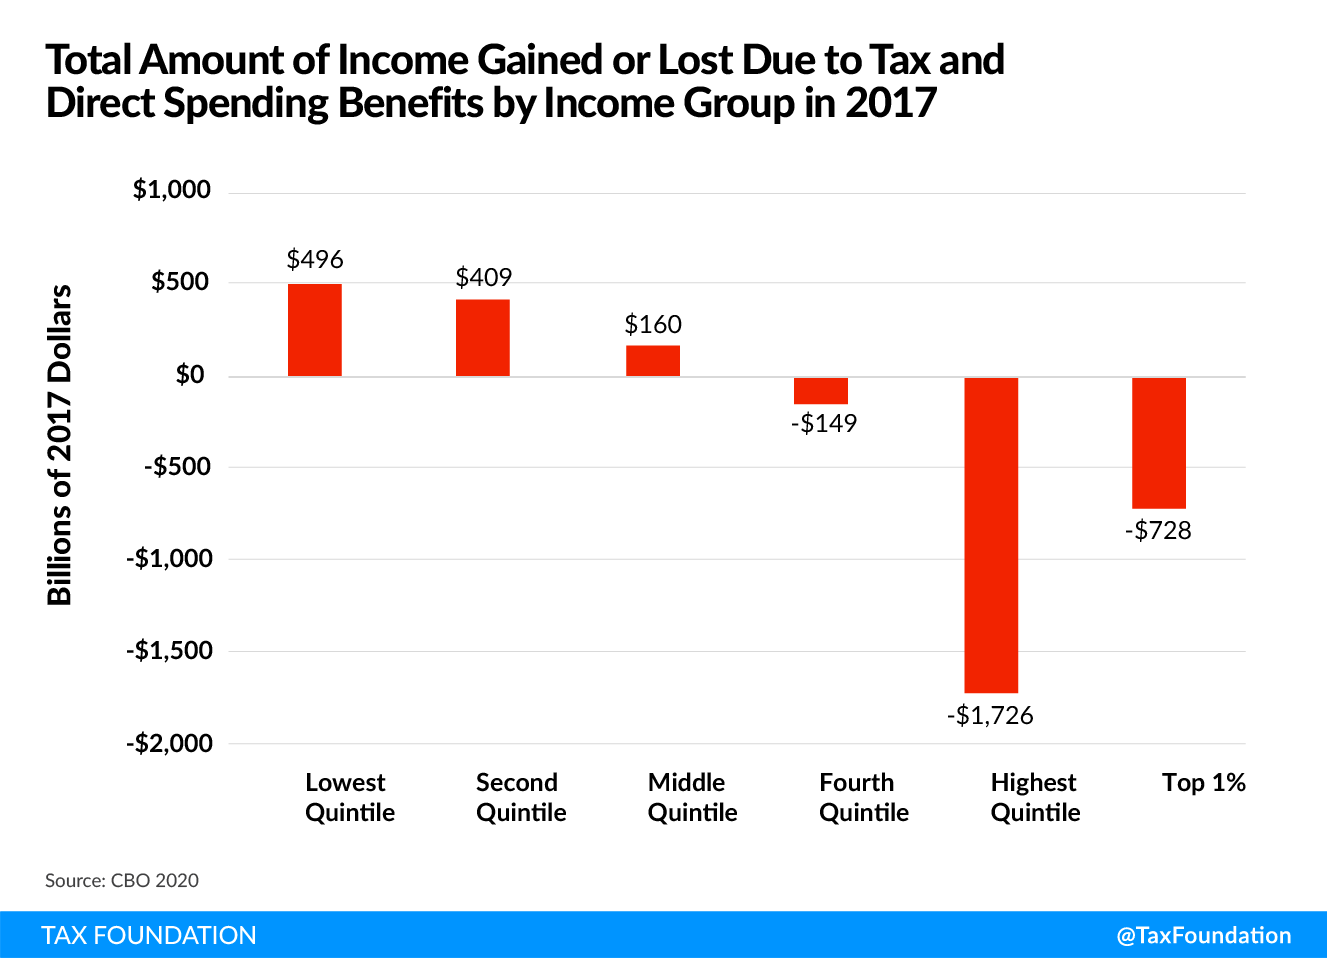
The tax and fiscal system are also very redistributive. A recent CBO study, The Distribution of Household Income, 2017,[4] provides an insight into the tax code’s progressivity and the redistributive effects of federal fiscal policy—both taxes and direct federal benefits.
Figure 2 shows that households in the bottom three quintiles collectively receive more than $1 trillion more in direct government benefits than they paid in all federal taxes in 2017. In other words, 60 percent of American households received more in benefits than they paid in federal taxes.[5]
By contrast, we can see that households in the top 20 percent paid $1.7 trillion more in taxes than they received in direct benefits, of which $728 billion came from households in the top 1 percent.
These are the results that you would expect from a highly progressive fiscal system.
Millions are off the tax rolls. Because of the expansion of various credits and deductions over the past three decades, millions of taxpayers pay no income taxes when they file their tax returns, and many receive sizable refunds despite having no tax liability.
IRS data for 2018 indicates that more than 53 million low- and middle-income taxpayers paid no income taxes after benefiting from record amounts of tax credits, or nearly 35 percent of all filers. Indeed, the doubling of the Child Tax Credit (CTC) from $1,000 to $2,000 in the TCJA increased the number of non-payers by more than 4 million.
The recently enacted American Recovery Plan Act (ARPA) allows households with children to claim up to $3,600 for children under age 6 or $3,000 for children 6 through 17 regardless of income. Our model estimates that this expansion of the CTC will result in 58.4 million tax filers—meaning 39 percent of all filers will have no income tax liability in 2021.
Corporate Tax Is Most Economically Harmful, Especially for Workers
Any discussion of corporate tax policies must begin with two economic realities. First, the corporate income taxA corporate income tax (CIT) is levied by federal and state governments on business profits. Many companies are not subject to the CIT because they are taxed as pass-through businesses, with income reportable under the individual income tax. is the most harmful tax for economic growth because capital is the most mobile factor in the economy and, thus, most sensitive to high tax rates. [6] Second, academic research indicates that workers bear at least half of the economic burden of the corporate tax through reduced wages, especially for “the low-skilled, women, and young workers.” [7]
So, raising corporate taxes hurts workers and economic growth.
It is also worth noting that the number of traditional C corporations in the U.S. has fallen to less than 1.6 million, fewest since 1974, and 1 million fewer than three decades ago. They have been supplanted by a dramatic rise in the number of pass-through businessA pass-through business is a sole proprietorship, partnership, or S corporation that is not subject to the corporate income tax; instead, this business reports its income on the individual income tax returns of the owners and is taxed at individual income tax rates. forms, such as S corporations and LLCs. As a result, there is more business income taxed on individual 1040 tax forms than traditional 1120 corporate tax returns.[8]
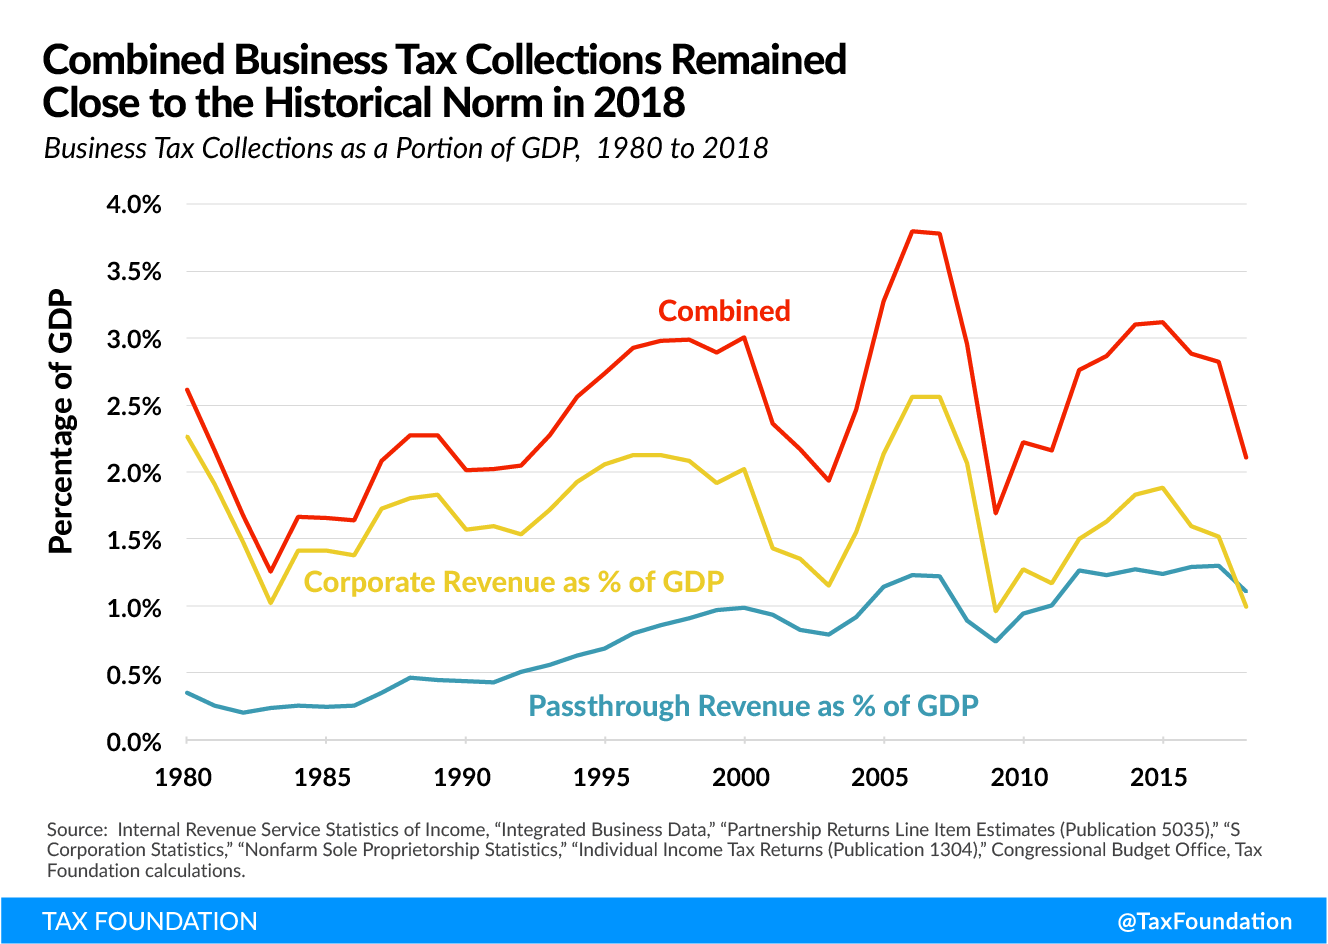
We can see from Figure 3 that corporate tax revenues have been highly volatile over the past 40 years, rising and falling with the business cycle.[9] This volatility is despite the U.S. levying one of the highest corporate tax rates in the industrialized world, until the TCJA lowered the federal rate from 35 percent to 21 percent.
We can also see that income tax collections from pass-through businesses have been steadily rising and now largely equal the collections from traditional C corporations, each amounting to roughly 1 percent of GDP.
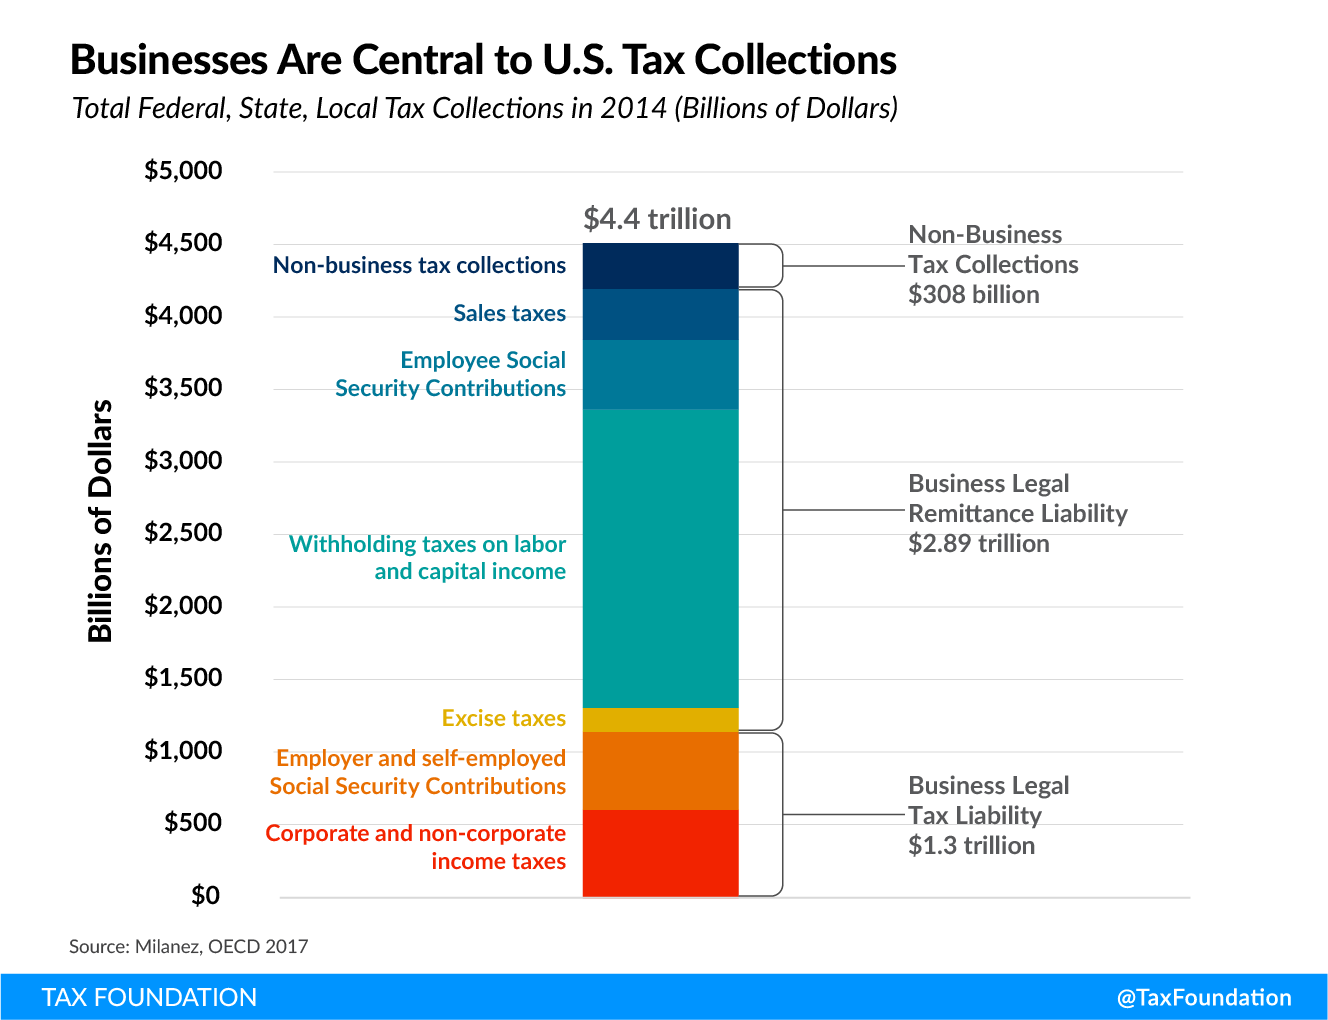
The U.S tax system is most “business dependent.” While business tax collections can rise and fall due to economic conditions and changes in tax policies, the U.S. tax system is still one of the most “business dependent” systems anywhere according to a 2017 study by OECD economist Anna Milanez.
Her report found that U.S. businesses either pay or remit more than 93 percent of all the taxes collected by governments in the U.S.[10] As Figure 4 illustrates, this includes taxes paid directly by businesses, such as corporate income taxes, property taxes, and excises taxes, as well as the taxes businesses remit on behalf of employees and customers, such as payroll taxes, withholding taxes, and sales taxes.
Without businesses as their taxpayers and tax collectors, American governments would not have the resources to provide even the most basic services.
TCJA policies reduced corporate collections but boosted capital investments. Many lawmakers are pointing to the fact that corporate tax collections have declined since the TCJA as evidence that corporations are not “paying their fair share of taxes.”
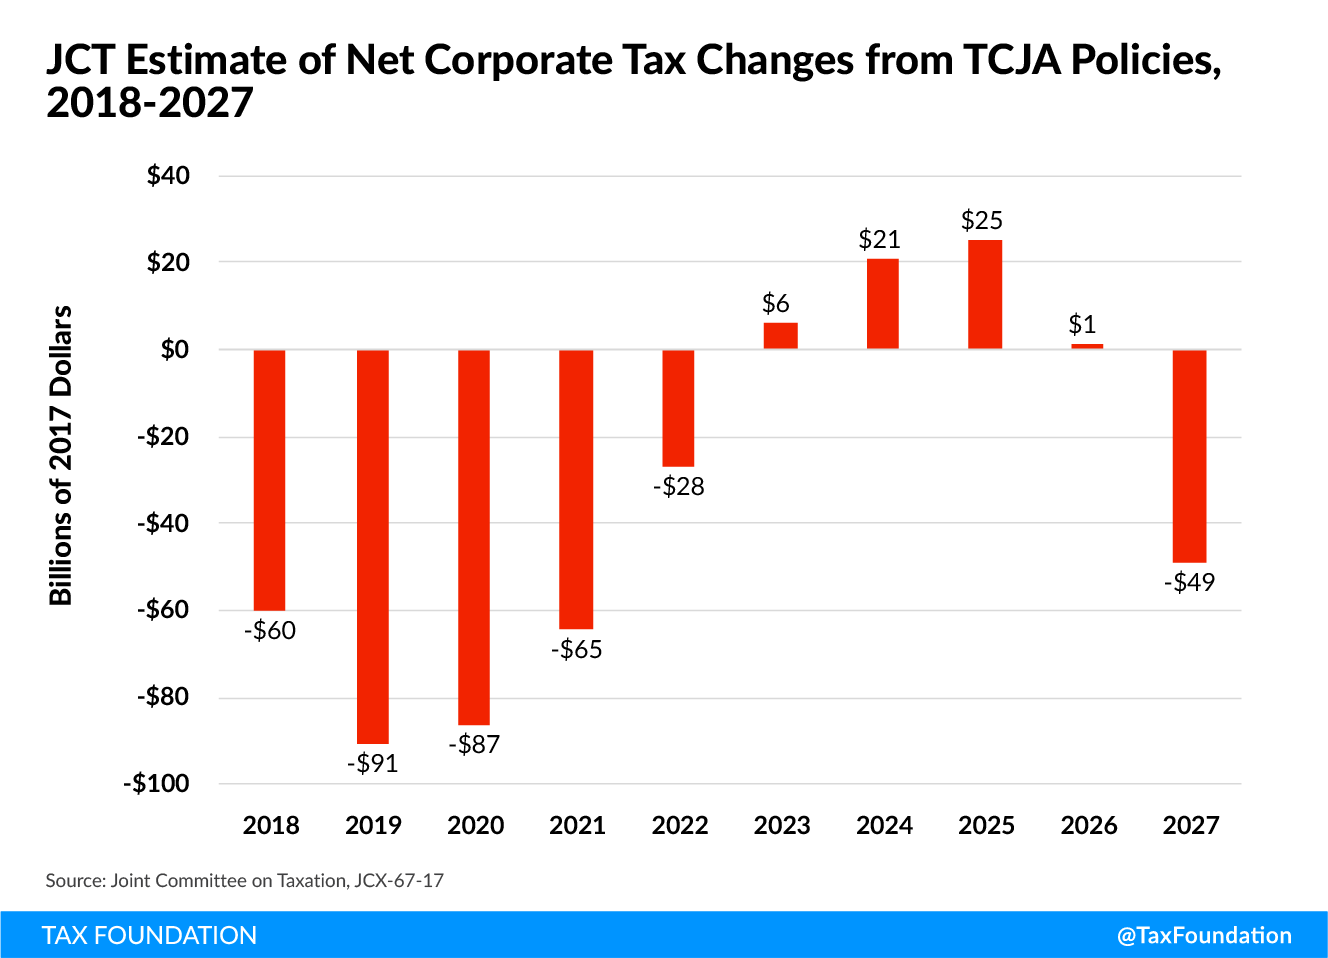
Considering the rhetoric surrounding the TCJA’s corporate tax provisions, most people would never know that they comprised just 22 percent of the TCJA’s $1.45 trillion in total tax cuts. According to the Joint Committee on Taxation’s scoring of the TCJA, the corporate tax reforms (which included the rate cut to 21 percent and the expensing provisions) were estimated to reduce tax revenues by about $654 billion over 10 years. However, half of this amount was offset by the TCJA’s international tax provisions which were designed to raise over $324 billion, thus cutting the net amount of corporate tax relief to $328 billion over 10 years.
If we consider the winners and losers from the various provisions, it is fair to say that the winners are largely the domestic firms that benefited from the lower corporate rate and bonus expensing, while the losers were the multinational firms that were targeted with higher taxes on their foreign income.
Furthermore, as can be seen in Figure 5, the corporate tax relief was front-loaded in the first five years of the plan as the lower corporate tax rate and the bonus expensing provisions took hold to boost capital investment. These revenue “losses” were scheduled to turn to revenue increases after 2022 as the bonus expensing provision began to phase out and other planned tax increases (such as the amortization of Research and Development (R&D) expenses) kicked in.
Although the political focus has been on the drop in corporate tax revenues post-TCJA, it appears that the combination of the bonus expensing provision and the lower corporate tax rate did spur an increase in corporate investment in things like equipment, buildings, and research and development. Table 1, shows that corporate fixed investment jumped 9.0 percent in nominal terms in 2018 following enactment of the TJCA, and increased an additional 4.4 percent in 2019.[11]
While there are always a lot of factors that contribute to economic data, these results should not be surprising based on the empirical evidence from past expansions of bonus expensing of capital investments or other evidence from corporate tax changes around the world.[12] With bonus expensing, it is important to remember that the only way firms can claim the tax benefit is to invest in new capital equipment.
Moreover, unlike depreciation, which spreads the deduction for capital investments over time, bonus expensing is taken only in the year the purchase is made. So, a deduction for capital investment taken today does not translate into deductions taken in future years.
| FY 2017 (billions) | FY 2018 (billions) | FY 2019 (billions) | Annual change ($ billions) | Annual % change | |||
|---|---|---|---|---|---|---|---|
| FY 2018 | FY 2019 | FY 2018 | FY 2019 | ||||
| Corporate Tax Revenues (CBO)* | $297.05 | $204.73 | $230.25 | -$92.32 | $25.51 | -31.1% | 12.5% |
| C and S Corporation Investment (BEA) | $2,035.20 | $2,218.20 | $2,316.10 | $183.00 | $97.90 | 9.0% | 4.4% |
| C Corporation Investment (BEA, IRS)* | $1,430.97 | $1,559.64 | $1,628.48 | $128.67 | $68.83 | 9.0% | 4.4% |
|
Note: *C corporation investment is imputed using IRS data on the assets of C corporations, S corporations, REITs and RICs. Sources: Congressional Budget, Bureau of Economic Analysis, Office, Internal Revenue Service. |
|||||||
Trade-offs in Tax Policy: Balancing Revenues, Equity, Growth, and Simplicity
Over the past decade, Tax Foundation economists have modeled hundreds of changes to the tax code and found that it is nearly impossible to balance revenues, equity, and growth equally. Lawmakers will have to decide which of these factors is most important based on their values and priorities.
For example, if lawmakers want to make the tax code more progressive and raise revenues, our model shows that they will likely have to give up some economic growth, because higher tax rates dampen economic activity, especially higher taxes on capital and labor.
And slower growth often raises less revenues.
On the other hand, simplifying the tax code, say by eliminating certain tax expenditures, not only can raise revenues, but it also can increase the progressivity of the code while doing less economic harm than raising marginal tax rates. The tax base matters just as much as tax rates.
If lawmakers want to generate more economic growth, our model shows that they will likely have to give up some progressivity, and maybe some tax revenues too. Although, all things being equal, a larger economy will tend to generate more tax revenues than the baseline. But, contrary to what some advocates profess, tax cuts rarely pay for themselves.
The Economic Consequences of a Wealth TaxA wealth tax is imposed on an individual’s net wealth, or the market value of their total owned assets minus liabilities. A wealth tax can be narrowly or widely defined, and depending on the definition of wealth, the base for a wealth tax can vary.
“Tax Fairness” and economic growth may not be compatible goals. A wealth tax is a good example of the trade-off between making the tax code more progressive and slower economic growth. Sen. Elizabeth Warren’s (D-MA) proposal would impose a 2 percent tax rate on every dollar of net wealth between $50 million and $1 billion, and a 6 percent tax rate on net wealth over $1 billion.
Tax Foundation economists modeled the economic effects of this proposal using our Taxes and Growth (TAG 2.0) General Equilibrium Tax Model. On a conventional basis, the model determined that the proposal could raise nearly $2.2 trillion over 10 years and reduce the after-tax incomes of the top 1 percent of taxpayers by 13.5 percent.
This new revenue and increased progressivity come with an economic cost. The model found that the wealth tax would reduce the size of the economy by 0.8 percent in the long run, shrink the capital stock by 2.0 percent, wages by 0.7 percent, and eliminate 149,000 full-time equivalent jobs. It would ultimately reduce after-tax incomes across the board, and by 0.6 percent for the bottom quintile.[13]
To put this in perspective, the wealth taxes’ hit to GDP is greater than the effect of raising the corporate tax rate to 28 percent and four times the economic impact of levying a $25 per-ton carbon tax.
Interestingly, the TAG 2.0 model found that the wealth tax would reduce national income, measured by GNP (gross national product), by 1.5 percent, nearly twice the impact to the broader economy as measured by national output, or GDP. Why is that?
It turns out that the model determined that the wealth tax would force the wealthy to sell their assets to pay the tax, often at discount prices. Because the U.S. is an open economy and capital markets are global, the model indicated that foreign investors would purchase those assets, which is why national output (GDP) does not fall by as much as national income (GNP). But what this does mean is that the wealth tax would result in the transfer of ownership of those assets from wealthy Americans to wealthy foreigners.[14]
Thus, the unintended impact of a wealth tax is that it would transfer wealth from U.S. millionaires and billionaires to foreign billionaires and mean that American workers could increasingly be employed by foreign employers. Now owned by foreigners, these assets would be out of reach of the wealth tax.[15]
Equity and simplicity may also not be compatible goals.
The various proposals to levy a minimum tax on corporate book income are also good examples of taxes aimed at making the system more progressive, but which would add considerable complexity to the code and ultimately retard economic growth.
Sen. Warren has proposed a “Real Corporate Profits Tax” to be levied at 7 percent of a corporation’s profits as reported on financial statements after the first $100 million in profits.[16] It would be assessed in addition to the standard corporate income tax. [17]
President Biden proposed a minimum tax of 15 percent on the financial income of corporations reporting more than $100 million in book income. Unlike Warren’s proposal, Biden’s proposal would operate as an alternative minimum tax that would be applied to large corporations if their effective tax rate falls below 15 percent on income as reported on financial statements.
A minimum tax on book income would introduce significant complexity into the corporate tax code while outsourcing key aspects of the corporate income tax to unelected decision-makers at the Financial Accounting Standards Board (FASB), who establish the standards for corporate book income.
Our 2019 scoring of the Warren book tax proposal found that it would reduce the size of the economy by 1.9 percent, lower the capital stock by 3.3 percent, trim wages by 1.5 percent, and cost the economy over 450,000 jobs. And while those at the top of the income scale would see the largest declines in after-tax incomes, taxpayers in every income group would see their incomes fall as a result.
Interestingly, our model estimated that the plan would raise $872 billion over 10 years on a conventional basis, but after accounting for the economic impact of the tax, the model lowered that revenue estimate by nearly 50 percent to $476 billion. This is an indication that progressive taxes don’t always deliver the amount of revenues that are predicted.
| Gross Domestic Product (GDP) | -1.90% |
| Capital Stock | -3.30% |
| Wages | -1.50% |
| Service Price of Capital | 2.60% |
| Full-time Equivalent Jobs | -454,000 |
|
Source: Tax Foundation General Equilibrium Model, March 2019 |
|
The Biden book tax proposal would not have as severe of an economic impact as the Warren version, nor would it raise as much revenue. However, I should note that we did not model the proposal separately from Biden’s other corporate tax plans, such as raising the rate to 28 percent. Still, our TAG 2.0 model estimates that the Biden book tax proposal would raise about $203 billion over 10 years when combined with Biden’s other tax proposals and reduce the size of the economy by 0.21 percent.
The economic effect of a tax on book income depends on whether the tax is assessed as a minimum tax, like the Biden proposal, or if it is a tax applied to book income on top of the existing corporate income tax, like the Warren proposal. Both add complexity to the tax code, and both would slow economic growth.
Trade-offs in Infrastructure
Lawmakers need to be very careful in deciding how to fund government investments because when the CBO reviewed the academic literature on the economic returns to public investments, it found that the economic benefits are relatively modest and about half the returns to private investments.[18]
“CBO estimates that the average rate of return on private sector investment is currently about 10 percent—that is, that a $1 increase in private investment, all else being equal, increases output by 10 cents over a year. As a result, the average rate of return on federal investment in the illustrative policies examined in this report is about 5 percent.”
In other words, a $100 million federal investment would increase GDP by $5 million, whereas the same private investment would boost GDP by $10 million.
Various factors explain why federal investments deliver smaller economic returns than private sector investments. According to the CBO:
“That is because public investment is not driven by market forces; its goals include not only achieving positive economic returns but also improving quality of life, reducing inequities, and addressing other objectives. In addition, an increase in federal investment spending is often partially offset by a decrease in investment spending by states and localities.”[19]
Thus, the CBO cautions, “the macroeconomic effects of an increase in federal investment would depend on how that spending is financed.”[20] In particular, CBO modeling of large infrastructure spending financed by different tax approaches determined that progressive income taxes would have the most harmful impact on economic growth and, thus, do the most harm to future generations.[21]
For example, it found that a progressive income tax (on all income) large enough to fund a 5 percent increase in spending would reduce the lifetime consumption of Americans born from 1980 to 1999 by 10.8 percent and those born from 2000 to 2019 by 13.3 percent.[22]
This strongly indicates that if lawmakers want to avoid reducing the living standards of the next generation of Americans, they should avoid using progressive taxes to finance new government investments or programs.
Modeling Options for Financing Infrastructure Spending
Tax Foundation economists recently modeled different funding mechanisms to pay for a stylized $1 trillion infrastructure plan. These include debt financing, increasing the corporate tax rate to either 28 percent or 32 percent, and user fees and excise taxes.
As Table 3 illustrates, the harmful effects of increasing the corporate tax rate swamp any benefits from the infrastructure spending. The 28 percent rate option would reduce the size of the economy by 0.5 percent, while the 32 percent rate option would reduce the economy by a full 1.0 percent—clearly making the benefits of such a package not worth the costs.
By contrast, our model found that the economic gains from spending with the debt financing option and the user fee/excise taxAn excise tax is a tax imposed on a specific good or activity. Excise taxes are commonly levied on cigarettes, alcoholic beverages, soda, gasoline, insurance premiums, amusement activities, and betting, and typically make up a relatively small and volatile portion of state and local and, to a lesser extent, federal tax collections. option outweighed the economic harm to GDP from the increased borrowing or the taxes (increased borrowing would reduce national income as measured by GNP).
However, the only option that resulted in positive employment gains was the debt financing option. Again, this points to the trade-offs lawmakers must consider when financing federal spending. Tax options have economic consequences, even if those effects don’t outweigh the benefits of the federal investments. That said, borrowing costs increase the overall cost of the debt financing option to over $1.2 trillion. These costs will have to be paid back by future taxpayers.
| Financing Options | Borrowing (issuance of federal debt) | Increase the corporate rate to 28 percent | Increase the corporate rate to 32 percent | User Fees/Excise Taxes |
|---|---|---|---|---|
| Long-Run Gross Domestic Product (GDP) | 0.20% | -0.50% | -1.00% | 0.01% |
| Capital Stock | 0.20% | -1.60% | -2.80% | 0.10% |
| Wage Rate | 0.20% | -0.40% | -0.80% | -0.60% |
| Full-time Equivalent Jobs | 43,000 | -96,000 | -192,000 | -126,200 |
| Ten-Year Static Deficit | -1294.9 | -406.7 | 40.3 | -37.2 |
| Ten-Year Dynamic Deficit | -1167.7 | -403.1 | -62.7 | -82.9 |
|
Note: We assume additional infrastructure spending of $1 trillion over five years, resulting in a gradual increase in the amount of infrastructure in place. Following the initial investment, we assume it generates a 5 percent return in line with Congressional Budget Office (CBO) estimates. We assume the infrastructure requires an increase in depreciation-related outlays to maintain the assets over time, requiring resources to be redirected from other types of output when the economy is in full-employment equilibrium. Roads and bridges are assumed to have at least a 50-year life and require about 2 percent of their initial cost in annual maintenance. The carbon tax option is imposed at $33 per ton in 2022, rising at 5 percent annually to $51.19 per ton by 2031. Source: Tax Foundation General Equilibrium Model, March 2021. |
||||
Conclusion
It may be a cliché, but there is no such thing as a free lunch in government spending or tax policy. Government investments are often sold to the public with the promise that they will improve lives and improve the economy. But, in fact, research finds that they deliver half of the economic benefits of private sector investments.
That means lawmakers must take great care in deciding how to finance government investments. Economic research and Tax Foundation modeling indicate there is a negative trade-off between progressive taxes on capital income—such as the wealth tax, minimum book tax on corporate income, and a higher corporate tax rate—and economic growth. These are among the most harmful taxes lawmakers could use to finance government investments. In every case, the economic harm caused by the taxes would swamp any of the benefits from the new spending, leaving taxpayers and the economy worse off.
[1] Peter Hoeller, Isabelle Joumard, Mauro Pisu, and Debra Bloch, “Less Income Inequality and More Growth—Are They Compatible? Part 1. Mapping Income Inequality Across the OECD,” OECD Economics Department Working Papers No. 924., 21, and Tables A1 and A2, Jan. 10, 2012, https://www.doi.org/10.1787/5k9h297wxbnr-en. See also OECD, “Growing Unequal? Income Distribution and Poverty in OECD Countries,” Oct. 21, 2008, 104-107, https://www.doi.org/10.1787/9789264044197-en.
[2] Scott A. Hodge, Testimony: Senate Budget Committee Hearing on the Progressivity of the U.S. Tax Code,” Mar. 25, 2021, https://www.taxfoundation.org/rich-pay-their-fair-share-of-taxes/.
[3] Erica York, “Summary of the Latest Federal Income Tax Data, 2021 Update,” Tax Foundation, Feb. 3, 2021, https://www.taxfoundation.org/federal-income-tax-data-2021/.
[4] Congressional Budget Office, “The Distribution of Household Income, 2017,” Oct. 2, 2020, https://www.cbo.gov/publication/56575.
[5] Scott A. Hodge, “Latest CBO Report on Incomes and Taxes Shows that the Federal Fiscal System is Very Progressive,” Tax Foundation, Jan. 26, 2021, https://www.taxfoundation.org/biden-fiscal-policy/#:~:text=Conclusion,is%20very%20progressive%20and%20redistributive.
[6] OECD, Tax Policy Reform and Economic Growth, OECD Tax Policy Studies, No. 20, Nov. 3, 2010, https://www.doi.org/10.1787/9789264091085-en.
[7] Clemens Fuest, Andreas Peichl, and Sebastian Siegloch, “Do Higher Corporate Taxes Reduce Wages? Micro Evidence from Germany,” American Economic Review 108:2 (February 2018): 393–418, https://www.doi.org/10.1257/aer.20130570.
[8] This shift in business forms has had a profound impact on perceptions of rising inequality. See Scott A. Hodge, “The Real Lesson of 70 Percent Tax Rates on Entrepreneurial Income,” Tax Foundation, Jan. 29, 2019, 5, https://www.taxfoundation.org/70-tax-rate-entrepreneurial-income/.
[9] Garrett Watson and Alex Durante, “Business Tax Collections Within Historical Norm After Accounting for Pass-through Business Taxes,” Apr. 15, 2021, https://www.taxfoundation.org/business-tax-collections-historical-norm/.
[10] Scott A. Hodge, “U.S. Businesses Pay or Remit 93 Percent of All Taxes Collected in America,” Tax Foundation, May 2, 2019, https://www.taxfoundation.org/businesses-pay-remit-93-percent-of-taxes-in-america/.
[11] See also Alex Durante and William McBride, “Corporate Investment Outweighs Federal Revenue Losses Since TCJA,” Apr. 22, 2021, https://www.taxfoundation.org/tax-cuts-and-jobs-act-corporate-investment-revenue-loss/.
[12] Scott A. Hodge, “Empirical Evidence Shows Expensing Leads to More Investment and Higher Employment,” May 19, 2020, https://www.taxfoundation.org/expensing-leads-to-more-investment-and-higher-employment/; and William McBride, “What is the Evidence on Taxes and Growth?” Tax Foundation, Dec. 18, 2012, https://www.taxfoundation.org/what-evidence-taxes-and-growth/.
[13] Tax Foundation, Options for Reforming America’s Tax Code 2.0, Apr. 19, 2021, 45, https://www.taxfoundation.org/tax-reform-options/.
[14] Huaqun Li and Karl Smith, “Analysis of Sen. Warren and Sen. Sanders’ Wealth Tax Plans,” Tax Foundation, Jan. 28, 2020, https://www.taxfoundation.org/wealth-tax/.
[15] Scott A. Hodge, “Warren’s Wealth Tax Enriches Foreign Billionaires,” The Wall Street Journal, Mar. 8, 2021. https://www.wsj.com/articles/warrens-wealth-tax-enriches-foreign-billionaires-11615227317.
[16] For a detailed analysis, see Kyle Pomerleau, “An Analysis of Senator Warren’s ‘Real Corporate Profits Tax’,” Apr. 18, 2019, https://www.taxfoundation.org/elizabeth-warren-corporate-tax-plan/#:~:text=We%20estimate%20that%20the%20Real,the%20U.S.%20and%20world%20economy.
[17] This section relies heavily on Garrett Watson and William McBride, “Evaluating Proposals to Increase the Corporate Tax Rate and Levy a Minimum Tax on Corporate Book Income,” Tax Foundation, Feb. 24, 2021, https://www.taxfoundation.org/biden-corporate-income-tax-rate/.
[18] Scott A. Hodge, “CBO Study: Benefits of Biden’s $2 Trillion Infrastructure Plan Won’t Outweigh $2 Trillion Tax Hike,” Tax Foundation, Mar. 31, 2021, https://www.taxfoundation.org/biden-infrastructure-spending-tax-hike/.
[19] Congressional Budget Office, Budgeting for Federal Investment, April 2021, 22, https://www.cbo.gov/publication/57142.
[20] Ibid.
[21] Jaeger Nelson and Kerk Phillips, “The Economic Effects of Financing a Large and Permanent Increase in Government Spending,” Congressional Budget Office, Working Paper 2021-03, Mar. 22, 2021, https://www.cbo.gov/publication/57021.
[22] Ibid, Table 3, 30.
