Key Findings
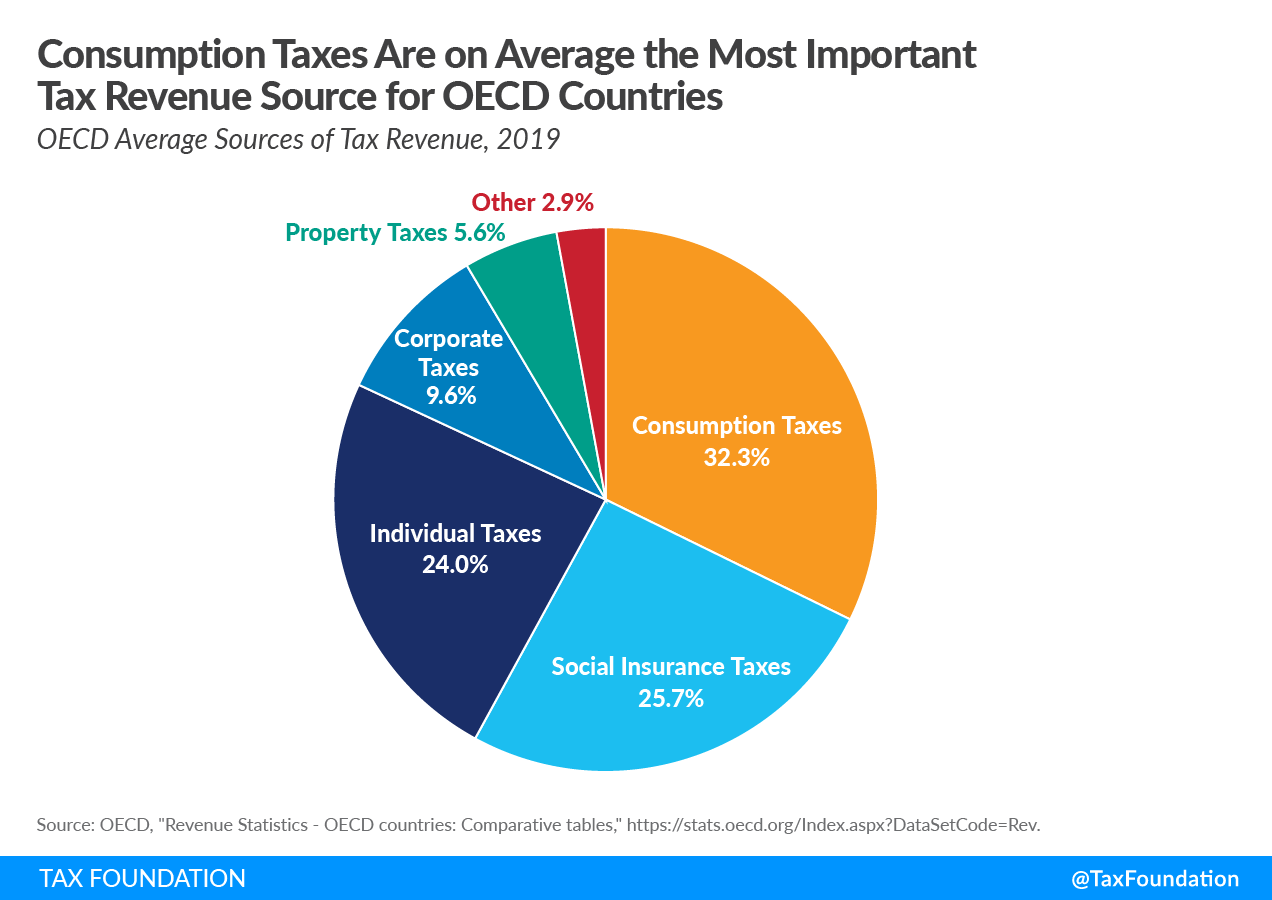
- In 2019, OECD countries raised on average one-third of their taxA tax is a mandatory payment or charge collected by local, state, and national governments from individuals or businesses to cover the costs of general government services, goods, and activities. revenue through consumption taxes such as the Value-added Tax (VAT), making consumption taxes the most important revenue source.
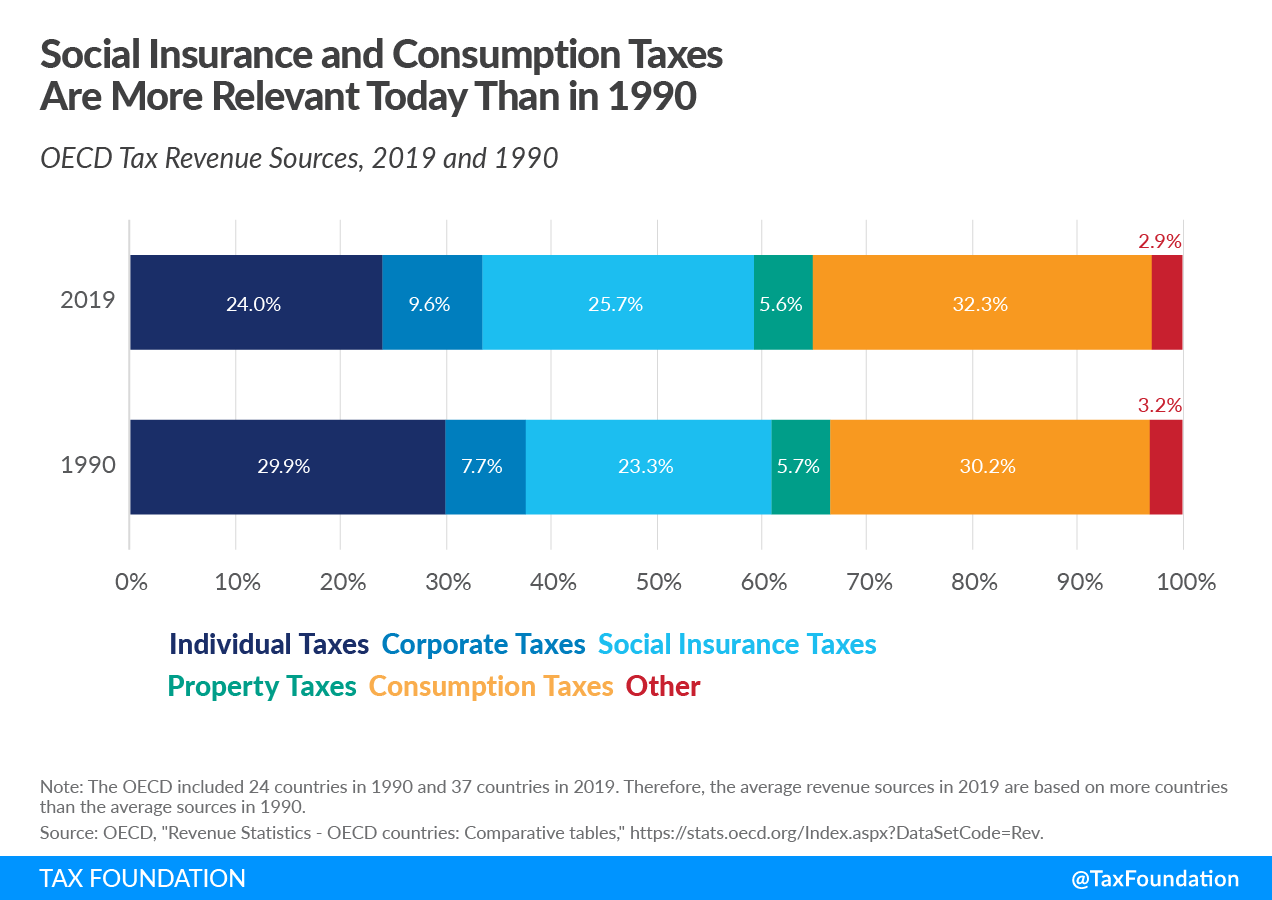
- Social insurance taxes and individual income taxes were the second and third most important sources of tax revenue in the OECD, at approximately 25 percent each. That’s a change from 1990, when individual income taxes accounted for more revenue than social insurance taxes.
- On average, OECD countries collected little from the corporate income taxA corporate income tax (CIT) is levied by federal and state governments on business profits. Many companies are not subject to the CIT because they are taxed as pass-through businesses, with income reportable under the individual income tax. (9.6 percent) and property taxA property tax is primarily levied on immovable property like land and buildings, as well as on tangible personal property that is movable, like vehicles and equipment. Property taxes are the single largest source of state and local revenue in the U.S. and help fund schools, roads, police, and other services. (5.6 percent).
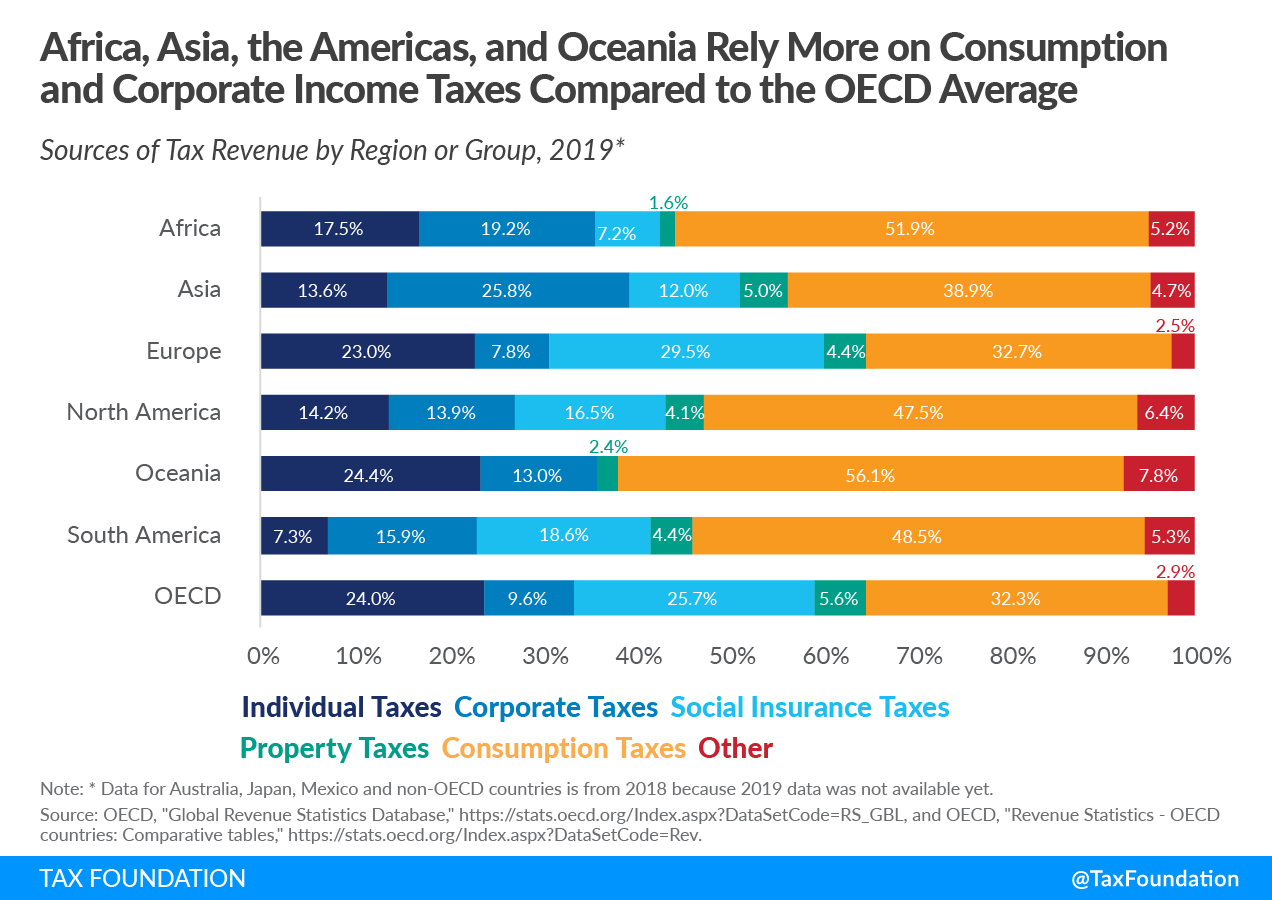
- Asia, Africa, and South America rely more on consumption taxes and corporate income taxes and less on income and social insurance taxes compared to the OECD average.
- On average, OECD and non-OECD countries in North America rely more on corporate income taxes and “other taxes” than the OECD average and less on social insurance and individual taxes.
- Oceania doesn’t rely at all on social insurance taxes, while consumption taxes are the region’s most important revenue source.
- On average, 16.1 percent of the total tax revenue collected by the 10 federal or fiscally decentralized OECD countries is raised at the regional or state level.
Taxes make more sense with us in your inbox.
Subscribe to our newsletter for tax insights that cut through the noise—and make sense of it.
Sign UpIntroduction
Developed countries raise tax revenue through a mix of individual income taxes, corporate income taxes, social insurance taxes, taxes on goods and services, and property taxes. The mix of tax policies can influence how distortionary or neutral a tax system is. Taxes on income can create more economic harm than taxes on consumption and property. However, the extent to which an individual country relies on any of these taxes can differ substantially.
A country may decide to have a lower corporate income tax to attract investment, which may reduce its reliance on corporate income tax revenue and increase its reliance on other taxes, such as social insurance taxes or consumption taxes. For example, in 2019, Lithuania raised only 5.2 percent of total revenue from corporate income taxes, but a combined 70.4 percent of total revenue came from social insurance taxes and consumption taxes.
Countries may also be situated near natural resources that allow them to rely heavily on taxes on related economic activity. Norway, for example, has a substantial oil production industry on which it levies a high (78 percent) income tax and thus raises a significant amount of corporate income tax revenue.[1]
These policy and economic differences among Organisation for Economic Co-operation and Development (OECD) countries have created differences in how they raise tax revenue.
Average OECD Tax Revenue Sources
Per the most recent data from the OECD (2019),[2] consumption taxes were the largest source of tax revenue for OECD countries. On average,[3] countries raised 32.3 percent of their tax revenue from consumption taxes. This is unsurprising given that all OECD countries (except the United States) levy Value-added Taxes (VAT) at relatively high rates.
The next significant source of tax revenue is social insurance taxes, which raise 25.7 percent of revenue on average. Individual income taxes accounted for 24 percent of total revenue across the OECD. The smallest shares of revenue were from corporate income taxes (9.6 percent) and property taxes (5.6 percent).
OECD Tax Revenue Sources, 2019 Compared to 1990
When comparing average 2019 and 1990 OECD tax revenue sources, the most notable change is a decrease in individual income taxes versus increases in social insurance and consumption taxes. The share of revenues from corporate income taxes has also increased compared to 1990 (despite declining corporate income tax rates[4]). The relative importance of property taxes as a source of revenue has stayed roughly constant.
Sources of OECD Tax Revenue
Consumption Taxes
Consumption taxes are taxes on goods and services. These are in the form of excise taxes, VAT, or retail sales taxes. Most OECD countries levy consumption taxes through VAT and excise taxes. The United States is the only country in the OECD with no VAT. Instead, most U.S. state governments and many local governments apply a retail sales taxA sales tax is levied on retail sales of goods and services and, ideally, should apply to all final consumption with few exemptions. Many governments exempt goods like groceries; base broadening, such as including groceries, could keep rates lower. A sales tax should exempt business-to-business transactions which, when taxed, cause tax pyramiding. on the final sale of products and excise taxes on the production of goods such as cigarettes and alcohol.[5]
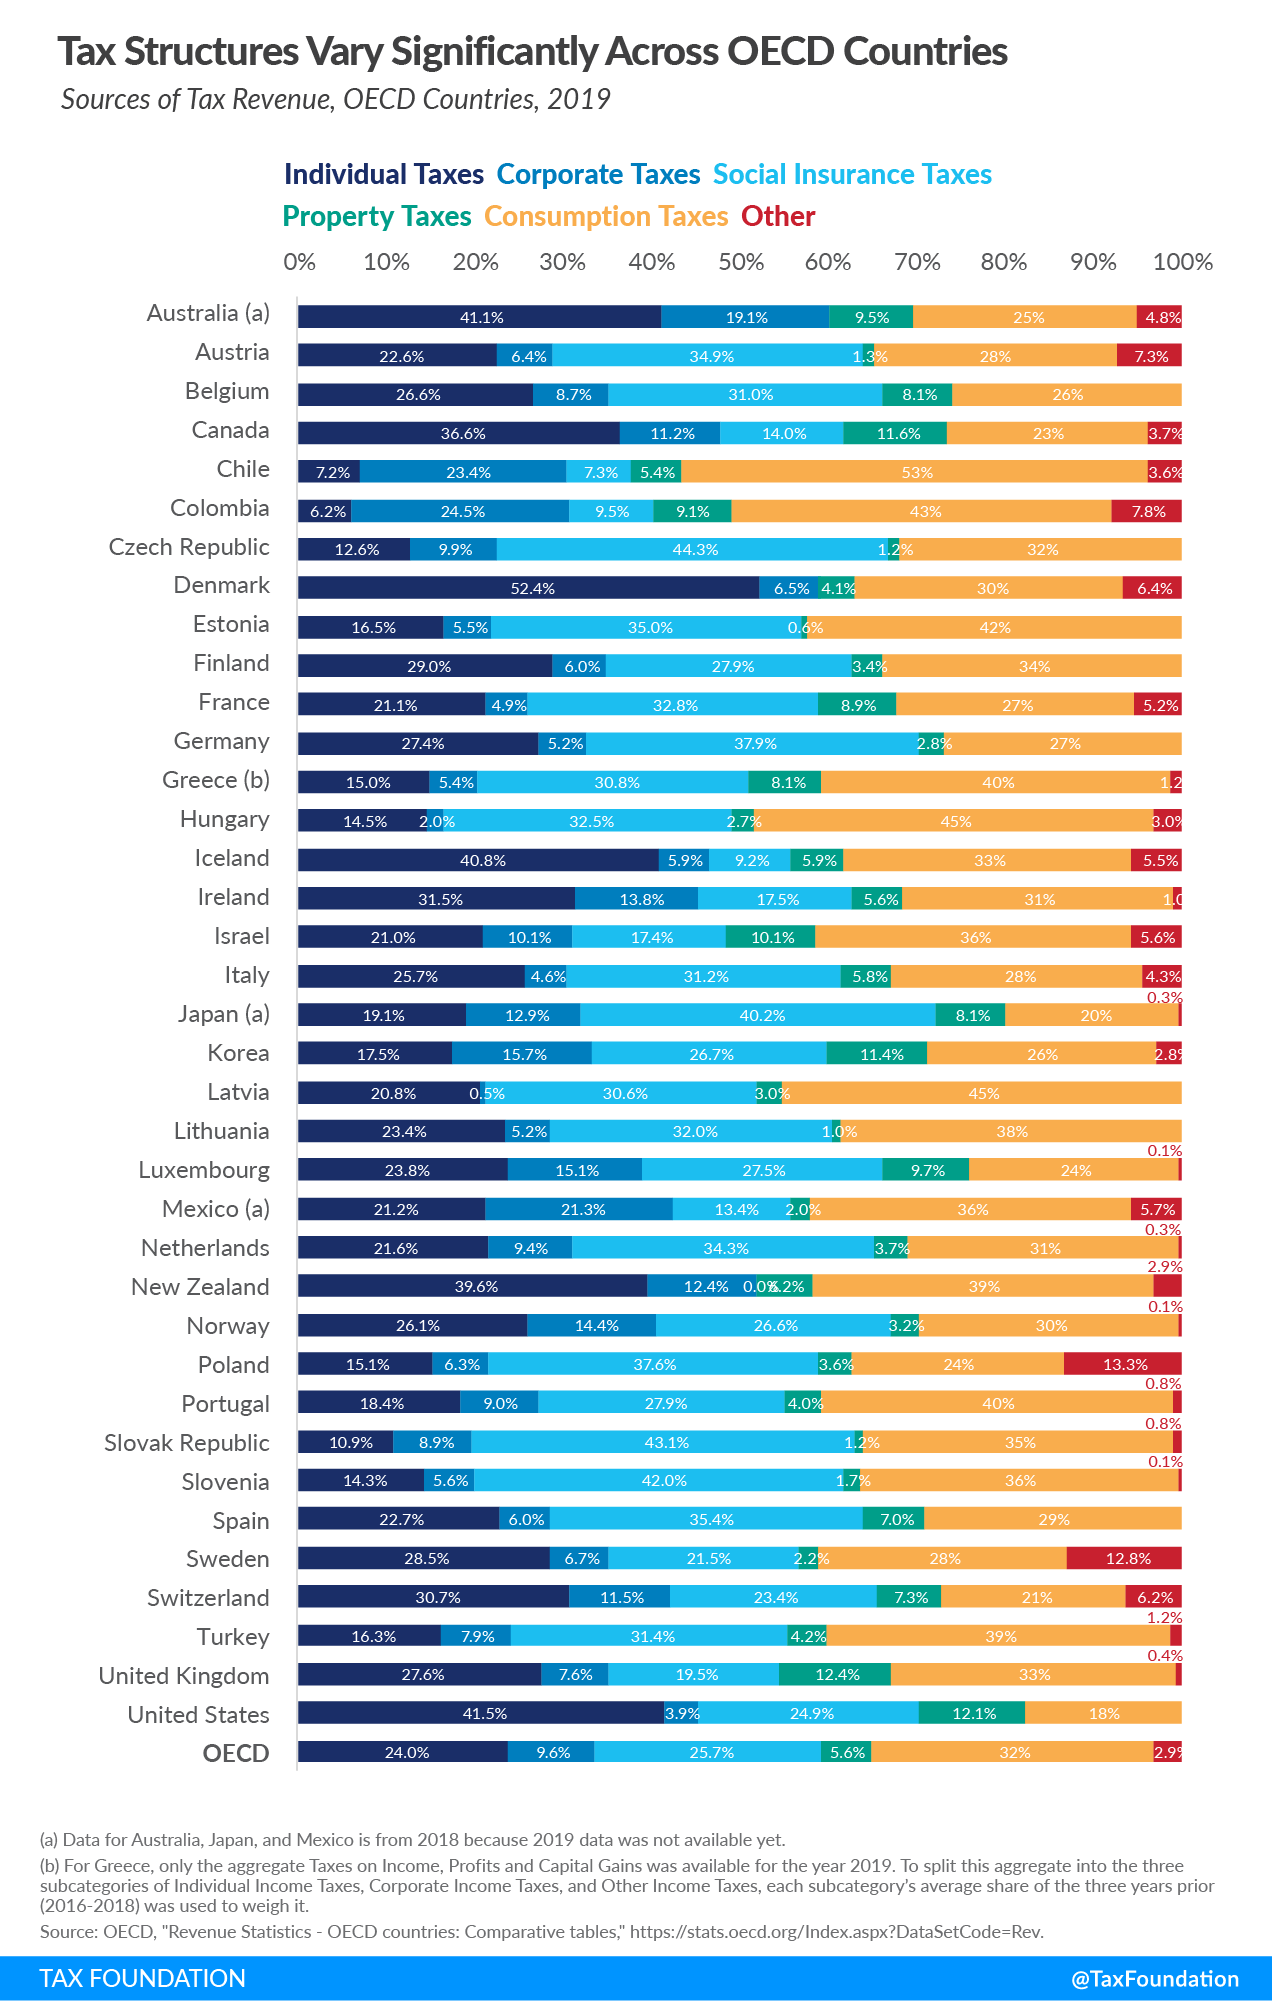
In 2019, Chile relied the most on taxes on goods and services, raising approximately 53.1 percent of its total tax revenue from these taxes. Chile was followed by Hungary (45.3 percent) and Latvia (45.1 percent) (Figure 3 and Table 1, below).
The United States raised the least amount of tax revenue in the OECD from consumption taxes, at 17.6 percent in 2019. Japan raised slightly more, at 19.5 percent, followed by Switzerland, at 21 percent.
Social Insurance Taxes
Social insurance taxes are typically levied in order to fund specific programs such as unemployment insurance, health insurance, and old-age insurance. In most countries, these taxes are applied to both an individual’s wage and an employer’s payroll.
In 2019, the Czech Republic relied the most on social insurance taxes at 44.3 percent, followed by the Slovak Republic (at 43.1 percent), Slovenia (42 percent), and Japan (40.2 percent) (Figure 3 and Table 1, below).
Denmark raised the least, at 0.1 percent, because social programs in Denmark are mostly funded from taxes other than dedicated social insurance taxes. Australia and New Zealand are the only countries that do not levy specific social insurance taxes on workers to fund government programs.
Individual Income Taxes
Income taxes are levied directly on an individual’s income, beginning with wage income. Many nations also levy their individual income taxAn individual income tax (or personal income tax) is levied on the wages, salaries, investments, or other forms of income an individual or household earns. The U.S. imposes a progressive income tax where rates increase with income. The Federal Income Tax was established in 1913 with the ratification of the 16th Amendment. Though barely 100 years old, individual income taxes are the largest source on investment income such as capital gains, dividends, interest, and business income. These taxes are typically levied in a progressive manner, meaning that an individual’s average tax rate increases as income increases.
The country with the highest reliance on individual income taxes in 2019 was Denmark (52.4 percent), followed by the United States (41.5 percent) and Australia (41.1 percent) (Figure 3 and Table 1, below).
Colombia (6.2 percent), Chile (7.2 percent), the Slovak Republic (10.9 percent), and the Czech Republic (12.6 percent) relied the least on individual income taxes.
Corporate Income Taxes
The corporate income tax is a direct taxA direct tax is levied on individuals and organizations and is not expected to be passed on to another payer (unlike indirect taxes such as sales and excise taxes), though economic incidence can still fall upon others. Often with a direct tax, such as the individual income tax, tax rates increase as the taxpayer’s ability to pay, or financial resources, increases, resulting in what is called a p on corporate profits. All OECD countries levy a tax on corporate profits. However, countries differ substantially in how they define taxable income and the rate at which they apply the tax. Generally, the corporate income tax raises little revenue compared to other sources.
Colombia relied the most on its corporate income tax, at 24.5 percent of total tax revenue. Chile (23.4 percent), Mexico (21.3 percent) and Australia (19.1 percent) also relied heavily on their corporate income tax compared to the OECD average of 9.6 percent (Figure 3 and Table 1, below).
In 2019, Latvia (0.5 percent), Hungary (2 percent), United States (3.9 percent) and Italy (4.6 percent) relied the least on the corporate income tax.
Property Taxes
A much smaller source of tax revenue for most OECD countries is the property tax. The property tax is levied on the value of an individual’s or business’ property. Other types of property taxes include estate, gift, and inheritance taxes, and net wealth taxes.
The United Kingdom relied the most on property taxes in the OECD (12.4 percent), followed by the United States (12.1 percent) and Canada (11.6 percent) (Figure 3 and Table 1, below).
Estonia relied the least on property taxes, raising only 0.6 percent of total revenue. Lithuania (1 percent), the Czech Republic and Slovak Republic (both at 1.2 percent), and Austria (1.3 percent) also relied very little on property taxes.
Sources of OECD Tax Revenue by Region
When looking at the sources of tax revenue by region, including non-OECD countries, there is a lot of variation, reflecting economic and social differences across regions.
In 2019, consumption taxes were Africa’s main source of tax revenue, accounting for 51.9 percent of its total tax revenue, above the OECD average of 32.3 percent. Africa also relied more on corporate income taxes and other taxes than the OECD average. Africa’s share of social insurance taxes and individual taxes was far below the OECD averages for these two sources of revenue.
Asia’s main sources of tax revenue in 2019 were consumption taxes and corporate income taxes. These sources’ share in the revenue mix is above the OECD average. On the other hand, Asia collected only 13.6 percent of its total revenue from individual income taxes and 12 percent from social insurance taxes, both below the OECD average. Asia’s share of property taxes in the revenue mix is similar to the OECD average (Figure 4 and Table 2, below).
Europe’s distribution of revenue sources is similar to the OECD average distribution, partly due to many European countries being part of the OECD. Nevertheless, compared to the OECD average, Europe relied more on social insurance taxes.
In 2019, consumption taxes were North America’s main source of tax revenue, in spite of the United States’ low share. North American countries also rely more on corporate income taxes and other taxes than the OECD average. On the other hand, North America relied less on individual income taxes, social insurance taxes, and property taxes than the OECD average.
Consumption taxes accounted for 56.1 percent of Oceania’s tax revenue, compared to an OECD average of approximately one-third, making consumption taxes the region’s most important revenue source. At the same time, Oceania relied more on corporate income taxes and on other taxes than the OECD average. Also, its share of individual income taxes is similar to the OECD average; there are no social insurance taxes collected in these countries.
South America’s share of consumption taxes is also above the OECD average, at 48.5 percent. At the same time, South American countries relied more on corporate income taxes and other taxes than the OECD average. On the other hand, South America relied less on individual income taxes, at 7.3 percent, compared to an OECD average of almost one-fourth of total revenue. It also relied less on social insurance taxes than the OECD average.
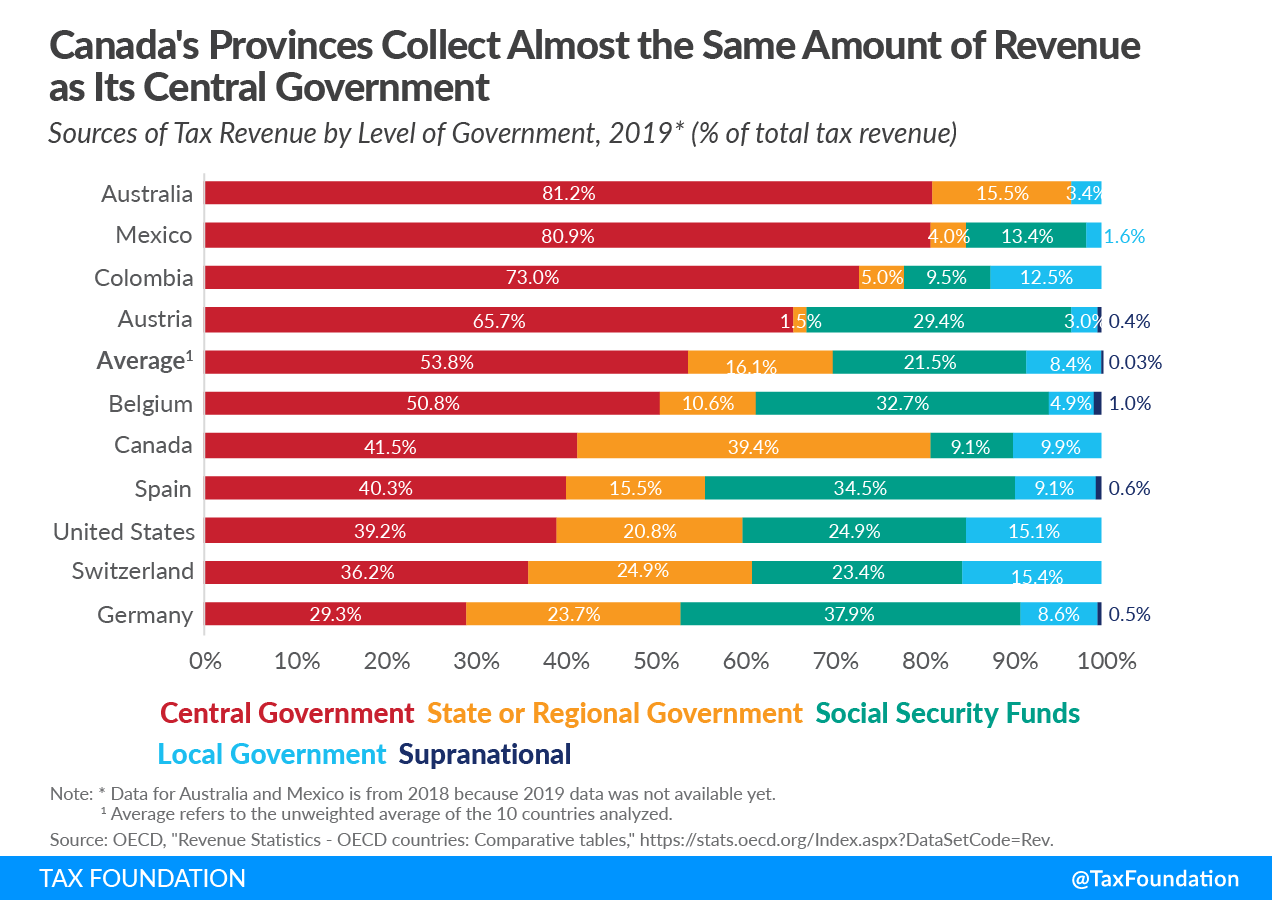
Sources of OECD Tax Revenue by Level of Government
OECD countries have different levels of governments at which taxes are collected. In general, revenue is collected by the central or federal government, the local government, and by social security funds. Eight out of 37 OECD countries have a federal structure and two OECD countries, Colombia and Spain, have a highly decentralized political structure, which allows them to collect taxes at the regional or state level.
On average, among the 10 countries analyzed, central governments collected 53.8 percent of total revenues in 2019. Social security funds, usually managed by the central government, collected the second-highest share of revenues, on average, at 21.5 percent. State or regional governments collected, on average, 16.1 percent, local government accounted for 8.4 percent and the supranational[6] level of government accounted, on average, for 0.03 percent of the total revenue.[7]
Central or Federal Government
In 2019, more than 50 percent of the total revenue was raised by the central government in Australia (81.2 percent), Mexico (80.9 percent) Colombia (73 percent), Austria (65.7 percent), and Belgium (50.8 percent). On the other hand, the central or federal government in Germany and Switzerland accounted only for 29.3 percent and 36.2 percent of total tax receipts.
State or Regional Government
State or regional governments collected the highest share of total revenue in Canada, where provinces collected 39.4 percent of the total revenue. State or regional governments also collected 25 percent of the total tax revenue in Switzerland, 23.7 percent in Germany, and 20.8 percent in the United States. The smallest shares of state or regional government collections of the total tax receipts were registered in Austria (1.5 percent), Mexico (4 percent), and Colombia (5 percent).
Local Government
Local governments collected 15.4 percent of total revenues in Switzerland, 15.1 percent in the United States, and 12.5 percent in Colombia. On the other hand, local governments in Mexico, Austria, and Australia collected the smallest share of tax revenues at 1.6 percent, 3 percent, and 3.4 percent, respectively.
Social Security Funds
In 2019, social security funds in Germany collected 37.9 percent of the total tax revenue, more than the 29.3 percent collected by the central government or the 23.7 percent collected by the state governments. Spain and Belgium also collected a big share of their tax revenue through social security funds, 34.5 percent and 32.7 percent of the total tax revenue. On the other hand, Canada and Colombia rely less on social security funds as they represent 9.1 percent and 9.5 percent of the total tax revenue, while Australia doesn’t levy specific social insurance taxes.
Conclusion
In general, OECD countries lean more on tax revenue from consumption taxes, social insurance taxes, and individual income taxes than on corporate income taxes and property taxes.
When looking at both OECD and non-OECD countries by region, Asia, Africa, and South America rely more on consumption taxes and corporate income taxes and less on income and social insurance taxes compared to the OECD average. On average, OECD and non-OECD countries in North America rely more on corporate income taxes and “other taxes” than the OECD average and less on social insurance and individual taxes. On the other hand, Oceania doesn’t rely at all on social insurance taxes, while consumption taxes are the region’s most important revenue source.
Compared to 1990, OECD countries have on average become more reliant on consumption taxes and less reliant on individual income taxes. These policy changes matter, considering that consumption-based taxes raise revenue with less distortionary effects than taxes on income.
In 2019, 10 OECD countries also collected taxes at the state or regional government level and six of them raised more than 15 percent of their tax revenue at this level of government.
Taxes make more sense with us in your inbox.
Subscribe to our newsletter for tax insights that cut through the noise—and make sense of it.
Sign UpAppendix
| Individual Tax Revenue | Corporate Tax Revenue | Social Insurance Tax Revenue | Property Tax Revenue | Consumption Tax Revenue | Other Tax Revenue | |
|---|---|---|---|---|---|---|
| Australia (a) | 41.1 % | 19.1 % | 0.0 % | 9.5 % | 25.5 % | 4.8 % |
| Austria | 22.6 % | 6.4 % | 34.9 % | 1.3 % | 27.5 % | 7.3 % |
| Belgium | 26.6 % | 8.7 % | 31.0 % | 8.1 % | 25.7 % | 0.0 % |
| Canada | 36.6 % | 11.2 % | 14.0 % | 11.6 % | 22.9 % | 3.7 % |
| Chile | 7.2 % | 23.4 % | 7.3 % | 5.4 % | 53.1 % | 3.6 % |
| Colombia | 6.2 % | 24.5 % | 9.5 % | 9.1 % | 42.9 % | 7.8 % |
| Czech Republic | 12.6 % | 9.9 % | 44.3 % | 1.2 % | 32.0 % | 0.0 % |
| Denmark | 52.4 % | 6.5 % | 0.1 % | 4.1 % | 30.5 % | 6.4 % |
| Estonia | 16.5 % | 5.5 % | 35.0 % | 0.6 % | 42.4 % | 0.0 % |
| Finland | 29.0 % | 6.0 % | 27.9 % | 3.4 % | 33.7 % | 0.0 % |
| France | 21.1 % | 4.9 % | 32.8 % | 8.9 % | 27.1 % | 5.2 % |
| Germany | 27.4 % | 5.2 % | 37.9 % | 2.8 % | 26.7 % | 0.0 % |
| Greece (b) | 15.0 % | 5.4 % | 30.8 % | 8.1 % | 39.6 % | 1.2 % |
| Hungary | 14.5 % | 2.0 % | 32.5 % | 2.7 % | 45.3 % | 3.0 % |
| Iceland | 40.8 % | 5.9 % | 9.2 % | 5.9 % | 32.7 % | 5.5 % |
| Ireland | 31.5 % | 13.8 % | 17.5 % | 5.6 % | 30.6 % | 1.0 % |
| Israel | 21.0 % | 10.1 % | 17.4 % | 10.1 % | 35.9 % | 5.6 % |
| Italy | 25.7 % | 4.6 % | 31.2 % | 5.8 % | 28.4 % | 4.3 % |
| Japan (a) | 19.1 % | 12.9 % | 40.2 % | 8.1 % | 19.5 % | 0.3 % |
| Korea | 17.5 % | 15.7 % | 26.7 % | 11.4 % | 25.8 % | 2.8 % |
| Latvia | 20.8 % | 0.5 % | 30.6 % | 3.0 % | 45.1 % | 0.0 % |
| Lithuania | 23.4 % | 5.2 % | 32.0 % | 1.0 % | 38.4 % | 0.0 % |
| Luxembourg | 23.8 % | 15.1 % | 27.5 % | 9.7 % | 23.9 % | 0.1 % |
| Mexico (a) | 21.2 % | 21.3 % | 13.4 % | 2.0 % | 36.4 % | 5.7 % |
| Netherlands | 21.6 % | 9.4 % | 34.3 % | 3.7 % | 30.7 % | 0.3 % |
| New Zealand | 39.6 % | 12.4 % | 0.0 % | 6.2 % | 38.9 % | 2.9 % |
| Norway | 26.1 % | 14.4 % | 26.6 % | 3.2 % | 29.5 % | 0.1 % |
| Poland | 15.1 % | 6.3 % | 37.6 % | 3.6 % | 24.1 % | 13.3 % |
| Portugal | 18.4 % | 9.0 % | 27.9 % | 4.0 % | 40.1 % | 0.8 % |
| Slovak Republic | 10.9 % | 8.9 % | 43.1 % | 1.2 % | 35.1 % | 0.8 % |
| Slovenia | 14.3 % | 5.6 % | 42.0 % | 1.7 % | 36.3 % | 0.1 % |
| Spain | 22.7 % | 6.0 % | 35.4 % | 7.0 % | 28.9 % | 0.0 % |
| Sweden | 28.5 % | 6.7 % | 21.5 % | 2.2 % | 28.3 % | 12.8 % |
| Switzerland | 30.7 % | 11.5 % | 23.4 % | 7.3 % | 21.0 % | 6.2 % |
| Turkey | 16.3 % | 7.9 % | 31.4 % | 4.2 % | 39.0 % | 1.2 % |
| United Kingdom | 27.6 % | 7.6 % | 19.5 % | 12.4 % | 32.6 % | 0.4 % |
| United States | 41.5 % | 3.9 % | 24.9 % | 12.1 % | 17.6 % | 0.0 % |
| OECD Simple Average | 24.0 % | 9.6 % | 25.7 % | 5.6 % | 32.3 % | 2.9 % |
|
(a) Data for Australia, Japan, and Mexico is from 2018 because 2019 data was not available yet. (b) For Greece, only the aggregate Taxes on Income, Profits, and Capital Gains was available for the year 2019. To split this aggregate into the three subcategories of Individual Income Taxes, Corporate Income Taxes, and Other Income Taxes, each subcategory’s average share of the three years prior (2016-2018) was used to weigh it. Individual Taxes covers the OECD category 1100 Taxes on income, profits, and capital gains of individuals. Corporate Taxes covers the OECD category 1200 Taxes on income, profits, and capital gains of corporates. Social Insurance Taxes covers the OECD category 2000 social security contributions (SSC). Property Taxes covers the OECD category 4000 Taxes on property. Consumption Taxes covers the OECD category 5000 Taxes on goods and services. “Other” covers the OECD categories 1300 Unallocable between 1100 and 1200, 3000 Taxes on payroll and workforce, and 6000 Taxes other than 1000, 2000, 3000, 4000, and 5000. Source: OECD, “Revenue Statistics – OECD countries: Comparative tables,” https://stats.oecd.org/Index.aspx?DataSetCode=Rev. |
||||||
| Region or Group | Individual Taxes | Corporate Taxes | Social Insurance Taxes | Property Taxes | Consumption Taxes | Other | Number of Countries Covered |
|---|---|---|---|---|---|---|---|
| OECD | 24.0% | 9.6% | 25.7% | 5.6% | 32.3% | 2.9% | 37 |
| Europe | 23.0% | 7.8% | 29.5% | 4.4% | 32.7% | 2.5% | 29 |
| Asia | 13.6% | 25.8% | 12.0% | 5.0% | 38.9% | 4.7% | 11 |
| North America | 14.2% | 13.9% | 16.5% | 4.1% | 47.5% | 6.4% | 17 |
| Africa | 17.5% | 19.2% | 7.2% | 1.6% | 51.9% | 5.2% | 30 |
| South America | 7.3% | 15.9% | 18.6% | 4.4% | 48.5% | 5.3% | 10 |
| Oceania | 24.4% | 13.0% | 0.0% | 2.4% | 56.1% | 7.8% | 10 |
|
* Data for Australia, Japan, Mexico and non-OECD countries is from 2018 because 2019 data was not available yet. Source: OECD “Global Revenue Statistics Database,” https://stats.oecd.org/Index.aspx?DataSetCode=RS_GBL, and OECD, “Revenue Statistics – OECD countries: Comparative tables,” https://stats.oecd.org/Index.aspx?DataSetCode=Rev. |
|||||||
[1] EY, “Global Oil and Gas TaxA gas tax is commonly used to describe the variety of taxes levied on gasoline at both the federal and state levels, to provide funds for highway repair and maintenance, as well as for other government infrastructure projects. These taxes are levied in a few ways, including per-gallon excise taxes, excise taxes imposed on wholesalers, and general sales taxes that apply to the purchase of gasoline. Guide 2019, Norway,” https://www.ey.com/en_gl/tax-guides/global-oil-and-gas-tax-guide-2019.
[2] OECD, “Revenue Statistics – OECD countries: Comparative tables,” https://stats.oecd.org/Index.aspx?DataSetCode=Rev.
[3] All averages in this report are simple averages, not weighted averages.
[4] Daniel Bunn and Elke Asen, “Higher Corporate Tax Revenues Globally Despite Lower Tax Rates,” Tax Foundation, Jan. 22, 2019, https://taxfoundation.org/higher-corporate-tax-revenues-lower-tax-rates/.
[5] Janelle Cammenga, “State and Local Sales Tax Rates, 2021,” Tax Foundation, Jan. 6, 2021, https://taxfoundation.org/2021-sales-taxes/.
[6] The only tax-collecting supranational authority in the OECD area is the European Union (EU). Customs duties collected by EU member states on behalf of the EU are reported at this level.
[7] Only four of the countries analyzed are also European Union member states and therefore subject to a supranational authority.
Share this article