Key Findings
-
A typical American household with four wireless phones paying $100 per month for taxable wireless service can expect to pay about $229 per year in wireless taxes, fees, and surcharges—up from $221 in 2017.
-
Nationally, these impositions make up about 19.1 percent of the average customer’s bill—the highest rate ever. Illinois now has the highest wireless taxes in the country at 27.6%, followed by Alaska at 26.1%, Washington at 26.1%, Nebraska at 25.5%, and New York at 25.2%.
-
Since 2008, average monthly wireless service bills per subscriber have dropped from just under $50 per-line per month to $38.66 per month—a 23 percent reduction. However, wireless taxes have increased from 15.1 percent to 19.1 percent of the average bill—a 27 percent increase.
-
Most states impose higher taxes, fees, and surcharges on wireless service than on other taxable goods and services. In Alaska, which has no state sales tax but allows local sales taxes, wireless taxes are nearly eight times higher than local sales taxes. Other states with significantly higher wireless taxes include Nebraska (2.6 times higher), Pennsylvania (2.3 times higher), Maryland (2.3 times higher) and Illinois (2.2 times higher).
-
At the end of 2017, over 68 percent of poor adults had only wireless for their phone service, and 53 percent of all adults were wireless only. Excessive taxes and fees, especially the very high per line charges like those imposed in Chicago and Baltimore, impose a disproportionate burden on low-income consumers. In Chicago, taxes on a family with four lines of taxable wireless service paying $100 per month are nearly $500 per year—over 40 percent of the bill.
Executive Summary
Taxes, fees, and governmental surcharges on wireless consumers increased in 2018, jumping from 18.5 percent to 19.1 percent of the customer’s bill. An American household with four wireless phones paying $100 per month for wireless voice service can expect to pay about $229 per year in wireless taxes, fees, and surcharges—up from $221 in 2017.
State and local wireless taxes increased from 12.1% to 12.5%, the fifth consecutive increase. The Federal Universal Service Fund surcharge (FUSF) increased from 6.3 percent to 6.6 percent of the typical wireless bill.
Fortunately for wireless consumers, intense price competition produced a large reduction in the average monthly per-line cost of wireless service. Average revenue per subscriber fell dramatically for the second year in a row, from $41.50 per month in 2017 to $38.66 per month in 2018. Unfortunately, consumers were not able to fully enjoy this price reduction because taxes, fees, and surcharges continue to remain stubbornly high.
Wireless consumers will pay an estimated $16.1 billion in taxes, fees, and government surcharges to federal, state, and local governments in 2018 based on the taxA tax is a mandatory payment or charge collected by local, state, and national governments from individuals or businesses to cover the costs of general government services, goods, and activities. rates calculated in this report. These taxes, fees, and surcharges break down as follows:
- $6.1 billion in sales taxes and other nondiscriminatory consumption taxes
- $4.9 billion in federal Universal Service Fund surcharges
- $2.8 billion in 911 fees, a category that includes hundreds of millions of dollars that are not actually used for 911 purposes.
- $2.2 billion in other industry-specific state and local taxes and fees.
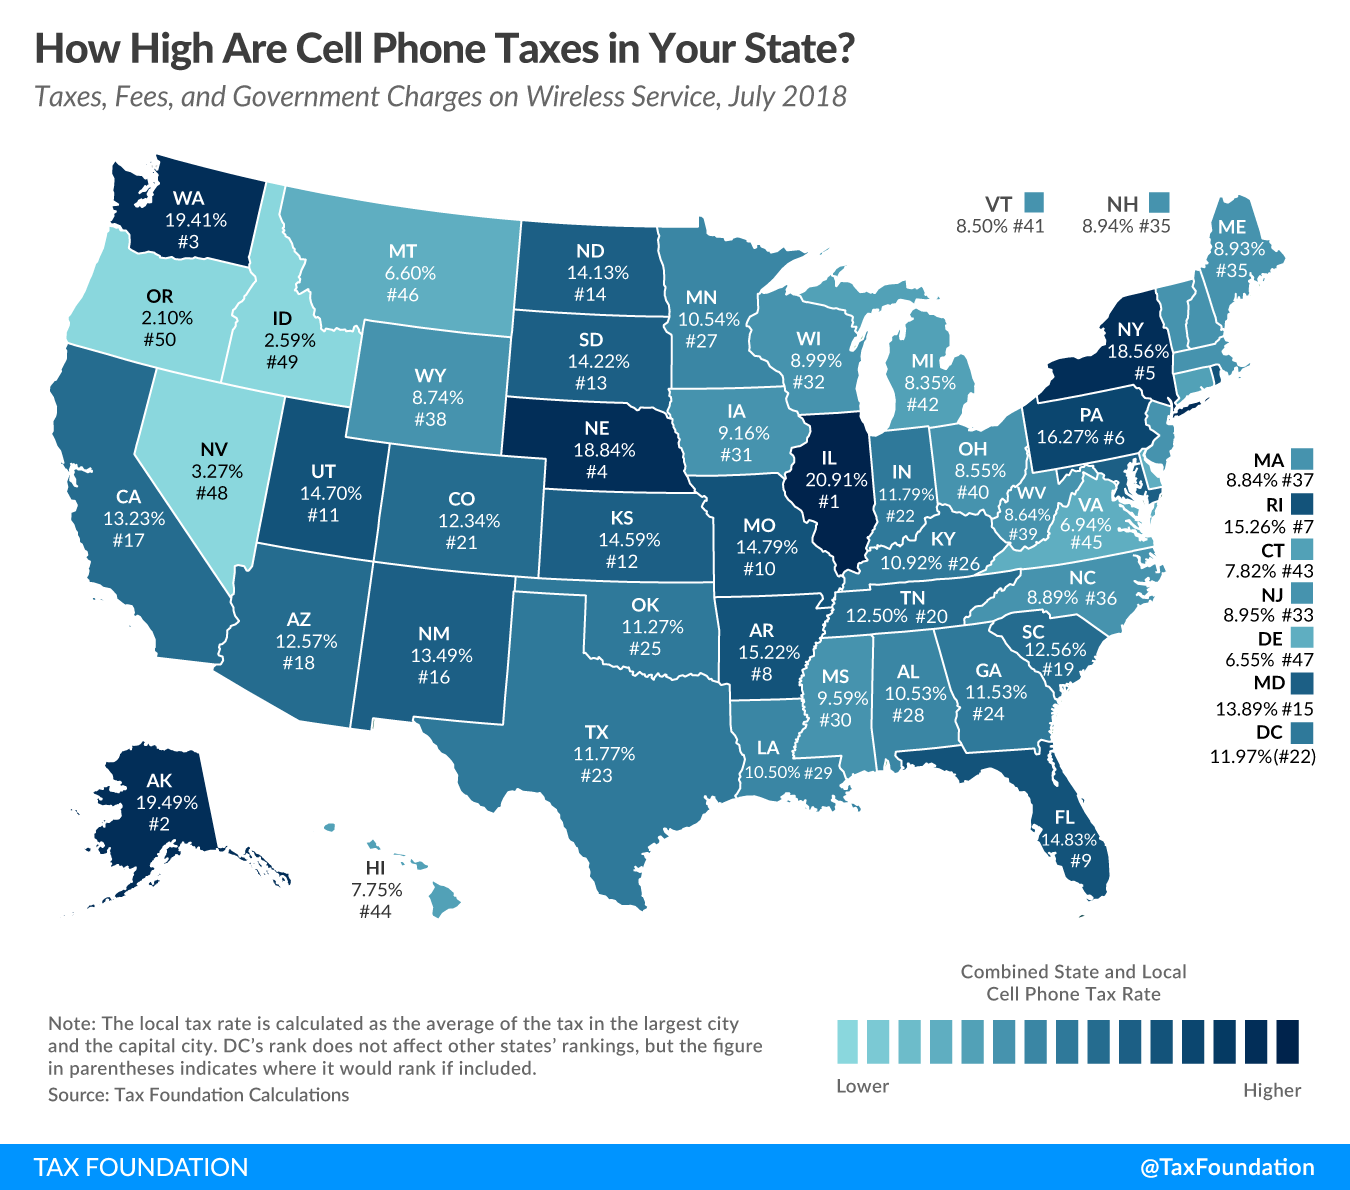
Consumers in Illinois, Alaska, Washington, and Nebraska pay the highest wireless taxes in the country, while wireless users in Oregon, Idaho, and Nevada pay the lowest wireless taxes.
Wireless service is increasingly the sole means of communications and connectivity for many Americans, particularly young people and those with lower incomes. At the end of 2017, according to the Centers for Disease Control, about 68 percent of all poor adults lived in wireless-only households and 53 percent of all adults of all incomes lived in wireless-only households.[1] These excessive taxes and fees–especially those that impose high per-line taxes and fees–impose a disproportionate tax burden on those least able to afford them.
Wireless Taxes and Fees Increase in 2018
This is the ninth in a series of reports that examines trends in taxes, fees, and government surcharges imposed on wireless service by federal, state, and local governments since 2003. The methodology for the report, which was originally developed by the Committee on State Taxation in a 1999 report, is detailed in Appendix A.
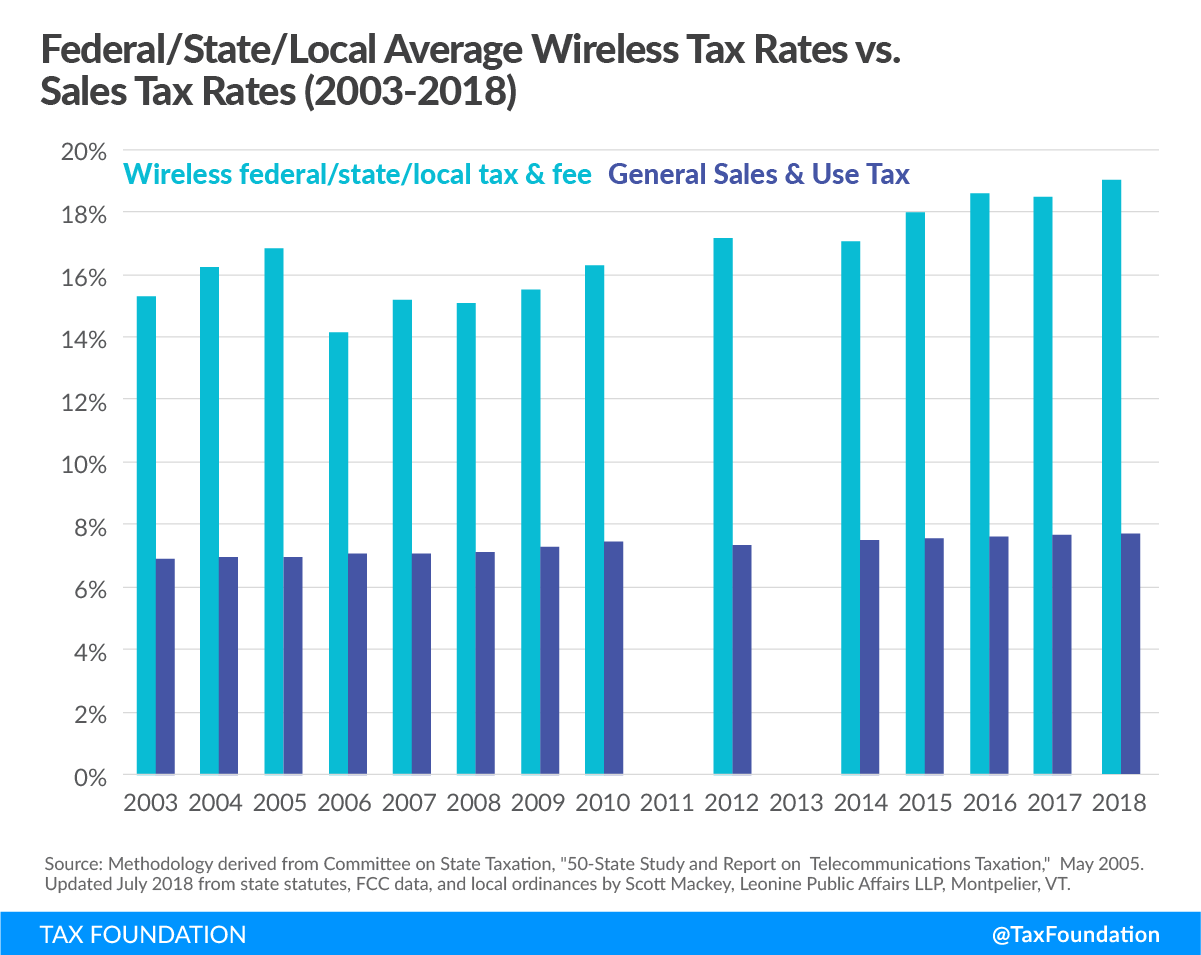
Table 1 shows national trends in tax rates imposed by all levels of government on taxable wireless service between 2003 and 2018. Between 2005 and 2006, wireless taxes dropped after the federal courts forced the IRS to end the imposition of the 3% federal excise tax on wireless service. After that court decision, wireless tax rates dropped to a low of 14.1%. Since then, however, wireless tax rates have climbed steadily to their current rate of 19.1%.
| Note: Federal includes 3% federal excise tax (until 5/2006) and federal universal service fund charge, which is set by the FCC and varies quarterly: Federal USF 7/1/2018 — 37.1% Interstate safe harbor x 17.9% contribution factor = 6.34% effective tax rate http://www.usac.org/cont/tools/contribution-factors.aspx Source: Methodology derived from Committee on State Taxation, “50-State Study and Report on Telecommunications Taxation,” May 2005. Updated July 2018 from state statutes, FCC data, and local ordinances by Scott Mackey, Leonine Public Affairs LLP, Montpelier, VT. | |||||
| Weighted Average | |||||
|---|---|---|---|---|---|
| Wireless: State & Local tax & fee | Wireless: Federal tax & fee | Wireless: Federal/State/Local tax & fee | General Sales/Use Tax | Disparity — Wireless Tax Over General Sales Tax | |
| 1/1/2003 | 10.20% | 5.07% | 15.27% | 6.87% | 3.33% |
| 4/1/2004 | 10.74% | 5.48% | 16.22% | 6.93% | 3.81% |
| 7/1/2005 | 10.94% | 5.91% | 16.85% | 6.94% | 4.00% |
| 7/1/2006 | 11.14% | 2.99% | 14.13% | 7.04% | 4.10% |
| 7/1/2007 | 11.00% | 4.19% | 15.19% | 7.07% | 3.93% |
| 7/1/2008 | 10.86% | 4.23% | 15.09% | 7.11% | 3.75% |
| 7/1/2009 | 10.74% | 4.79% | 15.53% | 7.26% | 3.48% |
| 7/1/2010 | 11.21% | 5.05% | 16.26% | 7.42% | 3.79% |
| 7/1/2012 | 11.36% | 5.82% | 17.18% | 7.33% | 4.03% |
| 7/1/2014 | 11.23% | 5.82% | 17.05% | 7.51% | 3.72% |
| 7/1/2015 | 11.50% | 6.46% | 17.96% | 7.57% | 3.93% |
| 7/1/2016 | 11.93% | 6.64% | 18.57% | 7.61% | 4.32% |
| 7/1/2017 | 12.11% | 6.34% | 18.46% | 7.65% | 4.46% |
| 7/1/2018 | 12.46% | 6.64% | 19.10% | 7.65% | 4.81% |
Table 1 also separates the impact of federal taxes and surcharges from state and local government taxes, fees, and surcharges. Throughout the period, state and local taxes have been trending upward steadily, from 10.2% in 2003 to their current level of 12.5% in 2018. The FUSF surcharge has also increased throughout the period. For a detailed explanation of the FUSF and how it is imposed, see Appendix B.
Table 1 also shows the general trends in average tax rates of the sales and use tax, which is the primary broad-based consumption tax imposed by 45 states, the District of Columbia, and Puerto Rico. Since 2003, the average state-local sales taxA sales tax is levied on retail sales of goods and services and, ideally, should apply to all final consumption with few exemptions. Many governments exempt goods like groceries; base broadening, such as including groceries, could keep rates lower. A sales tax should exempt business-to-business transactions which, when taxed, cause tax pyramiding. rate has increased by about 0.8 percentage points—from 6.87% to 7.65%. During that same period, wireless taxes increased by 2.3 percentage points—from 10.2% to 12.5%. Average wireless tax rates increased nearly three times faster than average sales tax rates.
Wireless industry competition has led to significant reductions in average monthly bills since 2008, a trend that accelerated dramatically in 2017 and 2018, when average bills dropped from $44.65 per month in 2016 to $38.66 per month in 2018. Since 2008, average wireless monthly bills have dropped from just under $50 per month to $38.66 per month–a 23 percent reduction–while wireless taxes have increased from 15.1% to 19.1%—a 27 percent increase. Unfortunately, consumers have not enjoyed the full benefits of wireless price competition because taxes, fees, and government surcharges continue to increase.
Figure 1.
Taxes make more sense with us in your inbox.
Subscribe to our newsletter for tax insights that cut through the noise—and make sense of it.
Sign UpTable 2 shows wireless tax, fee, and government surcharge rates as of July 2018. Column 1 shows the average combined state-local tax rate in the largest city and the capital city in each state, while column 2 shows the effective rate of the FUSF surcharge. In 2018, due to a large increase in 911 fees in Chicago and statewide, Illinois surpassed Washington state with the highest wireless tax rates in the country at 27.55%, followed by Alaska at 26.13%. Alaska’s state universal service fund surcharge has increased dramatically in the last few years, vaulting Alaska into its position as the second highest wireless tax state. Just two years ago, Alaska was not even in the top 10.
|
Source: Methodology from COST, “50-State Study and Report on Telecommunications Taxation,” May 2005. Updated July 2018 using state statutes, FCC data, and local ordinances. |
||||
| 2018 Wireless State-Local Rate | 2018 Federal USF Rate | 2018 Combined Federal/State/Local Rate | ||
|---|---|---|---|---|
| 1 | Illinois | 20.91% | 6.64% | 27.55% |
| 2 | Alaska | 19.49% | 6.64% | 26.13% |
| 3 | Washington | 19.41% | 6.64% | 26.05% |
| 4 | Nebraska | 18.84% | 6.64% | 25.48% |
| 5 | New York | 18.56% | 6.64% | 25.20% |
| 6 | Pennsylvania | 16.27% | 6.64% | 22.91% |
| 7 | Rhode Island | 15.26% | 6.64% | 21.90% |
| 8 | Arkansas | 15.22% | 6.64% | 21.86% |
| 9 | Florida | 14.83% | 6.64% | 21.47% |
| 10 | Missouri | 14.79% | 6.64% | 21.43% |
| 11 | Utah | 14.70% | 6.64% | 21.34% |
| 12 | Kansas | 14.59% | 6.64% | 21.23% |
| 13 | South Dakota | 14.22% | 6.64% | 20.86% |
| 14 | North Dakota | 14.13% | 6.64% | 20.77% |
| 15 | Maryland | 13.89% | 6.64% | 20.53% |
| 16 | Puerto Rico | 13.67% | 6.64% | 20.31% |
| 17 | New Mexico | 13.49% | 6.64% | 20.13% |
| 18 | California | 13.23% | 6.64% | 19.87% |
| 19 | Arizona | 12.57% | 6.64% | 19.21% |
| 20 | South Carolina | 12.56% | 6.64% | 19.20% |
| 21 | Tennessee | 12.50% | 6.64% | 19.14% |
| 22 | Colorado | 12.34% | 6.64% | 18.98% |
| 23 | District of Columbia | 11.97% | 6.64% | 18.61% |
| 24 | Indiana | 11.79% | 6.64% | 18.43% |
| 25 | Texas | 11.77% | 6.64% | 18.41% |
| 26 | Georgia | 11.53% | 6.64% | 18.17% |
| 27 | Oklahoma | 11.27% | 6.64% | 17.91% |
| 28 | Kentucky | 10.92% | 6.64% | 17.56% |
| 29 | Minnesota | 10.54% | 6.64% | 17.18% |
| 30 | Alabama | 10.53% | 6.64% | 17.17% |
| 31 | Louisiana | 10.50% | 6.64% | 17.14% |
| 32 | Mississippi | 9.59% | 6.64% | 16.23% |
| 33 | Iowa | 9.16% | 6.64% | 15.80% |
| 34 | Wisconsin | 8.99% | 6.64% | 15.63% |
| 35 | New Jersey | 8.95% | 6.64% | 15.59% |
| 36 | New Hampshire | 8.94% | 6.64% | 15.58% |
| 37 | Maine | 8.93% | 6.64% | 15.57% |
| 38 | North Carolina | 8.89% | 6.64% | 15.53% |
| 39 | Massachusetts | 8.84% | 6.64% | 15.48% |
| 40 | Wyoming | 8.74% | 6.64% | 15.38% |
| 41 | West Virginia | 8.64% | 6.64% | 15.28% |
| 42 | Ohio | 8.55% | 6.64% | 15.19% |
| 43 | Vermont | 8.50% | 6.64% | 15.14% |
| 44 | Michigan | 8.35% | 6.64% | 14.99% |
| 45 | Connecticut | 7.82% | 6.64% | 14.46% |
| 46 | Hawaii | 7.75% | 6.64% | 14.39% |
| 47 | Virginia | 6.94% | 6.64% | 13.58% |
| 48 | Montana | 6.60% | 6.64% | 13.24% |
| 49 | Delaware | 6.55% | 6.64% | 13.19% |
| 50 | Nevada | 3.27% | 6.64% | 9.91% |
| 51 | Idaho | 2.59% | 6.64% | 9.23% |
| 52 | Oregon | 2.10% | 6.64% | 8.74% |
| Weighted Avg. | 12.46% | 6.64% | 19.10% | |
| Simple Avg. | 11.44% | 6.64% | 18.08% | |
Figure 2 maps the states by average state-local rates, without including the FUSF imposition. Other than the cluster of low-tax states in the western United States, there does not appear to be any strong regional patterns to the distribution of high-tax and low-tax states. The New England states tend to have lower wireless tax rates, while the high-tax states are scattered throughout the country.
Figure 2.
Taxes make more sense with us in your inbox.
Subscribe to our newsletter for tax insights that cut through the noise—and make sense of it.
Sign UpOne of the longstanding arguments for reform of wireless taxation is the disparity in tax burdens on wireless as compared to broad-based consumption taxes imposed on other goods and taxable services subject to sales and use taxes. Wireless and other telecommunications are one of the few services that are consistently subject to sales and use taxes by states with both narrow and broad sales tax bases. Furthermore, states like Delaware, Montana, and New Hampshire that do not impose a sales tax have specific taxes on wireless and other communications services.
Table 3 ranks the states by comparing the disparity between the tax rates imposed on wireless service to the combined state and local sales tax rate in each state. Alaska leads all states in this regard, imposing wireless taxes that are nearly eight times higher than average sales tax rates—19.5% vs 2.5%. Other states with large disparities include Nebraska, Illinois, New York, Washington, and Pennsylvania. New Hampshire, Delaware, and Montana–all states that do not have general sales taxes but impose taxes on wireless service–rank relatively high on the disparity index even though their overall wireless tax rates are relatively low by national standards. Table 3 also shows that two states–Idaho and Nevada–impose lower taxes on wireless service than on other goods and services subject to the sales tax.
Total Taxes Paid
Wireless consumers pay about $9.9 billion in taxes and fees that are specifically levied on telecommunications services but not on other taxable goods and services. This total includes approximately $4.9 billion in FUSF charges, $2.8 billion in 911 fees, and another $2.2 billion in other discriminatory state and local taxes, fees, and government surcharges. The remaining $6.1 billion in taxes on wireless service are nondiscriminatory sales and use taxes that are imposed on other taxable goods and services.[2]
Appendix C provides a detailed breakdown of the specific taxes, fees, and government surcharges imposed in each state, including the respective rates of each. To facilitate interstate comparisons, local rates imposed in the most populated city and the capital city in each state are averaged into a single rate. In the case of taxes and fees that are imposed on a flat per-line basis–for example, $1.00 per month per line–the tax is converted from a flat amount to a percentage by dividing the flat amount by the industry average revenue per line of $38.66 per month. For a detailed description of the methodology, please see Appendix A.
Trends in Wireless Taxes and Fees
911 Fees
Most states impose 911 fees to fund capital expenses associated with the 911 system, and in some states fees fund operations as well. Wireless 911 fees vary greatly by state, from a low of zero in Missouri[3] to a high of $3.34 per line in West Virginia. Most wireless 911 fees are levied at uniform rates statewide, although there are a few exceptions. In 2018, the state of Illinois increased the 911 fee from 87 cents per line per month to $1.50 per line per month except in the city of Chicago, where the fee was increased from $3.90 per line to $5.00 per line per month.
|
Source: Methodology from COST, “50-State Study and Report on Telecommunications Taxation,” May 2005. Updated July 2018 using state statutes, FCC data, and local ordinances. |
||||
| State-Local Sales Tax Rate | State-Local Wireless Tax Rate | Wireless Over/Under Sales Tax Rate | Disparity Multiple | |
|---|---|---|---|---|
| Alaska | 2.50% | 19.49% | 16.99% | 7.80 |
| Nebraska | 7.13% | 18.84% | 11.71% | 2.64 |
| Illinois | 9.38% | 20.91% | 11.53% | 2.23 |
| New York | 8.44% | 18.56% | 10.12% | 2.20 |
| Washington | 9.45% | 19.41% | 9.96% | 2.05 |
| Pennsylvania | 7.00% | 16.27% | 9.27% | 2.32 |
| New Hampshire | 0.00% | 8.94% | 8.94% | NA |
| Rhode Island | 7.00% | 15.26% | 8.26% | 2.18 |
| Maryland | 6.00% | 13.89% | 7.89% | 2.31 |
| Utah | 6.85% | 14.70% | 7.85% | 2.15 |
| South Dakota | 6.50% | 14.22% | 7.72% | 2.19 |
| Florida | 7.13% | 14.83% | 7.71% | 2.08 |
| North Dakota | 7.00% | 14.13% | 7.13% | 2.02 |
| Montana | 0.00% | 6.60% | 6.60% | NA |
| Delaware | 0.00% | 6.55% | 6.55% | NA |
| Missouri | 8.29% | 14.79% | 6.50% | 1.78 |
| Kansas | 8.33% | 14.59% | 6.26% | 1.75 |
| District of Columbia | 5.75% | 11.97% | 6.22% | 2.08 |
| Arkansas | 9.38% | 15.22% | 5.85% | 1.62 |
| New Mexico | 7.91% | 13.49% | 5.58% | 1.71 |
| Kentucky | 6.00% | 10.92% | 4.92% | 1.82 |
| Indiana | 7.00% | 11.79% | 4.79% | 1.68 |
| California | 8.75% | 13.23% | 4.48% | 1.51 |
| Colorado | 7.95% | 12.34% | 4.39% | 1.55 |
| South Carolina | 8.50% | 12.56% | 4.06% | 1.48 |
| Arizona | 8.60% | 12.57% | 3.97% | 1.46 |
| Hawaii | 4.00% | 7.75% | 3.75% | 1.94 |
| Wyoming | 5.00% | 8.74% | 3.74% | 1.75 |
| Texas | 8.25% | 11.77% | 3.52% | 1.43 |
| Wisconsin | 5.55% | 8.99% | 3.44% | 1.62 |
| Maine | 5.50% | 8.93% | 3.43% | 1.62 |
| Tennessee | 9.25% | 12.50% | 3.25% | 1.35 |
| Georgia | 8.45% | 11.53% | 3.08% | 1.36 |
| Minnesota | 7.70% | 10.54% | 2.84% | 1.37 |
| Oklahoma | 8.45% | 11.27% | 2.82% | 1.33 |
| Iowa | 6.50% | 9.16% | 2.66% | 1.41 |
| Massachusetts | 6.25% | 8.84% | 2.59% | 1.41 |
| Michigan | 6.00% | 8.35% | 2.35% | 1.39 |
| Puerto Rico | 11.50% | 13.67% | 2.17% | 1.19 |
| Oregon | 0.00% | 2.10% | 2.10% | NA |
| Mississippi | 7.50% | 9.59% | 2.09% | 1.28 |
| New Jersey | 6.88% | 8.95% | 2.08% | 1.30 |
| Vermont | 6.50% | 8.50% | 2.00% | 1.31 |
| West Virginia | 7.00% | 8.64% | 1.64% | 1.23 |
| North Carolina | 7.25% | 8.89% | 1.64% | 1.23 |
| Connecticut | 6.35% | 7.82% | 1.47% | 1.23 |
| Virginia | 5.65% | 6.94% | 1.29% | 1.23 |
| Louisiana | 9.45% | 10.50% | 1.05% | 1.11 |
| Ohio | 7.75% | 8.55% | 0.80% | 1.10 |
| Alabama | 10.00% | 10.53% | 0.53% | 1.05 |
| Idaho | 6.00% | 2.59% | -3.41% | 0.43 |
| Nevada | 8.26% | 3.27% | -4.99% | 0.40 |
| US Weighted Average | 7.65% | 12.46% | 4.81% | 1.63 |
Other states where 911 fees increased in 2018 include Alaska, Michigan, Nevada, North Carolina, and Utah. Connecticut was the only state to reduce the 911 fee. Missouri enacted legislation in 2018 that permits local jurisdictions to impose a wireless 911 fee of up to $1.00 per month per line, if approved by the voters. Prior to passage of this legislation, Missouri was one of only two states in the country that did not impose state or local 911 fees on wireless service.
Unfortunately, according to the FCC, some states and localities routinely divert 911 fees for other purposes.[4] For example, the city of Chicago used the authority granted by the legislature to increase its 911 fee from $3.90 per line to $5.00 per line, effective January 1, 2018. Media reports suggested that the 911 fee increase was intended to cover a shortfall in city pension obligations.[5] Other states that routinely divert 911 fees paid by wireless consumers to other purposes include New Jersey, New Mexico, New York, Rhode Island, and West Virginia.
State Universal Service Funds
Some states have their own universal service funds (USF) that provide subsidies for many of the same purposes as the FUSF. State USF surcharges are imposed on intrastate revenues, while the FUSF is imposed on interstate revenues. In states like Alaska, Arkansas, California, Kansas, and Nebraska, high state USF surcharge rates add significantly to the overall burden on wireless consumers. For example, the USF rate in Alaska is 19.0 percent of all intrastate charges. In just two years, significant increases in the state USF rate propelled Alaska upward in the overall wireless tax rankings from 14th highest in 2015 to second highest in 2018. Appendix B lists the rates in all the 20 states with USF charges.
In 2018, state USF rates increased in Alaska, California, Indiana, Kansas, New Mexico, South Carolina, and Wyoming. Kentucky, Oklahoma, and Wisconsin lowered the rates of their state USF surcharges. Utah shifted its USF imposition from a percentage of intrastate revenue to a fixed amount per line, which on balance slightly reduced the effective rate of the USF on single-line plans.
State-Level Wireless Taxes
In addition to 911 fees and state USF charges, 14 states impose taxes on wireless service that are either in addition to state sales taxes or in lieu of sales taxes but imposed at a higher rate than the state sales tax. Table 4 below lists these states. No states increased or decreased these discriminatory state wireless taxes in 2018.
| State Gross Receipts Tax in Addition to Sales Tax | Higher State Tax Rate in Lieu of Sales Tax | Wireless Tax but No State Sales Tax |
|---|---|---|
| Indiana | District of Columbia | Delaware |
| Kentucky | Florida | Montana |
| New York | Illinois | New Hampshire |
| North Dakota | Maine | |
| Pennsylvania | ||
| Rhode Island | ||
| South Dakota |
Local Wireless Taxes
Many local governments also impose discriminatory taxes on wireless consumers. Many of these are legacy taxes that were established during the regulated telephone monopoly era that existed prior until the late 1980s. Local governments in some states have longstanding authority to impose “right-of-way” fees on telephone companies for placing poles, wires, and other landline infrastructure on public property. In other states, localities have the authority to impose franchise fees on telephone companies in exchange for an exclusive franchise agreement to provide service within the municipality.
In the late 1990s and early 2000s, when wireless service began to displace landline service, localities became concerned about losing revenues and sought to extend these legacy fees to wireless providers even though wireless providers did not receive the same benefits for which the fees were established. For example, a wireless provider does not receive the ability to access the public right-of-way to place equipment. Instead, wireless providers negotiate a rental agreement for the use of public property similar to agreements negotiated with private property owners. In addition, wireless providers must pay billions to purchase spectrum from the federal government through auctions held by the FCC.
Local governments in 12 states currently impose some type of tax or fee on wireless service over and above any broad-based local sales tax. In most of these states, the local wireless tax is in addition to state taxes. California is the exception—wireless service is not subject to sales taxes but is subject to local Utility User Taxes at rates as high as 11%. Table 5 provides a breakdown of the types of local wireless taxes.
| Privilege, License or User Taxes | State-Authorized Telecom Taxes | School District and Other Special District Taxes |
|---|---|---|
| Arizona | Florida | Kentucky |
| California | Illinois | New York |
| Maryland | Maryland | |
| Missouri | New York | |
| Nebraska | Utah | |
| Nevada | ||
| South Carolina | ||
| Washington |
Local government taxes have a significant impact on the overall tax burden on wireless consumers in many of the states that rank high in the overall wireless tax and fee burden. In most of the top 10 states shown on Table 2 with the highest wireless taxes, local taxes play a prominent role. Nebraska allows local business license taxes with rates as high as 6.25%. Washington allows municipal governments to impose “utility franchise taxes” with rates as high as 9%. New York allows New York City, other selected cities, school districts, and certain transit districts to levy various wireless taxes in addition to county 911 fees. Finally, Florida and Illinois have special state communications taxes with a local add-on that result in rates typically two times higher than the general sales tax rates.
Table 6 illustrates the impact of taxes and fees on consumers in selected large cities around the country. Wireless service is increasingly becoming the sole means of communication and connectivity for many Americans, particularly those struggling to overcome poverty. At the end of 2017, over 68 percent of all poor adults had only wireless service, and 53 percent of all adults were wireless only.[6] Excessive local taxes and fees, especially the very high per-line charges like those imposed in Chicago and Baltimore, impose a disproportionate burden on low-income consumers. In Chicago, taxes on a family with four lines of taxable wireless service paying $100 per month are nearly $500 per year—over 40 percent of the bill.
| City | Tax on 4-line voice plan at $100 per month | Effective Tax Rate |
|---|---|---|
| Chicago, IL | $40.64 | 40.64% |
| Baltimore, MD | $29.84 | 29.84% |
| New York, NY | $27.11 | 27.11% |
| Seattle, WA | $26.54 | 26.54% |
| Philadelphia, PA | $26.24 | 26.24% |
| Omaha, NE | $26.14 | 26.14% |
| Providence, RI | $23.68 | 23.68% |
| Tallahassee, FL | $22.58 | 22.58% |
| Kansas City, MO | $21.49 | 21.49% |
| Los Angeles, CA | $20.87 | 20.87% |
|
City |
Tax on Single Line Voice Plan Costing $38.66 per month |
Effective Tax Rate |
| Chicago, IL | $12.98 | 33.57% |
| Baltimore, MD | $9.94 | 25.70% |
| Omaha, NE | $9.85 | 25.48% |
| Seattle, WA | $9.74 | 25.20% |
| New York, NY | $9.66 | 24.99% |
| Philadelphia, PA | $9.24 | 23.91% |
| Tallahassee, FL | $8.51 | 22.01% |
| Providence, RI | $8.47 | 21.90% |
| Kansas City, MO | $8.31 | 21.49% |
| Los Angeles, CA | $8.07 | 20.87% |
The Impact of Excessive Wireless Taxes
The popularity of wireless service, and the explosive growth in the number of wireless subscribers, have led some to question whether wireless taxes matter to wireless consumers and the wireless industry. However, there are two compelling reasons why policymakers should be cautious about expanding wireless taxes, fees, and surcharges. First, as discussed above, wireless taxes and fees are regressive and have a disproportionate impact on poorer citizens. Excessive taxes and fees may reduce low-income consumer access to wireless service at a time when such access is critical to economic success. Second, discriminatory taxes may slow investment in wireless infrastructure. Ample evidence exists that investments in wireless networks provide economic benefits to the broader economy because so many sectors–transportation, health care, energy, education, even government–use wireless networks to boost productivity and efficiency.
Network investment is important not only to consumers and businesses that use these networks, but to the entire American economy. A report by the International Chamber of Commerce (ICC) in Paris surveyed the evidence not only from the United States and Europe but from the developing world as well.[7] Economists that have examined the link between investments in communications and information technology infrastructure and economic growth have consistently found a strong link. Simply put, wireless infrastructure investment enables an entire entrepreneurial culture to focus on creating applications and devices to make businesses more productive and to improve the lives of consumers. These tools in turn make businesses more productive and profitable so that they can create new jobs that generate economic activity and tax revenues for governments.
While most infrastructure investments create these types of multiplier effects, the multiplier effects for telecommunications infrastructure are higher than other industries because communications and information technology are so deeply embedded in business processes. These infrastructure investments also benefit the government and nonprofit sectors in ways that do not necessarily show up directly in economic statistics but nonetheless make these sectors more efficient and enable them to lower the cost of providing government services.
As noted in the ICC report, “Remedying the discriminatory tax treatment of telecom goods and services may reduce tax receipts in the short-term, but the longer-term increase in the use of advanced capability devices, service demand, and network deployment resulting from these tax reductions is likely to counteract this loss of revenue over time.”[8] Policymakers need to weigh the trade-offs between the short-term revenue benefits of excessive wireless taxes versus the long-term economic impact on the state from reduced infrastructure investment.
Conclusion
Wireless consumers continue to be burdened with higher taxes, fees, and surcharges in many states and localities across the United States. With state and local governments continuing to face revenue challenges, the wireless industry and its customers continue to be an attractive target for raising new revenues. Excessive taxes on wireless consumers disproportionately impacts poorer families and may have ramifications for long-term state economic development and growth. Higher taxes on wireless service, coupled with increased taxes on wireless investments, may lead to slower deployment of wireless network infrastructure, including fourth and fifth generation (“4G” and “5G”) wireless broadband technologies—a key element to the future success of Smart Cities.
States should study their existing communications tax structure and consider policies that transition their tax systems away from narrowly-based wireless taxes and toward broad-based tax sources that do not distort consumer purchasing decisions and do not slow investment in critical infrastructure like wireless broadband. Florida took a step in the right direction by reducing the Communications Services Tax in 2015, but wireless tax rates there are still well above the sales tax. Reform of communications taxes in states with excessive tax rates would position those states to attract additional wireless infrastructure investments that generate economic growth through the new jobs and revenue growth they produce while helping provide relief to low-income wireless users.
Appendix A: Methodology
The methodology used in this report to calculate wireless taxes compares the applicable federal, state, and local tax rates on wireless voice service in the capital city and the most populated city in each state. This methodology was developed by the Committee on State Taxation (COST) in its landmark “50-State Study and Report on Telecommunications Taxation,” first published in 2000.
The use of a consistent methodology allows for accurate time-series comparisons across states and over time. However, changes in consumer demand for wireless services pose challenges when measuring the impact of wireless taxes on consumer bills. In particular, two trends in the industry are significantly impacting the amount of taxes that wireless consumers pay on their monthly bills.
First, a growing share of wireless consumer purchases is for internet access. Recent data from the U.S. Census Bureau surveys suggests that about 46 percent of total wireless service revenues are from the sale of internet access.[9] This percentage has been growing by roughly five percentage points per year since 2013, and this trend may accelerate because wireless consumers are demanding a growing number of internet-only devices.
Under federal law, all but a handful of states are currently precluded from imposing taxes on internet access and all states will be prohibited from taxing internet access after 2019. This suggests that of the “typical” consumer’s monthly expenditure of $38.66 per month, approximately $17.40 is for nontaxable internet access and $21.26 is for taxable wireless service. A consumer applying the effective tax rates in this report to their total bill will find that the effective tax rate overstates their actual tax paid if their calling plan includes both taxable voice service and exempt internet access.
Second, the report’s methodology understates the tax rate impact of flat rate taxes and fees—those that are imposed a set dollar amount per line. Under the report’s methodology, a $1.00 per month per-line tax is converted to a percentage amount by dividing $1.00 by the $38.66 average monthly bill, resulting in a tax rate of 2.59% in this example. However, these flat rate taxes and fees are only permitted to be imposed on the portion of the wireless bill that is not internet access. In this same example, if the $1.00 per month were divided by the taxable portion of the bill ($21.26), the tax rate would be 4.7%.
Notwithstanding these methodological challenges, the author has determined that the benefits of retaining the current methodology–consistent measurement of trends in tax rates over time–outweigh the benefits of changing the methodology to adjust to recent trends. This is particularly true since the Census Bureau has only been tracking the percentage of wireless expenditures on internet access since 2012, so it would not be possible to go back and retroactively adjust data prior to then.
Appendix B: What are Universal Service Funds?
The Federal Universal Service Fund (FUSF) is administered by the Federal Communications Commission (FCC) under open-ended authority from Congress. The program subsidizes telecommunications services for schools, libraries, hospitals, low-income people, and rural telephone companies operating in high-cost areas. The FCC has authority to set spending for these programs outside of the normal congressional appropriations process. After deciding what to spend on the various programs, the FCC sets the quarterly “contribution factor” or surcharge rate that telecommunications providers must remit to the USF to generate sufficient revenues to fund the expenditure commitments. Providers are permitted to surcharge these “contributions” on the phone bills.
FUSF surcharges apply only to interstate telecommunications services. They currently do not apply to internet access service, information services, and intrastate telecommunications services.
Wireless carriers generally sell plans that include either unlimited voice minutes or a fixed number of voice minutes for a set amount. Since these plans include both interstate calls (subject to the FUSF) and intrastate calls (not subject to FUSF), the FCC allows providers to allocate the fixed monthly plans to interstate and intrastate calls by one of two methods. Carriers may use traffic studies to show the actual split between interstate and interstate calls for all of its subscribers and apply the FUSF to the aggregated interstate portion of subscriber calls.
Alternatively, carriers may use a single uniform national “safe harbor” percentage to its fixed monthly plans. The FCC currently sets this safe harbor at 37.1 percent of the fixed monthly charge. For example, when determining the FUSF, a customer with a $50 monthly wireless voice calling plan is deemed to include $18.55 in interstate calls and $31.45 in intrastate calls. If a carrier elects to use the safe harbor, the FUSF rate would be applied to $18.55 of the bill each month.
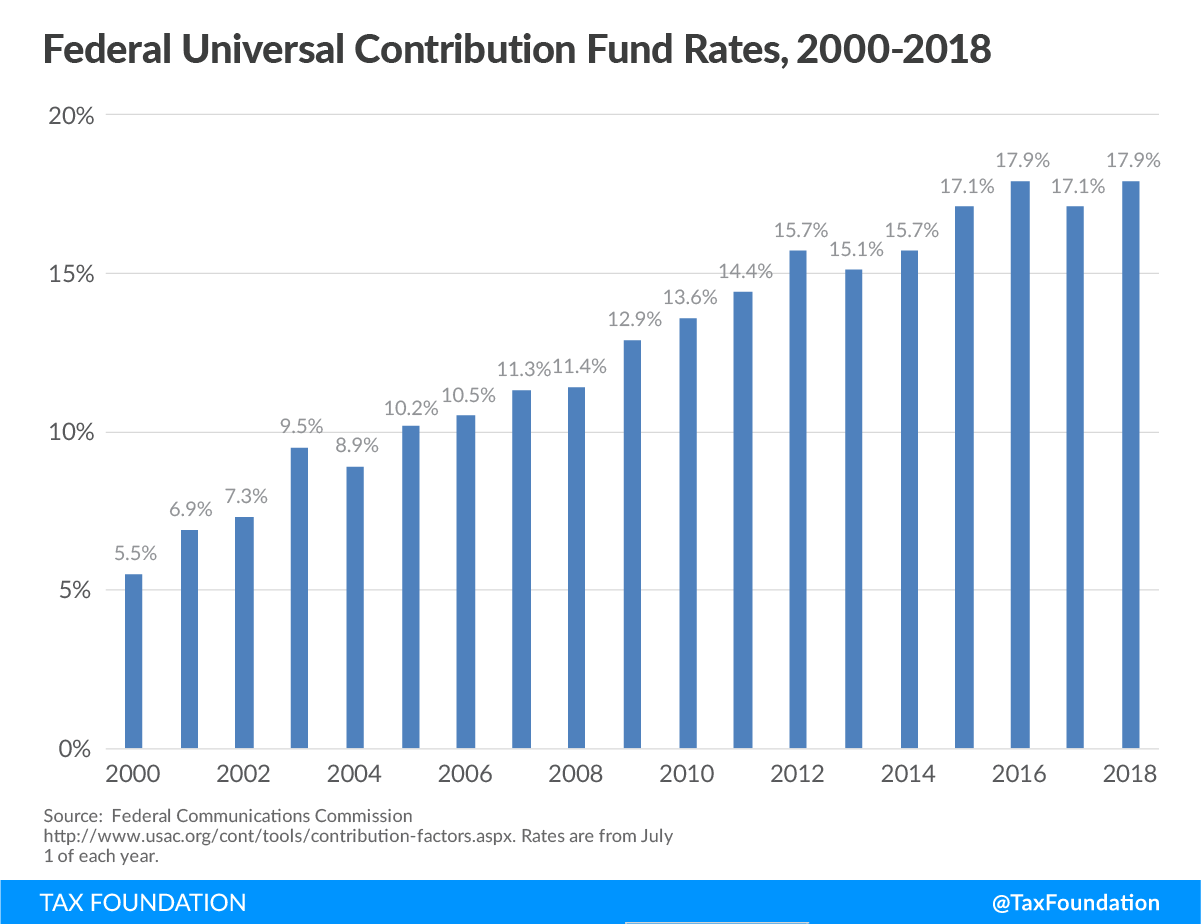
The FUSF rate is set by the FCC each quarter. For the period beginning July 1, 2018, the rate is 17.9%. Thus, the FUSF rate applied on assessable wireless revenues using the FCC safe harbor amount is 6.64% (17.9% times 37.1%*).[10] Figure B1 below highlights the significant growth in the FCC contribution rate since 2003.
*Erratum: A previous version of this sentence incorrectly stated the FCC safe harbor as 62.9 percent.
Figure B1.
Taxes make more sense with us in your inbox.
Subscribe to our newsletter for tax insights that cut through the noise—and make sense of it.
Sign UpDespite the growing burden on wireless consumers, Congress has shown little interest in restricting or otherwise limiting the growth of the programs funded through the FSUF.
States also have the authority to supplement the programs funded through the FUSF with their own programs funded through state universal services funds. The state programs are funded by surcharges applied to the intrastate portion of telephone charges. In this report, the inverse of the FUSF safe harbor is used to calculate the rates of the state USF in all states except Vermont, which imposes its state USF on both interstate and intrastate charges. As in the previous example, if a consumer has a $50 monthly wireless voice plan, 62.9 percent of that charge ($31.45) is deemed to be an intrastate service subject to the state USF charge and $18.55 is an interstate service not subject to state USF charges.
Like the FUSF, state universal service fund charges do not apply to internet access. State USF charges are key factors in the high wireless tax burden in states like Alaska, Arkansas, California, Kansas, and Nebraska.
Appendix C
|
Sources: Committee on State Taxation, 50-State Study and Report on Telecommunications Taxation, May 2005. Updated July 2017 by Scott Mackey, Leonine Public Affairs LLP, using state statutes and regulations. Average Revenue Per Unit (ARPU): $41.50 per Cellular Telephone and Internet Association, July 2018. |
||||
|
*Erratum: A previous version of this table incorrectly stated the FCC safe harbor as 62.9 percent. |
||||
| State | Type of Tax | Rate | Comments | |
|---|---|---|---|---|
| Alabama | ||||
| AL Cell Service Tax | 6.00% | Access, interstate and intrastate | ||
| E911 | 4.53% | $1.75 per month | ||
| TOTAL TRANSACTION TAX | 10.53% | |||
| Alaska | ||||
| Local Sales Tax | 2.50% | Avg. of Juneau (5%) & Anchorage (0%) | ||
| Local E911 | 5.04% | Anchorage – $2.00; Juneau – $1.90 | ||
| State USF | 11.95% | 19.0% times FCC safe harbor | ||
| TOTAL TRANSACTION TAX | 19.49% | |||
| Arizona | ||||
| State sales (transaction priv.) | 5.60% | intrastate telecommunications service | ||
| County sales (transaction priv.) | 0.60% | Phoenix (Maricopa) = 0.7%; Tucson (Pima) = 0.5% | ||
| City telecommunications | 5.85% | Avg. Phoenix (4.7%) & Tucson (7.0%) | ||
| 911 | 0.52% | $.20 per month | ||
| TOTAL TRANSACTION TAX | 12.57% | |||
| Arkansas | ||||
| State sales tax | 6.50% | |||
| Local sales taxes | 2.88% | Avg. Little Rock (2.5%) & Fayetteville (3.25%) | ||
| State High Cost Fund | 4.09% | 6.5% times FCC safe harbor | ||
| Wireless 911 | 1.68% | $.65 / month statewide. | ||
| TRS service & TRS equipment | 0.08% | $.03 per line per month | ||
| TOTAL TRANSACTION TAX | 15.22% | |||
| California | ||||
| Local Utility User Tax | 8.00% | Avg. of LA (9%) and Sacramento (7%) | ||
| State 911 | 0.47% | 0.75% times FCC safe harbor | ||
| PUC fee | 0.21% | 0.33% times FCC safe harbor | ||
| ULTS (lifeline) | 2.99% | 4.75% times FCC safe harbor | ||
| Deaf/CRS | 0.31% | 0.5% times FCC safe harbor | ||
| High Cost Funds A & B | 0.22% | 0.35% times FCC safe harbor | ||
| Teleconnect Fund | 0.68% | 1.08% times FCC safe harbor | ||
| CASF – advanced services fund | 0.35% | 0.56% times FCC safe harbor | ||
| TOTAL TRANSACTION TAX | 13.23% | |||
| Colorado | ||||
| State Sales Tax | 2.90% | access and intrastate | ||
| Local Sales Tax — City/County | 5.05% | Avg. of Denver (4.75%) & Colorado Springs (5.35%) | ||
| 911 | 2.65% | Denver ($.70) / Colorado Springs ($1.35) | ||
| USF | 1.64% | 2.6% times FCC safe harbor | ||
| TDD Tax | 0.10% | 4 cents per month | ||
| TOTAL TRANSACTION TAX | 12.34% | |||
| Connecticut | ||||
| State sales tax | 6.35% | Access, interstate and intrastate | ||
| 911 | 1.47% | $.57 per line | ||
| TOTAL TRANSACTION TAX | 7.82% | |||
| Delaware | ||||
| Public Utility Gross Receipts Tax | 5.00% | Access and intrastate | ||
| Local 911 tax | 1.55% | $.60 / month | ||
| TOTAL TRANSACTION TAX | 6.55% | |||
| District of Columbia | ||||
| Telecommunication Privilege Tax | 10.00% | Monthly gross charge; | ||
| 911 | 1.97% | $0.76 per month | ||
| TOTAL TRANSACTION TAX | 11.97% | |||
| Florida | ||||
| State Communications services | 7.44% | Access, interstate and intrastate | ||
| Local Communications services | 6.36% | Jacksonville 5.82%; Tallahassee 6.9% | ||
| 911 | 1.03% | $.40/month statewide | ||
| TOTAL TRANSACTION TAX | 14.83% | |||
| Georgia | ||||
| State sales tax | 3.62% | 4% of “access charge” — assume $35 | ||
| Local sales tax | 4.03% | Avg. rate Atlanta (4.9%) & Augusta (4%) | ||
| Local 911 | 3.88% | Atlanta — $1.50/line; Augusta — $1.50/line | ||
| TOTAL TRANSACTION TAX | 11.53% | |||
| Hawaii | ||||
| Public service company tax | 4.00% | |||
| Additional county tax | 1.89% | |||
| PUC Fee | 0.16% | 0.25% of intrastate charges | ||
| Wireless 911 fee | 1.71% | $.66 per month | ||
| TOTAL TRANSACTION TAX | 7.75% | |||
| Idaho | ||||
| Telephone service assistance program | 0.00% | Set annually by PUC — currently zero | ||
| Statewide wireless 911 | 2.59% | Boise = $1.00 per month | ||
| TOTAL TRANSACTION TAX | 2.59% | |||
| Illinois | ||||
| State telecom excise tax | 7.00% | Access, interstate and intrastate | ||
| Simplified municipal tax | 5.50% | Avg. of Chicago (7%) & Springfield (4%) | ||
| Wireless 911 | 8.41% | Chicago $5/mo.; others $1.50/mo | ||
| TOTAL TRANSACTION TAX | 20.91% | |||
| Indiana | ||||
| State sales tax | 7.00% | Access and intrastate | ||
| Utility receipts tax | 1.40% | Same base as sales tax | ||
| Wireless 911 | 2.59% | $1.00 per month | ||
| State USF | 0.69% | 1.09% times FCC safe harbor | ||
| PUC fee | 0.12% | Statutory max 0.15% | ||
| TOTAL TRANSACTION TAX | 11.79% | |||
| Iowa | ||||
| State sales tax | 6.00% | |||
| Local option sales taxes | 0.50% | Avg. of Cedar Rapids (1%) & Des Moines (0%) | ||
| Wireless 911 | 2.59% | $1.00 per month | ||
| Dual Party Relay Service fee | 0.08% | $0.03 per month | ||
| TOTAL TRANSACTION TAX | 9.16% | |||
| Kansas | ||||
| State sales tax | 6.50% | Intrastate & interstate | ||
| Local option sales taxes | 1.83% | Avg. of Wichita (1.0%) & Topeka (2.65%) | ||
| USF | 4.72% | 7.50% x FCC safe harbor | ||
| Wireless 911 | 1.55% | $.60 per month per line | ||
| TOTAL TRANSACTION TAX | 14.59% | |||
| Kentucky | ||||
| State sales tax | 6.00% | Access, interstate and intrastate | ||
| School utility gross receipts | 1.50% | Avg Frankfort (3%) and Lousiville (0%) | ||
| Kentucky USF | 0.23% | $.09 per month | ||
| Kentucky TAP & TRS | 0.08% | TAP: $0.02 and TRS: $0.01 | ||
| Wireless 911 | 1.81% | $.70 / month | ||
| Communications gross receipts tax | 1.30% | Access, interstate and intrastate | ||
| TOTAL TRANSACTION TAX | 10.92% | |||
| Louisiana | ||||
| State sales tax | 4.45% | Intrastate rate | ||
| Wireless 911 | 2.72% | New Orleans $1.25/mo.; Baton Rouge $.85/mo. | ||
| State USF | 3.34% | May vary by carrier | ||
| TOTAL TRANSACTION TAX | 10.50% | |||
| Maine | ||||
| State service provider tax | 6.00% | Intrastate | ||
| 911 fee | 1.16% | $.45 per month | ||
| Maine USF | 1.32% | 2.1% times FCC safe harbor | ||
| MTEAF | 0.44% | 0.7% times FCC safe harbor | ||
| TOTAL TRANSACTION TAX | 8.93% | |||
| Maryland | ||||
| State sales tax | 6.00% | |||
| Local telecom excise | 5.17% | $4.00 per month in Baltimore; no tax in Annapolis | ||
| State 911 | 0.65% | $.25 per month | ||
| County 911 | 1.94% | $.75 per month in all counties | ||
| State USF | 0.13% | $0.05 per month | ||
| TOTAL TRANSACTION TAX | 13.89% | |||
| Massachusetts | ||||
| State sales tax | 6.25% | Interstate and intrastate | ||
| Wireless 911 | 2.59% | $1.00 per month | ||
| TOTAL TRANSACTION TAX | 8.84% | |||
| Michigan | ||||
| State sales tax | 6.00% | Interstate and intrastate | ||
| State wireless 911 | 0.65% | $.25 per month | ||
| County wireless 911 | 1.09% | Detroit $.42; Lansing $.42 | ||
| Intrastate toll assessment | 0.62% | .98% of intrastate charges | ||
| TOTAL TRANSACTION TAX | 8.35% | |||
| Minnesota | ||||
| State sales tax | 6.88% | Interstate and intrastate | ||
| Local sales tax | 1.08% | Minneapolis (1.15%) and St. Paul (1.0%) | ||
| 911 | 2.46% | $.95 per month | ||
| Telecom access MN fund | 0.13% | $0.05 per line per month | ||
| TOTAL TRANSACTION TAX | 10.54% | |||
| Mississippi | ||||
| State sales tax | 7.00% | Access, interstate and intrastate | ||
| Wireless 911 | 2.59% | $1.00 per month per line | ||
| TOTAL TRANSACTION TAX | 9.59% | |||
| Missouri | ||||
| State sales tax | 4.23% | Access and intrastate | ||
| Local sales taxes | 4.06% | Avg. Jefferson City (3.5%) & Kansas City (4.625%) | ||
| Local business license tax | 6.50% | Jefferson City (7%); Kansas City (6% residential) | ||
| TOTAL TRANSACTION TAX | 14.79% | |||
| Montana | ||||
| Telecom excise tax | 3.75% | Access, interstate and intrastate | ||
| 911 & E911 tax | 2.59% | $1.00 per number per month | ||
| TDD tax | 0.26% | $.10 per number per month | ||
| TOTAL TRANSACTION TAX | 6.60% | |||
| Nebraska | ||||
| State sales tax | 5.50% | Access & intrastate | ||
| Local sales tax | 1.63% | Lincoln (1.75%) and Omaha (1.5%) | ||
| City business and occupation tax | 6.13% | Avg. of Omaha (6.25%) & Lincoln (6.0%) | ||
| State USF | 4.37% | 6.95% times FCC safe harbor | ||
| Wireless 911 | 1.16% | $.45 per month | ||
| TRS | 0.05% | $.02 per month | ||
| TOTAL TRANSACTION TAX | 18.84% | |||
| Nevada | ||||
| Local franchise / gross receipts | 1.94% | 5% of first $15 intrastate revenues | ||
| Local 911 tax | 1.10% | Washoe County = $.85 / month; Clark County no tax | ||
| State deaf relay charge | 0.16% | $.06 per access line | ||
| Nevada USF | 0.07% | 0.11% times FCC Safe Harbor | ||
| TOTAL TRANSACTION TAX | 3.27% | |||
| New Hampshire | ||||
| Communication services tax | 7.00% | Access, interstate and intrastate | ||
| 911 tax | 1.94% | $.75 per month | ||
| TOTAL TRANSACTION TAX | 8.94% | |||
| New Jersey | ||||
| State sales tax | 6.63% | |||
| Wireless 911 | 2.33% | $.90 per month | ||
| TOTAL TRANSACTION TAX | 8.95% | |||
| New Mexico | ||||
| State gross receipts (sales) tax | 5.13% | 5.125% intrastate; 4.25% interstate | ||
| City and county gross receipts tax | 3.03% | Avg. Santa Fe (3.3125%) & Albuquerque (2.75%) | ||
| Wireless 911 | 1.32% | $.51 per month | ||
| TRS surcharge | 0.21% | 0.33% times FCC safe harbor | ||
| State USF | 3.81% | 6.06% times FCC safe harbor | ||
| TOTAL TRANSACTION TAX | 13.49% | |||
| New York | ||||
| State sales tax | 4.00% | Intrastate and monthly access | ||
| Local sales taxes | 4.25% | NYC 4.5%; Albany 4% | ||
| MCTD sales tax | 0.19% | NYC 0.375%; Albany 0% | ||
| State excise tax (186e) | 2.90% | mobile telecom service — includes interstate | ||
| MCTD excise/surcharge (186c) | 0.36% | NYC & surrounding counties – .72%; Albany 0% | ||
| Local utility gross receipts tax | 1.49% | NYC — 84% of 2.35%; Albany 1% | ||
| State wireless 911 | 3.10% | $1.20 per month | ||
| Local wireless 911 | 0.78% | $.30 per month — NYC & most counties | ||
| School district utility sales tax | 1.50% | Albany 3%; NYC no tax | ||
| TOTAL TRANSACTION TAX | 18.56% | |||
| North Carolina | ||||
| State sales tax | 7.00% | Statewide combined rate includes local taxes | ||
| Wireless 911 | 1.68% | $.65 per month | ||
| TRS Charge | 0.21% | $.08 per month | ||
| TOTAL TRANSACTION TAX | 8.89% | |||
| North Dakota | ||||
| State sales tax | 5.00% | Access and intrastate | ||
| Local sales taxes | 2.00% | Avg Fargo (2.5%) & Bismarck (1.5%) | ||
| State gross receipts tax | 2.50% | interstate and intrastate | ||
| Statewide Interoperable Radio Network Tax | 1.29% | $0.50 per line per month | ||
| Local 911 tax | 3.23% | $1.00 Bismarck; $1.50 Fargo | ||
| TRS | 0.10% | Up to $.11/mo — currently $.04 | ||
| TOTAL TRANSACTION TAX | 14.13% | |||
| Ohio | ||||
| State sales tax | 5.75% | Access, interstate and intrastate | ||
| Local sales taxes | 2.00% | Columbus (1.75%) and Cleveland (2.25%) | ||
| Regulatory fee | 0.15% | Intrastate Gross Revenues | ||
| State/local wireless 911 | 0.65% | $.25 per month per phone number | ||
| TOTAL TRANSACTION TAX | 8.55% | |||
| Oklahoma | ||||
| State sales tax | 4.50% | Access, interstate and intrastate | ||
| Local sales taxes | 4.07% | Avg. of OK City (4.125%) & Tulsa (4.017%) | ||
| Local 911 | 1.94% | $.75 per month in OK City and Tulsa | ||
| USF | 0.75% | 1.2% times FCC safe harbor | ||
| TOTAL TRANSACTION TAX | 11.27% | |||
| Oregon | ||||
| Local utililty tax | 0.00% | No tax on wireless in Portland or Salem | ||
| 911 tax | 1.94% | $.75 per month | ||
| RSPF Surcharge | 0.16% | $0.06 per month | ||
| TOTAL TRANSACTION TAX | 2.10% | |||
| Pennsylvania | ||||
| State sales tax | 6.00% | Access, interstate and intrastate | ||
| State gross receipts tax | 5.00% | Access, interstate and intrastate | ||
| Local sales tax | 1.00% | Philadephia 2%; Harrisburg 0% | ||
| Statewide wireless 911 | 4.27% | $1.65 per month | ||
| TOTAL TRANSACTION TAX | 16.27% | |||
| Puerto Rico | ||||
| IVU (Sales Tax) | 11.50% | |||
| 911 fee | 1.29% | $.50 per line | ||
| USF | 0.87% | 1.39% times FCC safe harbor | ||
| TOTAL TRANSACTION TAX | 13.67% | |||
| Rhode Island | ||||
| State sales tax | 7.00% | Access, interstate and intrastate | ||
| Gross receipts tax | 5.00% | Access, interstate and intrastate | ||
| 911 fee | 2.59% | $1.00 per month | ||
| Additional wireless 911 fee | 0.67% | $.26 per month | ||
| TOTAL TRANSACTION TAX | 15.26% | |||
| South Carolina | ||||
| State sales tax | 6.00% | Access, interstate and intrastate | ||
| Local sales tax | 2.50% | Avg. of Charleston (3%) and Columbia (2%) | ||
| Municipal license tax | 1.00% | Charleston (1.0%) and Columbia (1.0%) | ||
| Dual party relay charge | 0.16% | $.06 per line per month | ||
| State USF | 1.30% | 2.07% times FCC safe harbor | ||
| 911 tax | 1.60% | $.62 / month | ||
| TOTAL TRANSACTION TAX | 12.56% | |||
| South Dakota | ||||
| State sales tax | 4.50% | Access, interstate and intrastate | ||
| State gross receipts tax | 4.00% | |||
| local option sales tax | 2.00% | Avg. of Pierre (2.0%) and Sioux Falls (2.0%) | ||
| 911 excise | 3.23% | $1.25 per month | ||
| TRS fee | 0.39% | $.15 per month by statute | ||
| PUC fee | 0.09% | .15% of intrastate receipts | ||
| TOTAL TRANSACTION TAX | 14.22% | |||
| Tennessee | ||||
| State sales tax | 7.00% | Access, interstate and intrastate | ||
| Local sales tax | 2.50% | Statewide local rate for intrastate | ||
| 911 tax | 3.00% | $1.16 per month | ||
| TOTAL TRANSACTION TAX | 12.50% | |||
| Texas | ||||
| State sales tax | 6.25% | Access, interstate and intrastate | ||
| Local sales tax | 2.00% | Austin (2.0%) & Houston (2.0%) | ||
| Wireless 911 tax | 1.29% | $.50 per month per line | ||
| Texas USF | 2.08% | 3.3% times FCC safe harbor | ||
| 911 Equalization surcharge | 0.16% | $.06 per line | ||
| TOTAL TRANSACTION TAX | 11.77% | |||
| Utah | ||||
| State sales tax | 4.70% | Access and intrastate | ||
| Local sales taxes | 2.15% | Avg. of Salt Lake City (2.15%) and Provo (2.15%) | ||
| Local utility wireless | 3.50% | Levied at 3.5% max. in SLC and Provo | ||
| State 911 service charges | 2.07% | $.80 per month | ||
| State Radio Network charge | 1.35% | $.52 per month | ||
| State USF | 0.93% | $0.36 per month | ||
| TOTAL TRANSACTION TAX | 14.70% | |||
| Vermont | ||||
| State sales tax | 6.00% | Access, interstate and intrastate | ||
| Local sales tax | 0.50% | Avg. of Montpelier (0%) and Burlington (1%) | ||
| State 911/USF | 2.00% | Funds 911 and other programs | ||
| TOTAL TRANSACTION TAX | 8.50% | |||
| Virginia | ||||
| State communications sales tax | 5.00% | CST | ||
| Wireless 911 | 1.94% | $.75 per month | ||
| TOTAL TRANSACTION TAX | 6.94% | |||
| Washington | ||||
| State sales tax | 6.50% | Access, interstate and intrastate | ||
| Local sales taxes | 2.95% | Olympia (2.3%) & Seattle (3.6%) average | ||
| B&O / Utility Franchise — local | 7.50% | Olympia (9%) & Seattle (6%) average | ||
| 911 — state | 0.65% | $.25 per month | ||
| 911 — local | 1.81% | $.70 per month | ||
| TOTAL TRANSACTION TAX | 19.41% | |||
| West Virginia | ||||
| State sales tax | 0.00% | No sales tax on wireless | ||
| Wireless 911 | 8.64% | $3.34 per month | ||
| TOTAL TRANSACTION TAX | 8.64% | |||
| Wisconsin | ||||
| State sales tax | 5.00% | Access, intrastate and interstate | ||
| Local sales tax | 0.55% | Avg. of Milwaukee (0.6%) & Madison (0.5%) | ||
| Police and Fire Protection Fee | 1.94% | $.75 per month | ||
| State USF | 1.50% | 2.38% times FCC safe harbor | ||
| TOTAL TRANSACTION TAX | 8.99% | |||
| Wyoming | ||||
| State sales tax | 4.00% | access and intrastate | ||
| Local sales tax | 1.50% | Avg. of Cheyenne (2%) and Casper (1%) | ||
| TRS | 0.23% | Up to $.25/month — $.09 currently | ||
| USF | 1.07% | 1.7% times FCC safe harbor | ||
| 911 tax | 1.94% | $.75 per month in Cheyenne and Casper | ||
| TOTAL TRANSACTION TAX | 8.74% | |||
| ARPU= $38.66 | ||||
| FCC Safe Harbor = 37.1%* | ||||
Notes
[1] Stephen J. Blumberg and Julian V. Luke, “Wireless Substitution: Early Release of Estimates from the National Health Interview Survey, July–December 2017,” National Center for Health Statistics, June 2018, 1-3, https://www.cdc.gov/nchs/data/nhis/earlyrelease/wireless201806.pdf.
[2] These estimates are calculated by applying the rates of percentage-based taxes in each state by the average monthly bill after excluding the estimated 45 percent of the average monthly bill representing internet access. For flat rate per-line impositions, the per-line rate is multiplied by the estimated number of postpaid wireless lines.
[3] Missouri enacted HB1456 in 2018 that authorizes certain cities and counties to impose wireless 911 fees on or after January 1, 2019 if approved by voters.
[4] Federal Communications Commission, “Ninth Annual Report to Congress on State Collection and Distribution of 911 and Enhanced 911 Fees and Charges for the Period January 1, 2016 to December 31, 2016,” Dec. 29, 2017, file:///C:/Users/RachelSW/Downloads/9th_annual_911_fee_report.pdf.
[5] Bill Ruthhart and Hal Dardick, “Emanuel’s Latest Possible Tax Hike: 911 Phone Fees,” Chicago Tribune, June 1, 2017, http://www.chicagotribune.com/news/local/politics/ct-rahm-emanuel-phone-fee-increase-met-0602-20170601-story.html.
[6] Stephen J. Blumberg, and Julian V. Luke, “Wireless Substitution: Early Release of Estimates from the National Health Interview Survey, July–December 2017,” 2-3.
[7] International Chamber of Commerce, “ICC Discussion Paper on the Adverse Effects of Discriminatory Taxes on Telecommunications Service,” Oct. 26, 2010, https://cdn.iccwbo.org/content/uploads/sites/3/2010/10/ICC-discussion-paper-on-the-adverse-effects-of-discriminatory-taxes-on-telecommunications-services.pdf.
[8] International Chamber of Commerce, “ICC Discussion Paper on the Adverse Effects of Discriminatory Taxes on Telecommunications Service,” 2.
[9] Dr. Robert F. Roche and Shae Gardner, “ Wireless Industry Indices Report: 2018,” CTIA, July 2018, 40.
[10] For the purposes of this report, the FCC safe harbor percentage is used. This allows for consistent multiyear comparisons of taxes, fees, and surcharges.
Share this article