The $10,000 state and local taxA tax is a mandatory payment or charge collected by local, state, and national governments from individuals or businesses to cover the costs of general government services, goods, and activities. (SALT) deduction cap has once again become a focal point in congressional tax policy discussions as House Republicans consider the proposed American Families and Jobs Act. Using 2020 data from the Internal Revenue Service (IRS), we can examine how the SALT cap affects taxpayers across the U.S. by comparing state and local tax reported on taxpayer’s returns and how much they deducted while subject to the $10,000 cap.
Higher-income taxpayers in high-tax locations are most impacted by the $10,000 SALT cap. Any changes to lift the cap would primarily benefit higher earners and make the tax code more regressive.
As a review, taxpayers who itemize may deduct their state and local real estate and personal property taxes as well as either their state and local income or general sales taxes. The Tax Cuts and Jobs Act (TCJA) limited the total amount of state and local taxes taxpayers can deduct on federal tax returns to $10,000 for tax years 2018 through 2025. Additionally, the TCJA doubled the standard deduction, reducing the number of taxpayers who benefit from itemizing.
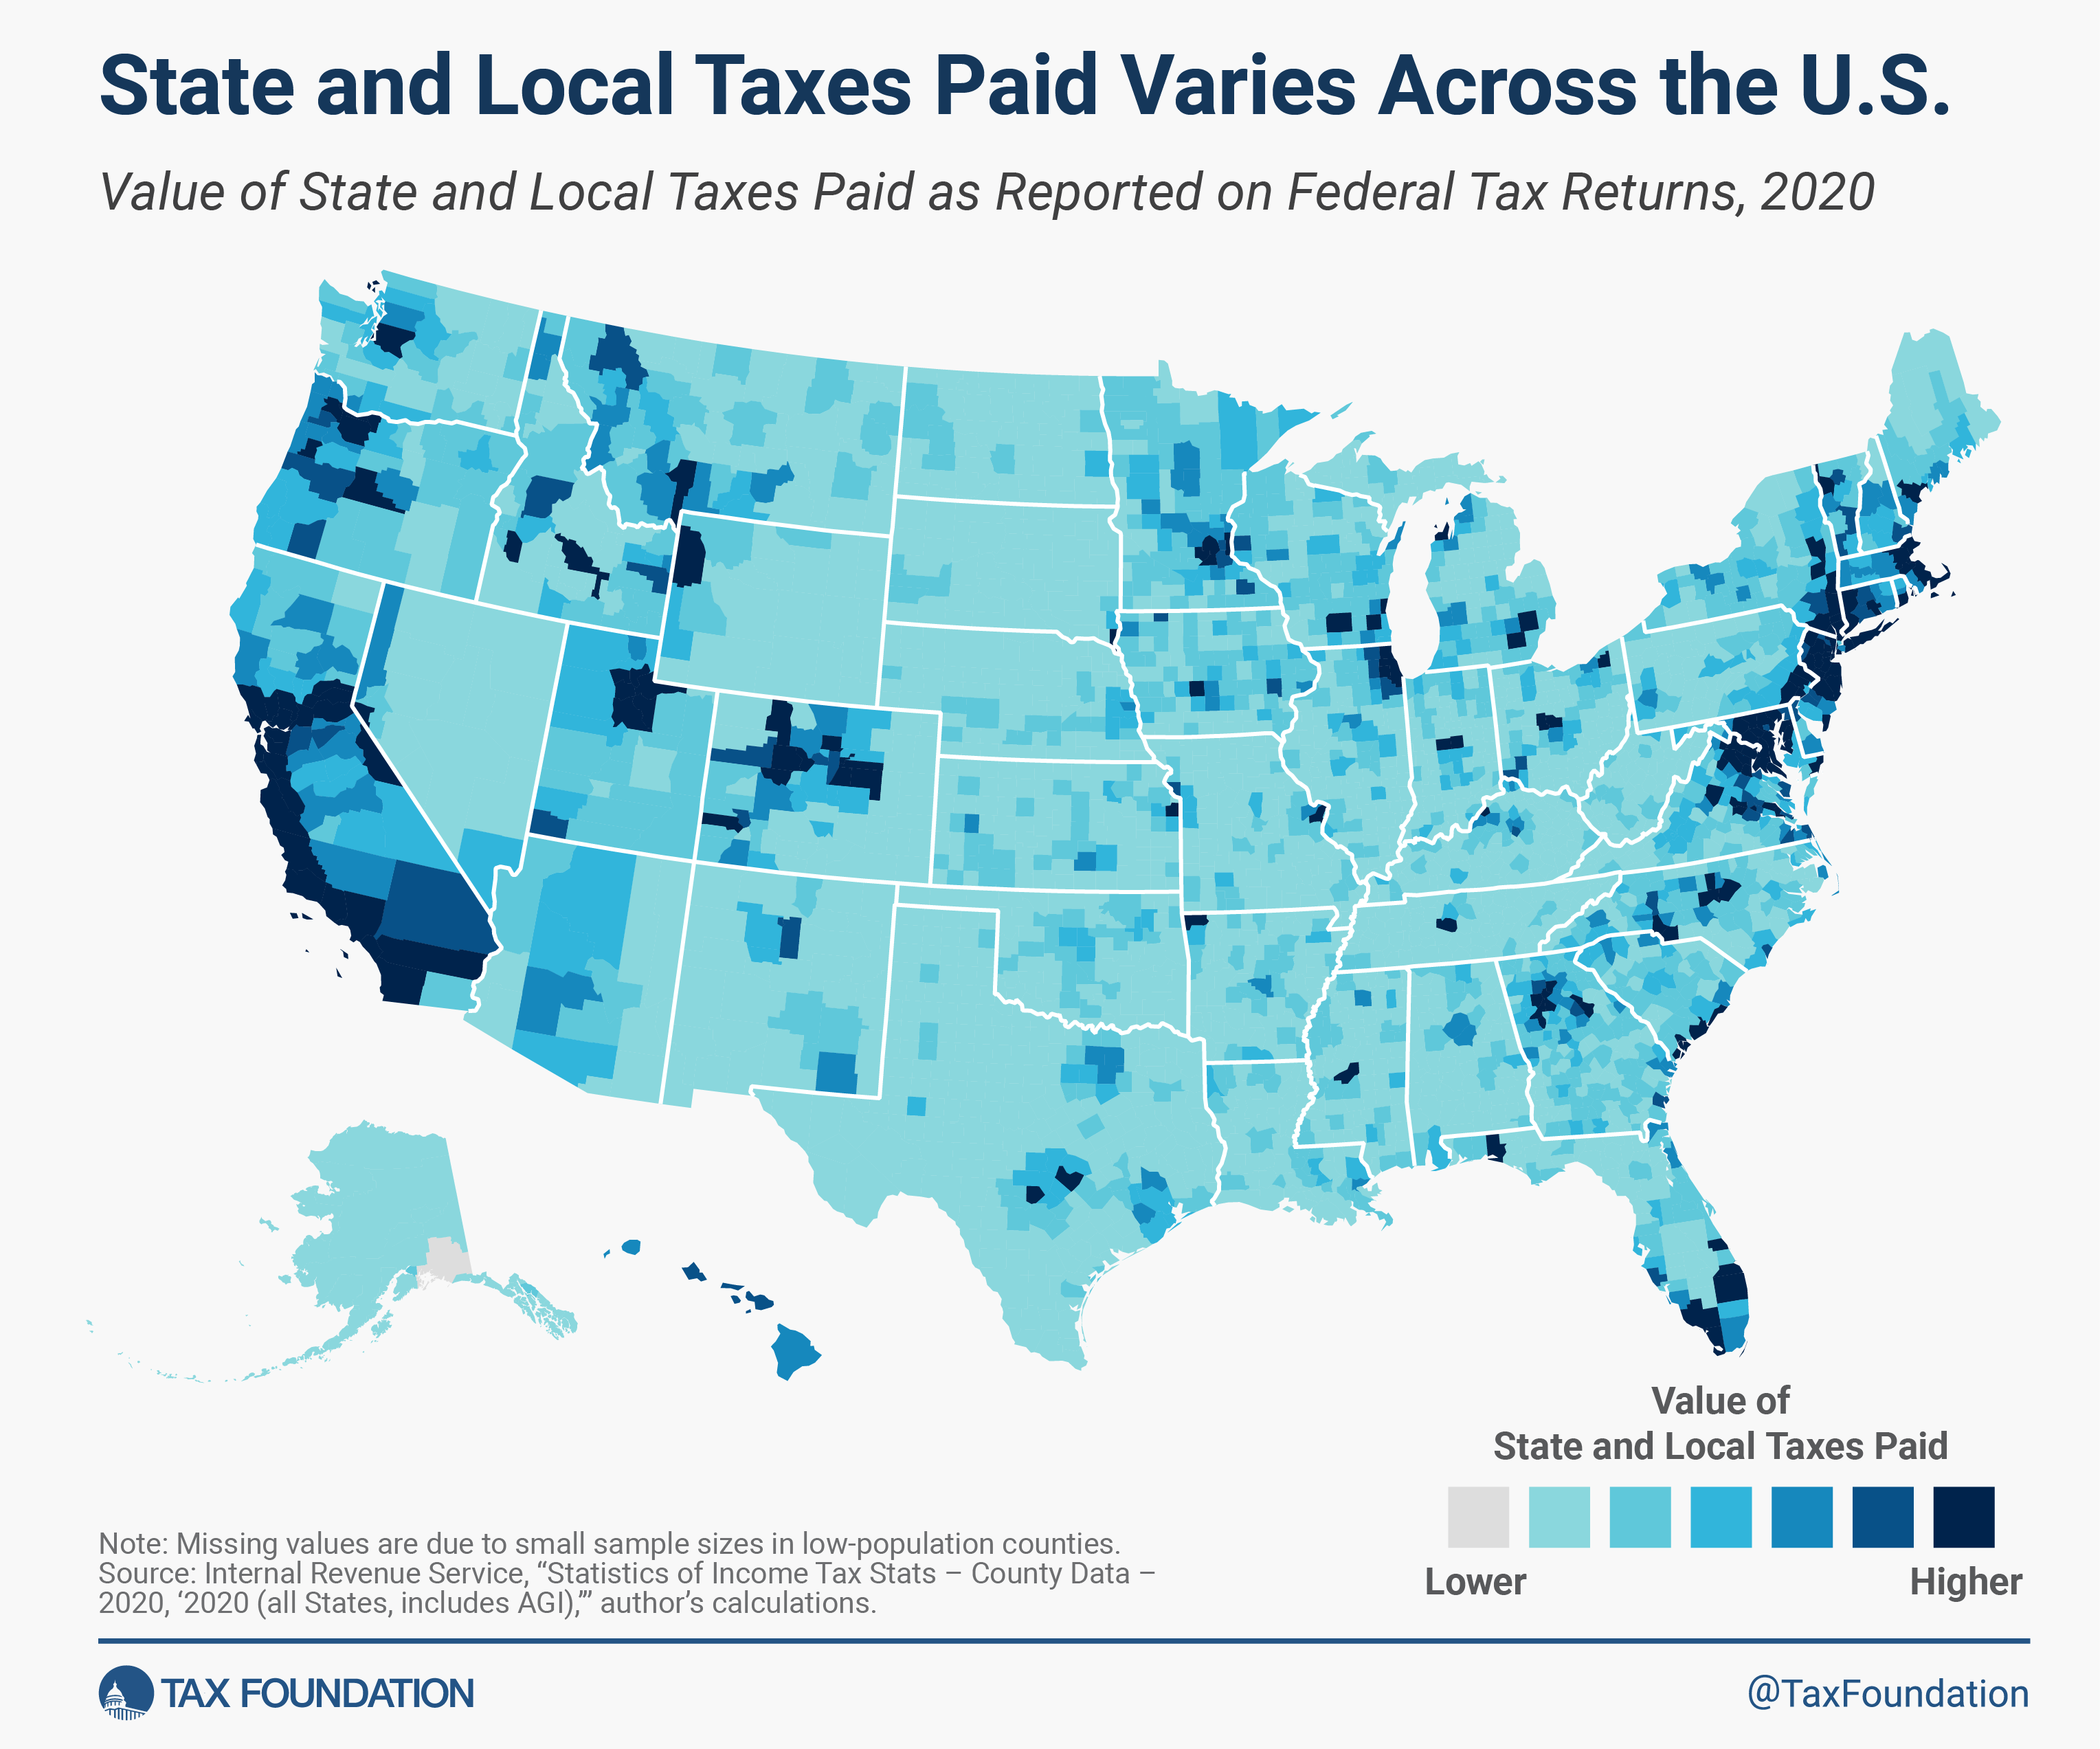
The maps below are interactive. The first map shows the average amount of state and local taxes paid as reported on federal tax returns for each county. This is the total value of all state and local taxes paid divided by the number of returns filled. The reported amount of state and local taxes paid may exceed $10,000, but not all SALT paid can be deducted under the $10,000 cap.
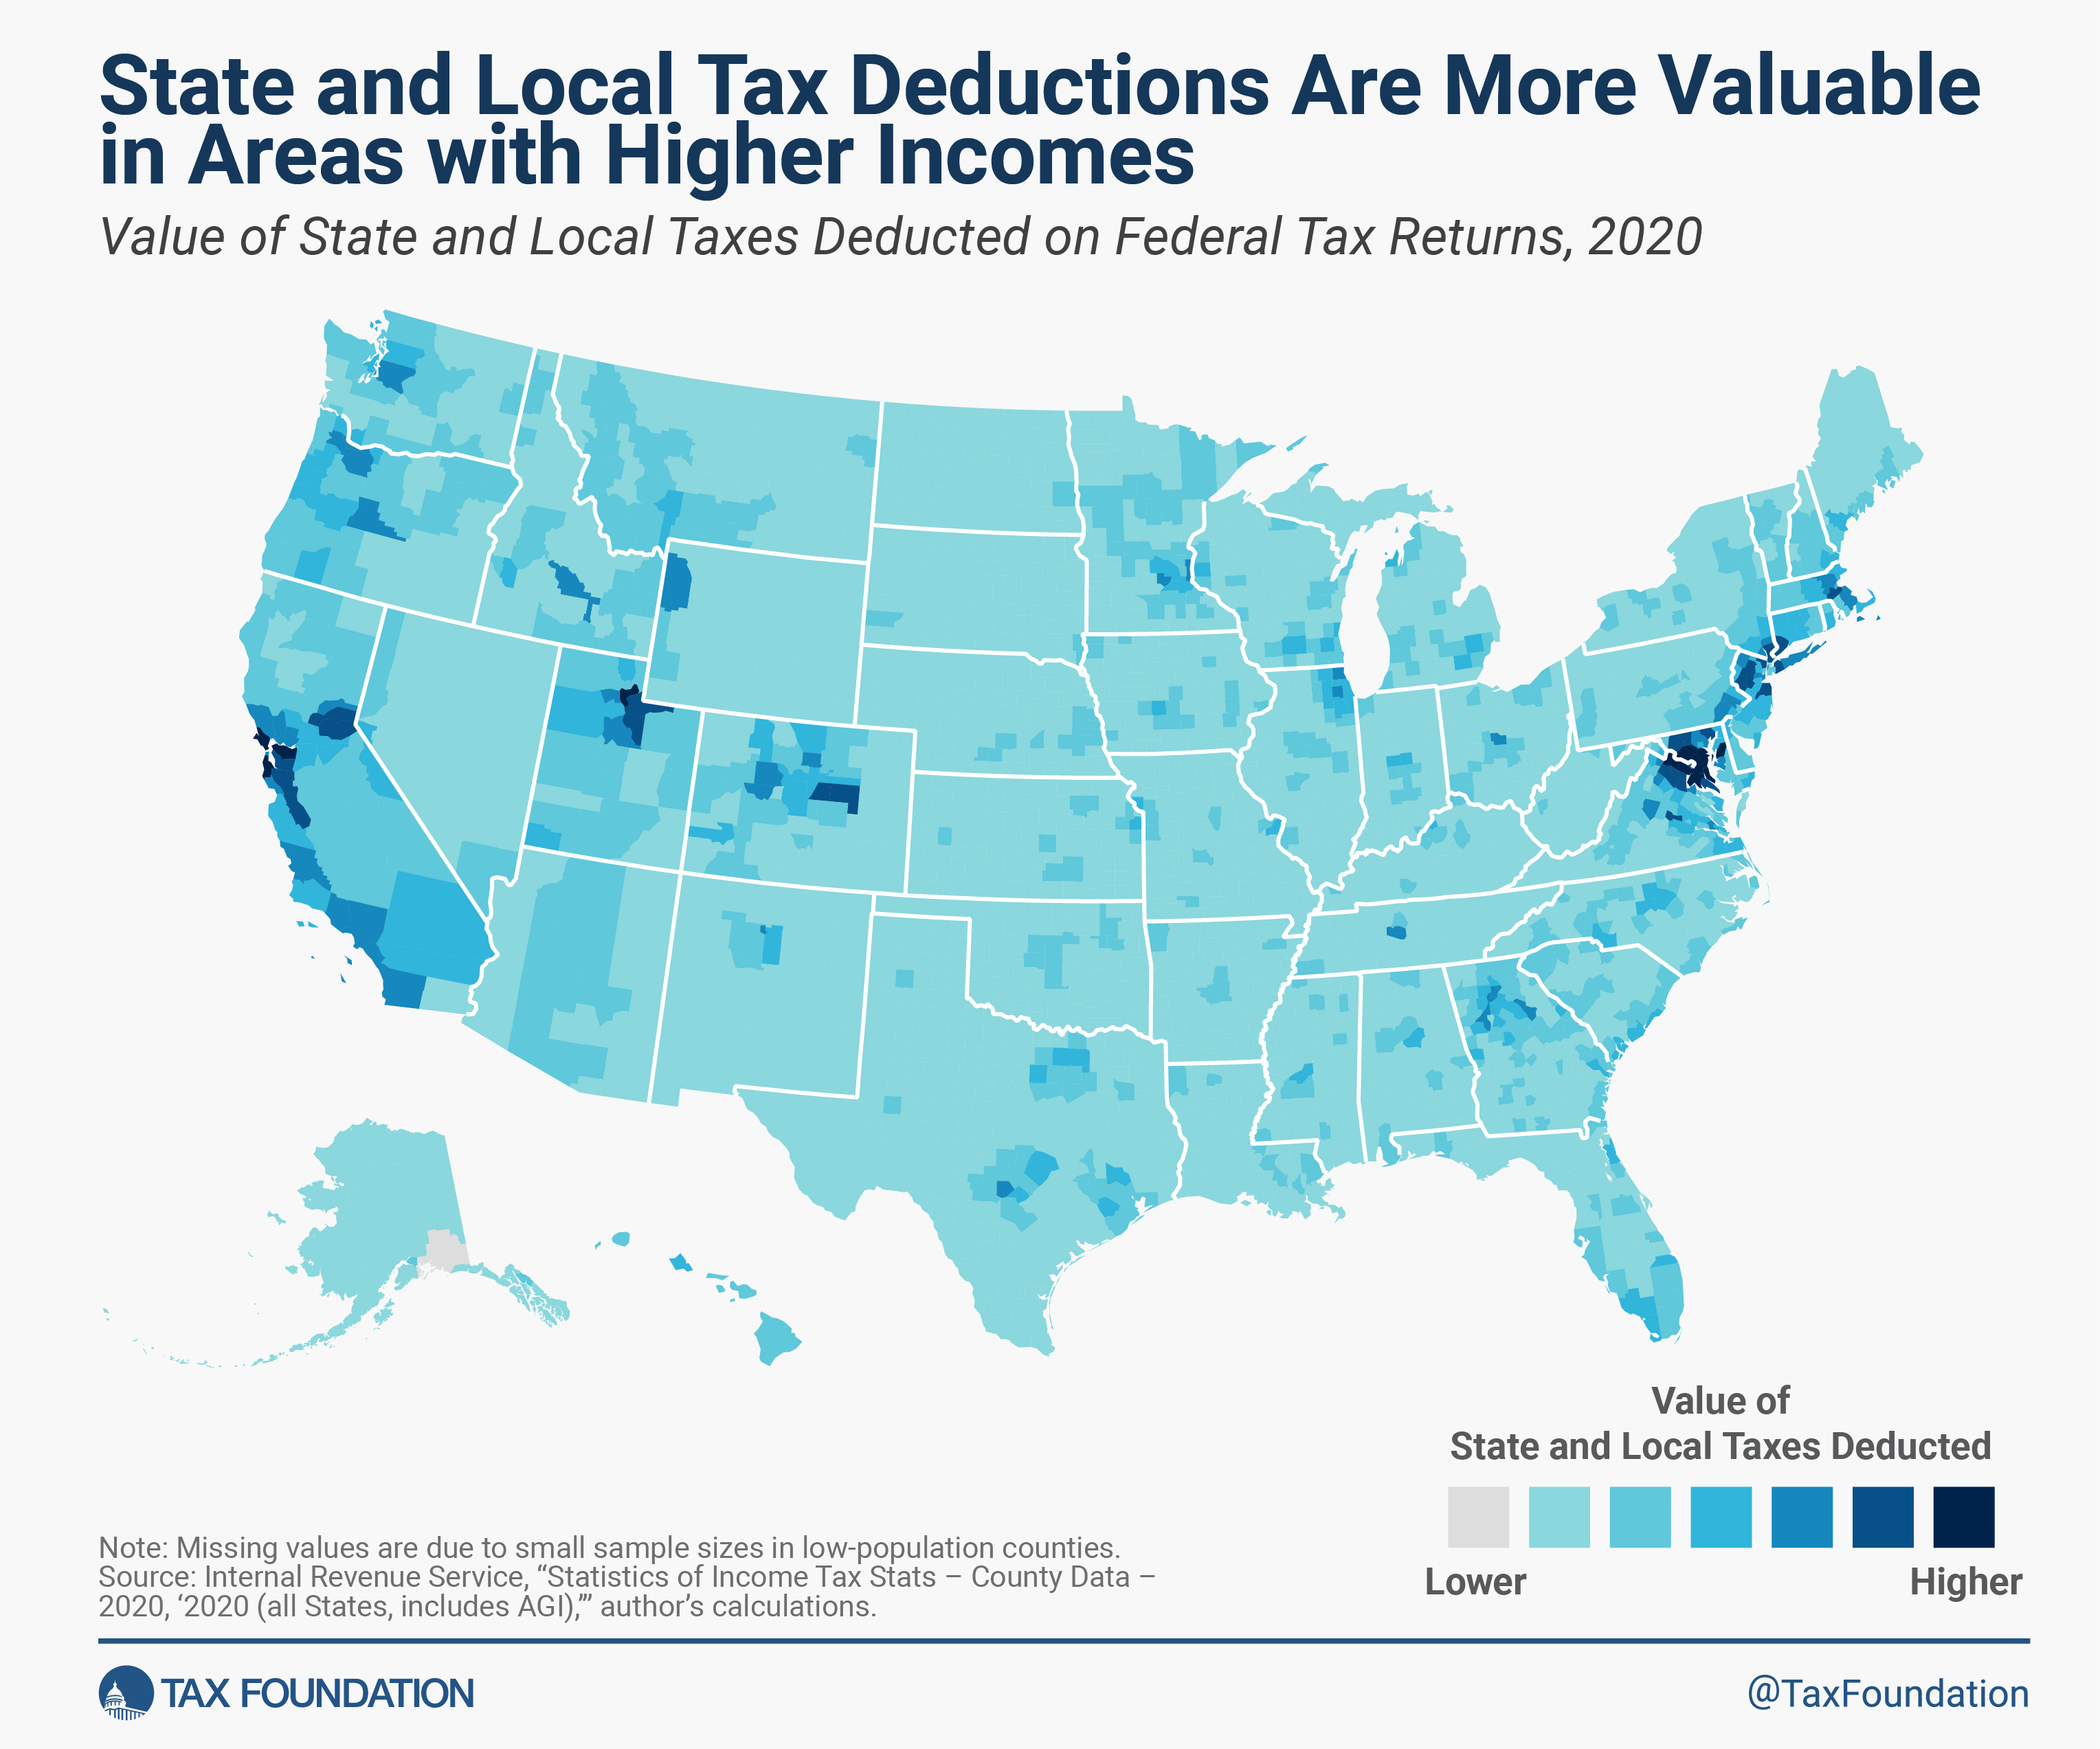
The second map shows the average amount of state and local taxes deducted by taxpayers in each county. This is the total value of all the deductions taken for state and local taxes paid, divided by the number of returns filed.
State and Local Taxes Paid Varies Across the U.S.
Value of State and Local Taxes Paid as Reported on Federal Tax Returns, 2020
Note: Missing values are due to small sample sizes in low-population counties. This interactive map is more accessible when viewed on larger screens.
Source: Internal Revenue Service, “Statistics of Income Tax Stats – County Data – 2020, ‘2020 (all States, includes AGI),’” https://www.irs.gov/statistics/soi-tax-stats-county-data-2020, author’s calculations.
Launch Full Interactive Map Access Shareable Map
State and Local Tax Deductions Are More Valuable in Areas with Higher Incomes
Value of State and Local Taxes Deducted on Federal Tax Returns, 2020
Note: Missing values are due to small sample sizes in low-population counties. This interactive map is more accessible when viewed on larger screens.
Source: Internal Revenue Service, “Statistics of Income Tax Stats – County Data – 2020, ‘2020 (all States, includes AGI),’” https://www.irs.gov/statistics/soi-tax-stats-county-data-2020, author’s calculations.
Launch Full Interactive Map Access Shareable Map
Two factors drive the regional variation in SALT deductions. First, taxpayers with higher incomes tend to itemize at higher rates, while low-income taxpayers are more likely to take the standard deductionThe standard deduction reduces a taxpayer’s taxable income by a set amount determined by the government. It was nearly doubled for all classes of filers by the 2017 Tax Cuts and Jobs Act (TCJA) as an incentive for taxpayers not to itemize deductions when filing their federal income taxes. . In 2020, 9.5 percent of taxpayers itemized overall, but 64 percent of taxpayers with adjusted gross incomes (AGIs) of $500,000 or more itemized, per IRS data. Consequently, high-income counties find the SALT deduction particularly beneficial, even with the existing cap.
Second, the disparities in state and local tax burdens nationwide affect the regional uptake of SALT deductions. Regions with higher state and local taxes tend to benefit the most from the SALT deduction.
One way to consider how the $10,000 cap impacts counties is to compare the difference between how much SALT is reported and how much is deducted. The first table below shows the top 10 counties for reporting state and local taxes paid, while the second table shows the top 10 counties for deducting state and local taxes paid.
The top reporting counties are concentrated in California and New York, with one jurisdiction each from Colorado, Connecticut, Idaho, and Wyoming. They tend to be in high-tax states and localities. The actual SALT deductions taken were much lower than SALT reported because of the $10,000 cap.
Top 10 Counties for State and Local Taxes Reported on Federal Tax Returns, 2020
| County, State | SALT Reported per Filer | SALT Deduction Claimed per Filer |
|---|---|---|
| San Mateo County, CA | $18,345 | $2,071 |
| Marin County, CA | $18,046 | $2,588 |
| New York County, NY | $16,486 | $1,327 |
| San Francisco County, CA | $12,510 | $1,477 |
| Santa Clara County, CA | $12,140 | $1,859 |
| Pitkin County, CO | $11,785 | $1,443 |
| Blaine County, ID | $10,165 | $1,297 |
| Westchester County, NY | $9,967 | $1,729 |
| Teton County, WY | $9,839 | $1,348 |
| Fairfield County, CT | $9,678 | $1,720 |
Source: Internal Revenue Service, “Statistics of Income Tax Stats – County Data – 2020, ‘2020 (all States, includes AGI),’” https://www.irs.gov/statistics/soi-tax-stats-county-data-2020, author’s calculations.
The top deducting counties are concentrated in the Washington, D.C., metro area. The counties tend to be places with higher median household incomes and higher state and local taxes. For example, the D.C. metro area has some of the highest median household incomes in the country. While there may not be as many top earners as in places like San Francisco County or New York County, there are many itemizing filers who earn above-average incomes and deduct SALT.
Top 10 Counties for State and Local Tax Deductions Claimed, 2020
| County, State | SALT Reported per Filer | SALT Deduction Claimed per Filer |
|---|---|---|
| Falls Church City, VA | $8,755 | $2,820 |
| Loudoun County, VA | $5,485 | $2,617 |
| Marin County, CA | $18,046 | $2,588 |
| Howard County, MD | $6,142 | $2,461 |
| Charles County, MD | $3,567 | $2,435 |
| Fairfax County, VA | $5,441 | $2,226 |
| Calvert County, MD | $3,814 | $2,217 |
| Morgan County, UT | $4,384 | $2,095 |
| Montgomery County, MD | $6,191 | $2,077 |
| San Mateo County, CA | $18,345 | $2,070 |
Source: Internal Revenue Service, “Statistics of Income Tax Stats – County Data – 2020, ‘2020 (all States, includes AGI),’” https://www.irs.gov/statistics/soi-tax-stats-county-data-2020, author’s calculations.
We can also narrow the measure to look only at itemizing taxpayers, excluding taxpayers who took the standard deduction and did not claim any SALT. Among the top 10 counties, SALT claimed by itemizers comes close to the $10,000 cap but does not reach it. The average amount claimed is less than $10,000 because some itemizing taxpayers take other itemized deductions like mortgage interest and charitable contributions rather than a full deduction for SALT.
Comparing SALT reported and SALT deducted per itemizing taxpayer further underscores how the $10,000 cap diminishes the deduction’s value in higher-income, higher-tax counties.
Top 10 Counties for State and Local Tax Deductions Claimed per Itemizing Taxpayer, 2020
| County, State | SALT Reported per Itemizing Filer | SALT Deduction Claimed per Itemizing Filer |
|---|---|---|
| Nassau County, NY | $32,687 | $9,382 |
| Putnam County, NY | $25,238 | $9,320 |
| Falls Church City, VA | $28,920 | $9,315 |
| Santa Clara County, CA | $60,756 | $9,304 |
| Bergen County, NJ | $33,050 | $9,287 |
| Fairfield County, CT | $52,168 | $9,270 |
| Morris County, NJ | $33,137 | $9,255 |
| Suffolk County, NY | $27,709 | $9,246 |
| Hunterdon County, NJ | $26,222 | $9,229 |
| San Mateo County, CA | $81,508 | $9,200 |
Source: Internal Revenue Service, “Statistics of Income Tax Stats – County Data – 2020, ‘2020 (all States, includes AGI),’” https://www.irs.gov/statistics/soi-tax-stats-county-data-2020, author’s calculations.
We can also explore how patterns of SALT reported versus deducted vary with income across different states (see attached table on 2020 SALT data by AGI). IRS data indicates that as income rises, both the reporting and deducting of SALT generally increase but the magnitudes differ across states.
For example, for itemizers with incomes exceeding $200,000, the average SALT reported by itemizers is highest in New York ($103,575), Connecticut ($79,344), and California ($78,246). In contrast, states such as Washington ($17,901), Tennessee ($16,594), and Alaska ($11,305) record lower average reported SALT among itemizers (partly because the latter three states levy no state income tax). These trends generally align with the patterns observed at the county level across all income levels.
The benefits of the SALT deduction have evolved since the introduction of the cap in 2018. Under the $10,000 cap and the larger standard deduction, it is primarily higher-income taxpayers in higher-tax locations who still benefit from the limited deduction for state and local taxes. Any move to repeal the cap or enhance the deduction would disproportionately benefit higher earners, making the tax code more regressive.
Stay informed on the tax policies impacting you.
Subscribe to get insights from our trusted experts delivered straight to your inbox.
Subscribe