Every year, millions of Americans pack up and move from one state to another, providing unique insights into what people value when deciding where to live, work, and raise a family. For many years, policymakers, journalists, and taxpayers have debated the role state taxA tax is a mandatory payment or charge collected by local, state, and national governments from individuals or businesses to cover the costs of general government services, goods, and activities. policy plays in individuals’ and businesses’ location decisions. Annual data about who is moving—and where—provide clues about the factors contributing to these moves.
Taxes are one such factor. The latest IRS and Census data show that people and businesses favor states with low and structurally sound tax systems, which can impact the state’s economic growth and governmental coffers.
Each year, the IRS releases migration data showing the movements of income taxpayers based on changes in their mailing address between filing one year’s income tax return and the next. The most recent data generally show location changes that occurred between when taxpayers filed their tax year 2018 returns in calendar year 2019 and when they filed their tax year 2019 returns in calendar year 2020. Notably, because the filing deadline in 2020 was extended by three months due to the COVID-19 pandemic, the most recent data capture more moves than usual because many taxpayers went 15 months, rather than the typical 12, between filing returns for tax years 2018 and 2019.
These data, therefore, capture many of the interstate moves made early in the pandemic—between mid-March and mid-July 2020—but do not necessarily capture the bulk of pandemic-related moves, many of which occurred later in 2020 and even into 2021. As such, when interpreting these data, it is important to keep in mind that many of these moves happened before the even more pronounced shift away from large cities and high cost-of-living areas that occurred during the pandemic.
Non-governmental datasets, including from U-Haul and United Van Lines, have the advantage of being especially timely, shedding light on moves that occurred even more recently, but the IRS data are by default more comprehensive and provide important insights into the movement of adjusted gross income (AGI) among states.
Winners and Losers of Interstate Migration
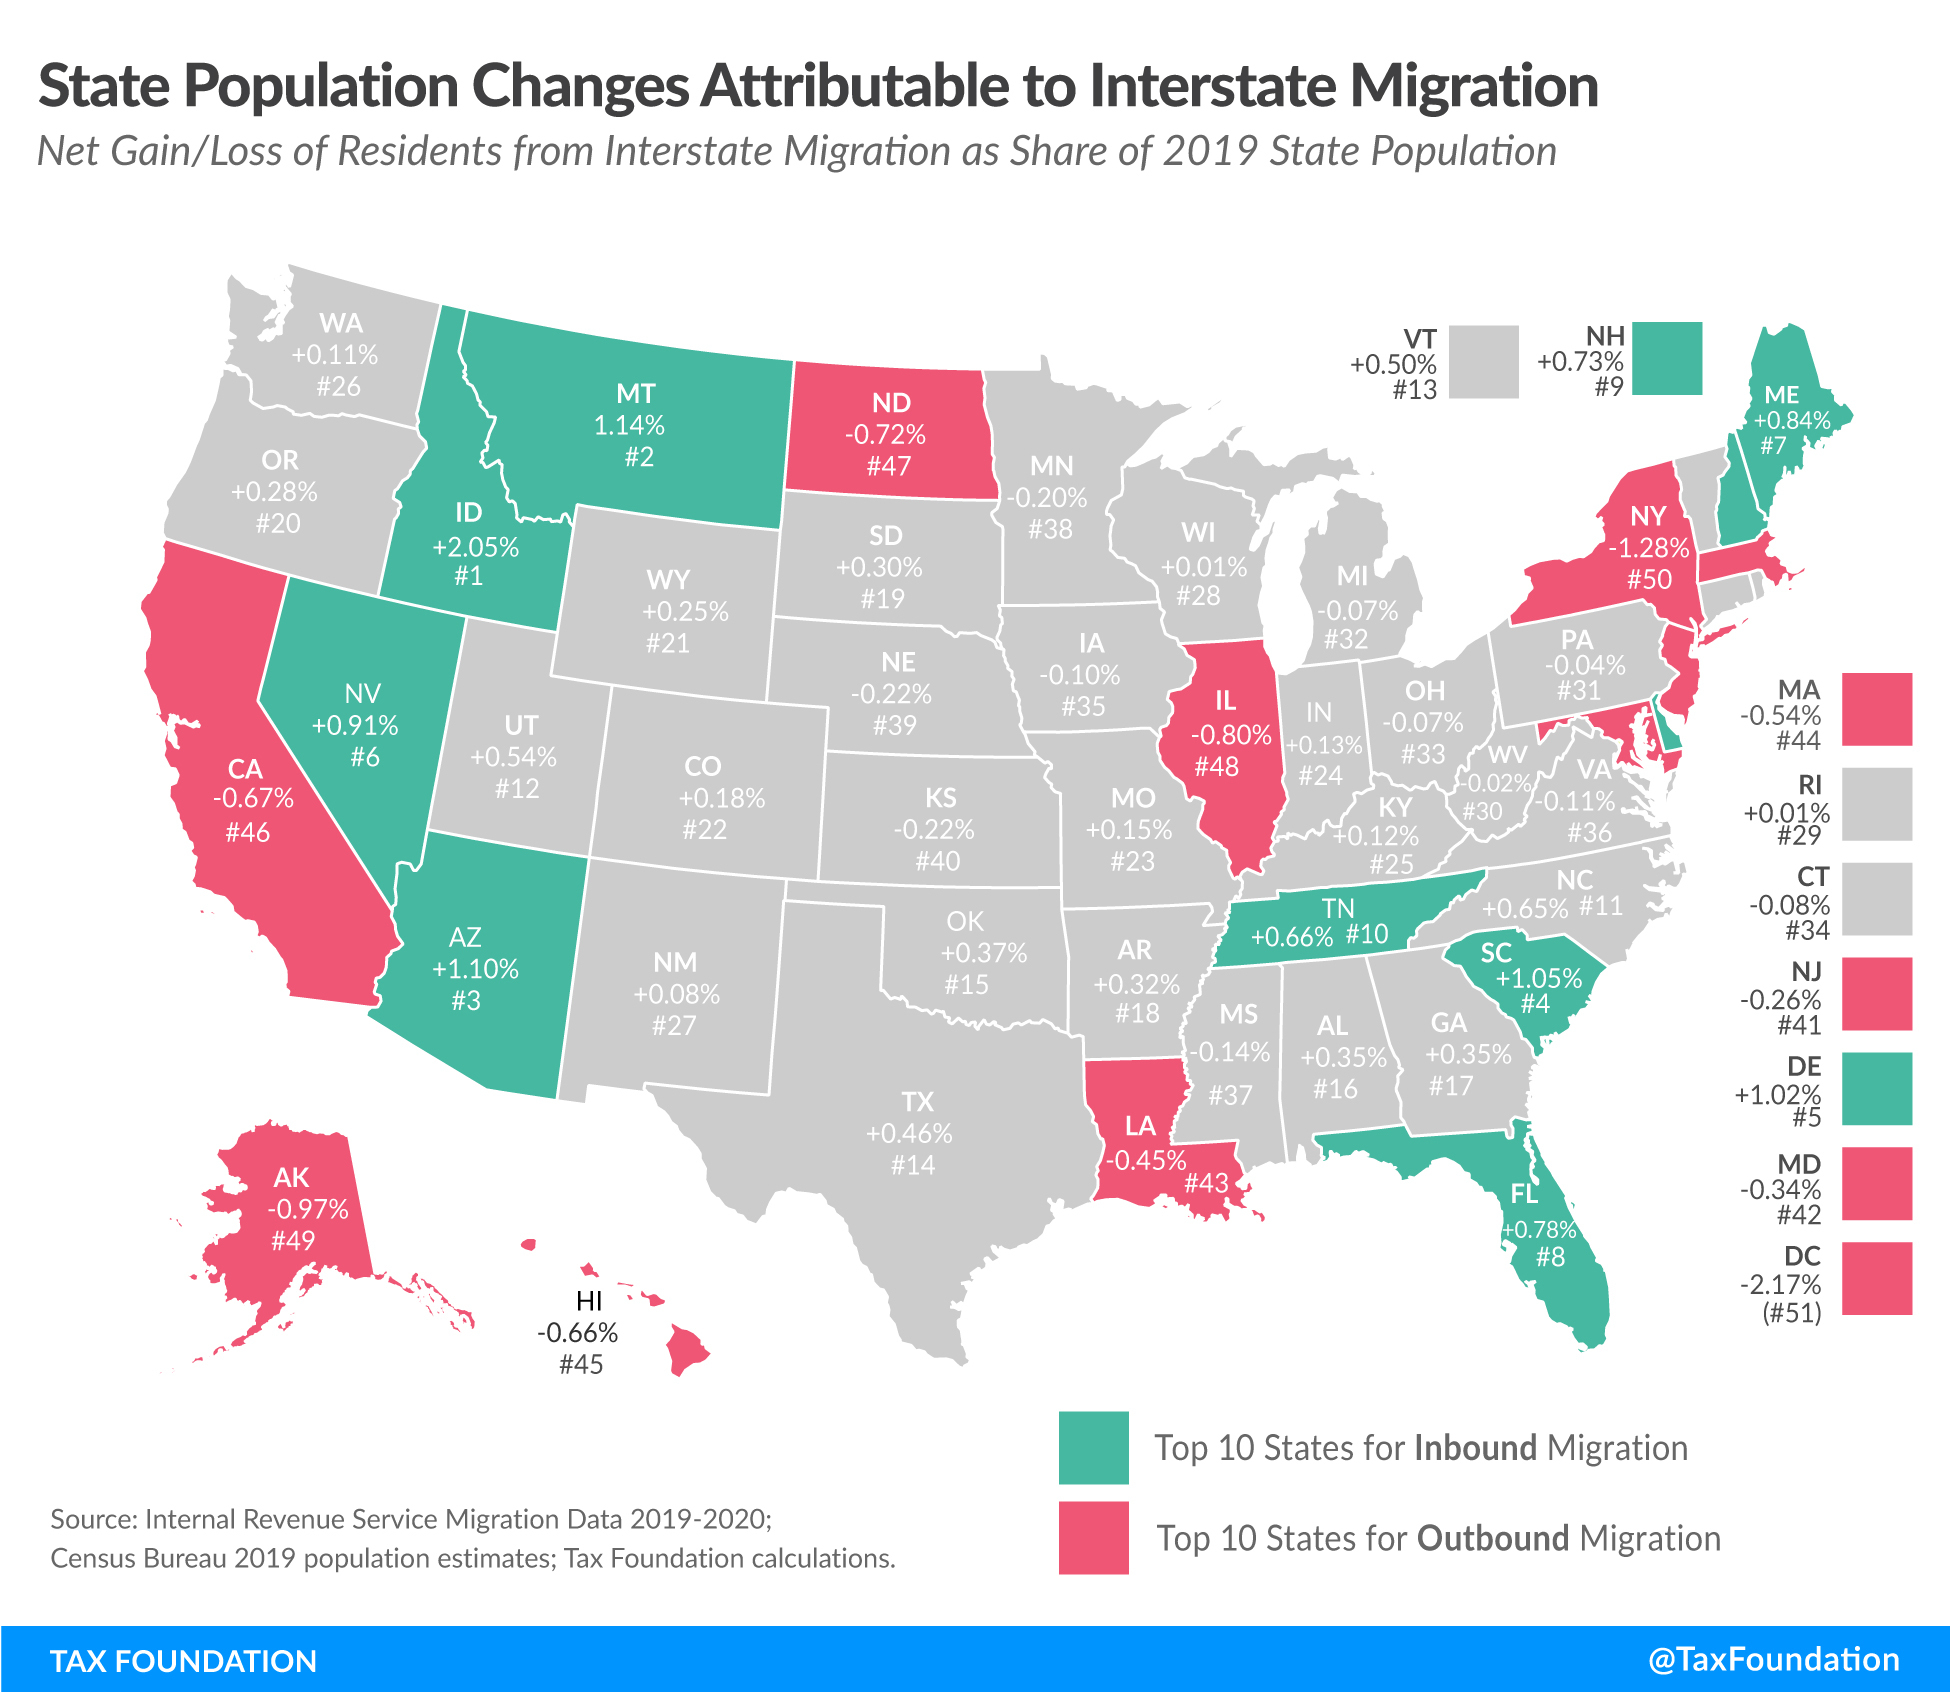
The IRS data show that between 2019 and 2020, 28 states experienced a net gain in income tax filers from interstate migration—led by Florida, Texas, Arizona, North Carolina, and South Carolina—while 22 states and the District of Columbia experienced a net loss—led by New York, California, Illinois, Massachusetts, and New Jersey. When all individuals associated with each tax return are accounted for, including spouses and dependents, 29 states experienced a net gain in individuals while 21 states and D.C. experienced a net loss. Only one state, Wisconsin, saw a loss in tax returns attributable to interstate migration but a gain in individuals associated with the returns of those who moved in.
The map and table below show states’ gains and losses in resident population, income tax returns filed, and AGI attributable to interstate migration.
Many factors influence an individual’s or family’s decision to move from one state to another—employment or educational opportunities, proximity to family or friends, and geographic and lifestyle preferences like weather, natural landscape, and population density, to name a few. Cost-of-living considerations, including tax differentials, may not be the primary reason for an interstate move, but they are often one of several factors people consider when deciding whether—and where—to move.
More Americans Moved to States with Lower Taxes and Sound Tax Structures
With this in mind, one observation from the 2019-2020 IRS migration data is that a strong positive relationship exists between state tax competitiveness and inbound migration. Overall, states with lower taxes and sound tax structures experienced stronger inbound migration than states with higher taxes and more burdensome structures.
Of the 10 states that experienced the largest gains in income taxpayers, five do not levy individual income taxes on wage or salary income at all, and two others had top marginal individual income taxAn individual income tax (or personal income tax) is levied on the wages, salaries, investments, or other forms of income an individual or household earns. The U.S. imposes a progressive income tax where rates increase with income. The Federal Income Tax was established in 1913 with the ratification of the 16th Amendment. Though barely 100 years old, individual income taxes are the largest source rates that were below the national median at the time. Recently, those states have grown even more competitive. Nine of the top 10 states either forgo individual income taxes on wage and salary income, have a flat income tax, or are moving to a flat income tax.
Additionally, among the 28 states that experienced net inbound migration of income tax filers, only nine had a top marginal individual income tax rate above the national median. Meanwhile, among the 22 states (and the District of Columbia) that experienced net outbound migration of income tax filers, 15 states and D.C. had top marginal rates above the median. In the aggregate, states with a top marginal rate at or below the 2019 median of 5.4 percent gained 225,000 net new residents from the states with rates above the median.
A robust positive relationship also exists between states with below-average state and local tax collections per capita and those experiencing strong inbound migration. Of the 28 states that saw a net gain in income tax filers due to interstate migration, 22 had below-average state and local tax collections per capita in fiscal year 2020, while half of the states that experienced net outbound migration had above-average collections per capita.
Furthermore, a strong positive relationship exists between states with well-structured tax codes and those that experience net inbound migration. Among the 25 best ranking states on the 2020 State Business Tax Climate Index, which had a snapshot date of July 1, 2019, 20 states experienced net inbound migration between 2019 and 2020. Meanwhile, among the 25 worst ranking states on the Index, 17 experienced a net loss of taxpayers to interstate migration.
Why Interstate Migration Matters
One reason policymakers should care about their state’s interstate migration patterns is the effect of interstate migration on tax revenue, economic output, and economic growth over time. Between 2019 and 2020, most states that experienced a net loss in income tax filers attributable to interstate migration also experienced a net loss in income associated with interstate migration, while most states that gained taxpayers also experienced corresponding gains in AGI.
Hawaii was the only state to lose residents on net yet experience a net gain in AGI, with new residents bringing in an average of $75,000 in AGI per return while departing residents had an average of $64,000 per return. Meanwhile, only three states—Indiana, Kentucky, and Missouri—saw a net gain in income tax filers but a net loss in AGI, with new residents earning less on average than the people who moved out. Some of this is due to cost-of-living adjustments that tend to occur when individuals leave employment in one state for employment in another. For example, even if their job duties are substantially similar, a registered nurse employed in a high-cost-of-living state is likely to have a higher salary than one employed in a lower-cost-of-living state due to cost-of-living considerations that affect market rate earnings in different parts of the country.
There is evidence, however, that in states like Hawaii, the loss of relatively lower-income residents is somewhat attributable to high taxes and high costs of living causing lower- and middle-income residents to seek more affordable destinations elsewhere. Notably, four of the top five states Hawaii residents moved to—Washington, Texas, Nevada, and Florida—forgo individual income taxes on wage income. Likewise, some of the gain of relatively lower-income residents in Indiana, Kentucky, and Missouri is likely due to the relatively low cost of living in those states compared to other locations. Crucially for economic growth, however, a low tax environment also encourages investment and entrepreneurial decision-making and attracts highly mobile higher earners as well.
Higher-Income Residents Moved to Low-Tax States
The IRS data also show interstate migration broken down by AGI level. Among taxpayers with $200,000 or more in AGI, the top destinations for inbound interstate moves were Florida, Texas, Arizona, North Carolina, and South Carolina. Meanwhile, the states that saw the largest losses of taxpayers with $200,000 or more in AGI were New York, California, Illinois, Massachusetts, and Virginia. Several of the states losing higher-income taxpayers, especially New York, California, and New Jersey, have highly progressive tax codes under which tax liability rises steeply with income. States that structure their tax codes in this manner have consistently lost higher-income residents to lower-tax states, and not only the residents, but also any associated tax revenue and entrepreneurial activity that goes along with them.
Sometimes taxpayers choose to move to a lower-tax state at least in part to reduce their own tax burden. But even those who do not consciously select for lower taxes may be doing so indirectly when they prioritize job opportunities and other factors related to the state’s economic competitiveness.
While taxes are just one factor influencing the location decisions of individuals and businesses, they are an important factor—and one within policymakers’ control. States that prioritize structurally sound tax policy improvements will reap the economic benefits that come with creating an attractive fiscal landscape in which all individuals and businesses have the opportunity to thrive.
| State | Tax Returns Gain/Loss | Tax Returns Gain/Loss Rank | Individuals Gain/Loss | Individuals Gain/Loss Rank | AGI Gain/Loss | AGI Gain/Loss Rank | Population Change | Population Change Rank | AGI Change | AGI Change Rank | 2020 Index Rank | Rate Below/Above Median | Tax Collections Per Capita | Tax Collections Per Capita Rank | Gain/Loss of Returns with $200,000+ in AGI | Gain/Loss of Returns with $200,000+ in AGI Rank |
|---|---|---|---|---|---|---|---|---|---|---|---|---|---|---|---|---|
| Florida | 81,401 | 1 | 166,707 | 1 | $23,677,598,000 | 1 | 0.78% | 8 | 3.1% | 4 | 4 | No Tax | $4,065 | 45 | 20,263 | 1 |
| Texas | 62,667 | 2 | 133,450 | 2 | $6,346,965,000 | 2 | 0.46% | 14 | 0.7% | 19 | 13 | No Tax | $4,781 | 29 | 5,356 | 2 |
| Arizona | 42,552 | 3 | 80,033 | 3 | $4,800,358,000 | 3 | 1.10% | 3 | 2.3% | 8 | 23 | Below | $4,079 | 44 | 5,268 | 3 |
| North Carolina | 36,086 | 4 | 68,174 | 4 | $3,644,174,000 | 4 | 0.65% | 11 | 1.2% | 14 | 11 | Below | $4,196 | 41 | 4,713 | 4 |
| South Carolina | 24,917 | 5 | 53,992 | 5 | $3,585,618,000 | 5 | 1.05% | 4 | 2.5% | 5 | 30 | Above | $4,043 | 46 | 3,967 | 5 |
| Tennessee | 21,758 | 6 | 45,102 | 6 | $2,642,938,000 | 6 | 0.66% | 10 | 1.3% | 12 | 18 | Interest and dividends income only | $3,768 | 50 | 2,743 | 6 |
| Georgia | 17,338 | 7 | 37,074 | 7 | $1,112,905,000 | 12 | 0.35% | 17 | 0.4% | 23 | 32 | Above | $4,117 | 43 | 570 | 17 |
| Nevada | 16,380 | 8 | 28,073 | 9 | $2,619,471,000 | 7 | 0.91% | 6 | 2.4% | 6 | 7 | No Tax | $4,853 | 28 | 2,331 | 8 |
| Idaho | 15,300 | 9 | 36,655 | 8 | $2,054,013,000 | 9 | 2.05% | 1 | 4.0% | 1 | 20 | Above | $4,212 | 40 | 2,055 | 9 |
| Washington | 13,437 | 10 | 8,155 | 22 | $1,224,248,000 | 11 | 0.11% | 26 | 0.4% | 22 | 16 | No Tax | $6,239 | 13 | 903 | 15 |
| Colorado | 12,892 | 11 | 10,209 | 16 | $2,321,646,000 | 8 | 0.18% | 22 | 1.0% | 15 | 21 | Below | $5,693 | 17 | 2,624 | 7 |
| Oregon | 9,515 | 12 | 11,645 | 14 | $600,019,000 | 18 | 0.28% | 20 | 0.4% | 20 | 8 | Above | $5,231 | 24 | 1,026 | 13 |
| Alabama | 7,084 | 13 | 17,135 | 11 | $511,410,000 | 19 | 0.35% | 16 | 0.4% | 21 | 40 | Below | $3,849 | 49 | 425 | 19 |
| Utah | 6,810 | 14 | 17,157 | 10 | $1,260,634,000 | 10 | 0.54% | 12 | 1.3% | 13 | 9 | Below | $4,572 | 31 | 1,503 | 10 |
| Maine | 6,336 | 15 | 11,274 | 15 | $870,092,000 | 15 | 0.84% | 7 | 2.1% | 9 | 28 | Above | $6,506 | 11 | 1,049 | 12 |
| Oklahoma | 5,797 | 16 | 14,792 | 12 | $74,378,000 | 25 | 0.37% | 15 | 0.1% | 26 | 27 | Below | $4,171 | 42 | 22 | 29 |
| Montana | 5,481 | 17 | 12,189 | 13 | $1,050,293,000 | 13 | 1.14% | 2 | 3.2% | 3 | 5 | Above | $4,543 | 32 | 943 | 14 |
| New Hampshire | 5,309 | 18 | 9,905 | 18 | $958,824,000 | 14 | 0.73% | 9 | 1.7% | 11 | 6 | Interest and dividends income only | $5,200 | 25 | 1,064 | 11 |
| Delaware | 5,117 | 19 | 9,913 | 17 | $752,648,000 | 17 | 1.02% | 5 | 2.3% | 7 | 15 | Above | $5,968 | 14 | 895 | 16 |
| Arkansas | 3,940 | 20 | 9,570 | 19 | $247,581,000 | 23 | 0.32% | 18 | 0.3% | 24 | 44 | Above | $4,328 | 37 | 239 | 25 |
| Missouri | 3,076 | 21 | 8,928 | 20 | ($194,982,000) | 30 | 0.15% | 23 | -0.1% | 29 | 14 | Median | $3,978 | 47 | (47) | 32 |
| New Mexico | 1,837 | 22 | 1,648 | 26 | $435,860,000 | 21 | 0.08% | 27 | 0.8% | 16 | 25 | Below | $5,046 | 26 | 348 | 22 |
| Kentucky | 1,814 | 23 | 5,419 | 23 | ($274,801,000) | 34 | 0.12% | 25 | -0.2% | 34 | 19 | Below | $4,364 | 36 | 58 | 28 |
| Vermont | 1,454 | 24 | 3,119 | 24 | $448,360,000 | 20 | 0.50% | 13 | 2.1% | 10 | 42 | Above | $6,642 | 9 | 570 | 18 |
| Indiana | 1,318 | 25 | 8,465 | 21 | ($214,359,000) | 31 | 0.13% | 24 | -0.1% | 30 | 10 | Below | $4,744 | 30 | (45) | 31 |
| South Dakota | 1,002 | 26 | 2,628 | 25 | $207,801,000 | 24 | 0.30% | 19 | 0.7% | 18 | 2 | No Tax | $4,478 | 34 | 205 | 26 |
| Wyoming | 397 | 27 | 1,460 | 27 | $862,770,000 | 16 | 0.25% | 21 | 3.8% | 2 | 1 | No Tax | $5,339 | 21 | 291 | 24 |
| Rhode Island | 332 | 28 | 59 | 29 | $297,619,000 | 22 | 0.01% | 29 | 0.8% | 17 | 38 | Above | $5,931 | 15 | 355 | 21 |
| Wisconsin | (371) | 29 | 507 | 28 | ($117,214,000) | 29 | 0.01% | 28 | -0.1% | 27 | 26 | Above | $5,332 | 22 | 318 | 23 |
| West Virginia | (491) | 30 | (335) | 30 | ($69,973,000) | 28 | -0.02% | 30 | -0.2% | 33 | 22 | Above | $4,272 | 39 | (103) | 35 |
| Nebraska | (2,303) | 31 | (4,218) | 34 | ($498,673,000) | 39 | -0.22% | 39 | -0.8% | 45 | 31 | Above | $5,731 | 16 | (167) | 38 |
| Iowa | (2,594) | 32 | (3,126) | 32 | ($285,180,000) | 35 | -0.10% | 35 | -0.3% | 36 | 45 | Above | $5,492 | 20 | (137) | 36 |
| North Dakota | (2,692) | 33 | (5,484) | 36 | ($262,349,000) | 32 | -0.72% | 47 | -1.0% | 46 | 17 | Below | $7,713 | 4 | (166) | 37 |
| Mississippi | (2,752) | 34 | (4,052) | 33 | ($52,754,000) | 27 | -0.14% | 37 | -0.1% | 28 | 29 | Below | $3,944 | 48 | 7 | 30 |
| Alaska | (2,805) | 35 | (7,118) | 39 | ($286,268,000) | 36 | -0.97% | 49 | -1.1% | 48 | 3 | No Tax | $4,528 | 33 | (308) | 40 |
| Connecticut | (2,947) | 36 | (3,003) | 31 | ($273,281,000) | 33 | -0.08% | 34 | -0.2% | 32 | 47 | Above | $8,531 | 2 | 123 | 27 |
| Hawaii | (3,152) | 37 | (9,336) | 41 | $70,821,000 | 26 | -0.66% | 45 | 0.1% | 25 | 39 | Above | $7,671 | 5 | 425 | 20 |
| Pennsylvania | (3,344) | 38 | (4,866) | 35 | ($1,197,455,000) | 42 | -0.04% | 31 | -0.3% | 35 | 33 | Below | $5,635 | 19 | (704) | 41 |
| Virginia | (3,795) | 39 | (9,549) | 42 | ($1,094,050,000) | 41 | -0.11% | 36 | -0.3% | 38 | 24 | Above | $5,660 | 18 | (2,099) | 46 |
| Kansas | (3,861) | 40 | (6,489) | 37 | ($294,660,000) | 37 | -0.22% | 40 | -0.3% | 37 | 35 | Above | $5,250 | 23 | (76) | 34 |
| Minnesota | (6,238) | 41 | (11,307) | 43 | ($1,208,676,000) | 43 | -0.20% | 38 | -0.6% | 41 | 46 | Above | $6,585 | 10 | (952) | 43 |
| Michigan | (6,755) | 42 | (6,858) | 38 | ($388,579,000) | 38 | -0.07% | 32 | -0.1% | 31 | 12 | Below | $4,297 | 38 | (68) | 33 |
| Ohio | (7,187) | 43 | (8,204) | 40 | ($1,446,342,000) | 44 | -0.07% | 33 | -0.4% | 39 | 37 | Below | $4,899 | 27 | (889) | 42 |
| D.C. | (8,002) | 44* | (15,330) | 44* | ($1,440,199,000) | 44* | -2.17% | 51* | -3.9% | 51* | 47* | Above | $11,809 | 1* | (1,730) | 44* |
| Louisiana | (9,836) | 44 | (21,029) | 45 | ($573,302,000) | 40 | -0.45% | 43 | -0.5% | 40 | 43 | Above | $4,412 | 35 | (228) | 39 |
| Maryland | (10,163) | 45 | (20,309) | 44 | ($1,853,927,000) | 45 | -0.34% | 42 | -0.8% | 44 | 41 | Above | $6,953 | 8 | (1,828) | 44 |
| New Jersey | (12,798) | 46 | (23,272) | 46 | ($2,323,303,000) | 46 | -0.26% | 41 | -0.6% | 42 | 50 | Above | $7,917 | 3 | (1,833) | 45 |
| Massachusetts | (20,395) | 47 | (36,982) | 47 | ($2,551,512,000) | 47 | -0.54% | 44 | -0.7% | 43 | 34 | Below | $7,401 | 6 | (2,116) | 47 |
| Illinois | (50,769) | 48 | (100,921) | 48 | ($8,461,854,000) | 48 | -0.80% | 48 | -1.7% | 49 | 36 | Below | $6,457 | 12 | (8,044) | 48 |
| California | (117,475) | 49 | (263,344) | 50 | ($17,815,116,000) | 49 | -0.67% | 46 | -1.1% | 47 | 48 | Above | $6,999 | 7 | (19,229) | 49 |
| New York | (130,622) | 50 | (248,305) | 49 | ($19,500,234,000) | 50 | -1.28% | 50 | -2.2% | 50 | 49 | Above | $10,304 | 1 | (19,912) | 50 |
|
Note: “Population change” shows gain/loss of individuals as share of state’s 2019 population estimate. “AGI change” shows AGI gain/loss as share of 2019 state AGI. “2020 Index rank” shows 2020 State Business Tax Climate Index rank (backcast). “Top marginal rate” shows state’s top marginal individual income tax rate as of January 1, 2019. “Tax collections per capita” shows FY 2020 state and local tax collections as share of state population estimate as of July 1, 2019. D.C’s rank does not affect states’ ranks but shows where it would rank if included. Source: Internal Revenue Service Migration Data 2019-2020; Census Bureau 2019 Population Estimates; Tax Foundation calculations. |
||||||||||||||||
Stay informed on the tax policies impacting you.
Subscribe to our free newsletter to get the latest tax data, news and analysis.
Subscribe