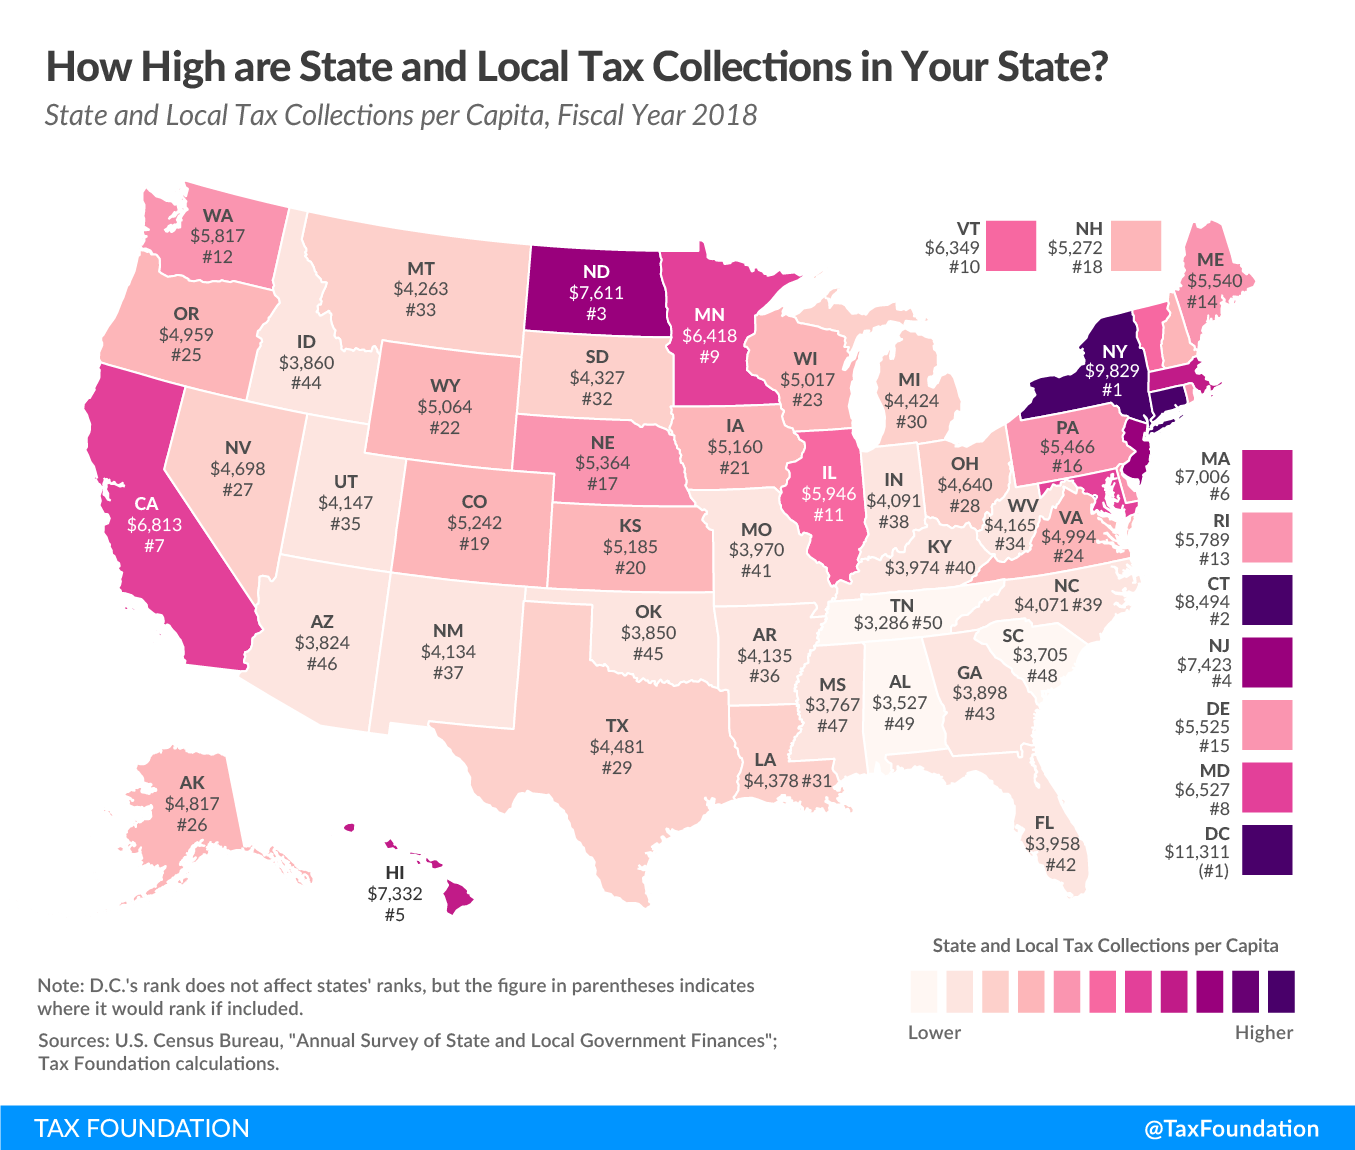
Although Tax Day has been pushed back this year, mid-April is still a good occasion to take a look at taxA tax is a mandatory payment or charge collected by local, state, and national governments from individuals or businesses to cover the costs of general government services, goods, and activities. collections in the United States. Because differing state populations can make overall comparisons difficult, today’s state tax map shows state and local tax collections per capita in each of the 50 states and the District of Columbia as of fiscal year 2018 (the most recent data available).
Tax collections of $11,311 per capita in the District of Columbia surpass those in any state. The five states with the highest tax collections per capita are New York ($9,829), Connecticut ($8,494), North Dakota ($7,611), New Jersey ($7,423), and Hawaii ($7,332). The five states with the lowest tax collections per capita are Tennessee ($3,286), Alabama ($3,527), South Carolina ($3,705), Mississippi ($3,767), and Arizona ($3,824).
Some of these results are less intuitive than others. For example, even though North Dakota ranks third for state and local tax collections, the resource-rich state generates a substantial part of its tax revenue from severance taxes on oil and natural gas, which are borne mainly by consumers outside North Dakota. As a result, North Dakota joins the ranks of high-tax states in terms of per capita collections even though the tax burden on North Dakotans is comparatively low.
It’s worth noting that severance taxes are only one of many examples of the “tax exporting” that states engage in. Travel taxes—such as hotel, car rental, and meal taxes—also disproportionately impact nonvoting nonresidents who have few means of redress. As a result, states that generate substantial amounts of tax revenue from tourism may also show tax collections per capita that are significantly higher than the actual tax burden that falls on the in-state population. Taxes on businesses may also be exported, at least in part, to investors across the country, and to employees wherever they are located. It is important to keep both legal incidence and economic incidence in mind when evaluating the true costs of any tax.
Note: This map is part of a series on state and local tax collections per capita.
Facts and Figures: How Does Your State Compare?
Share this article