Key Findings
- Taxpayers reported $10.4 trillion of total income on their 2016 taxA tax is a mandatory payment or charge collected by local, state, and national governments from individuals or businesses to cover the costs of general government services, goods, and activities. returns.
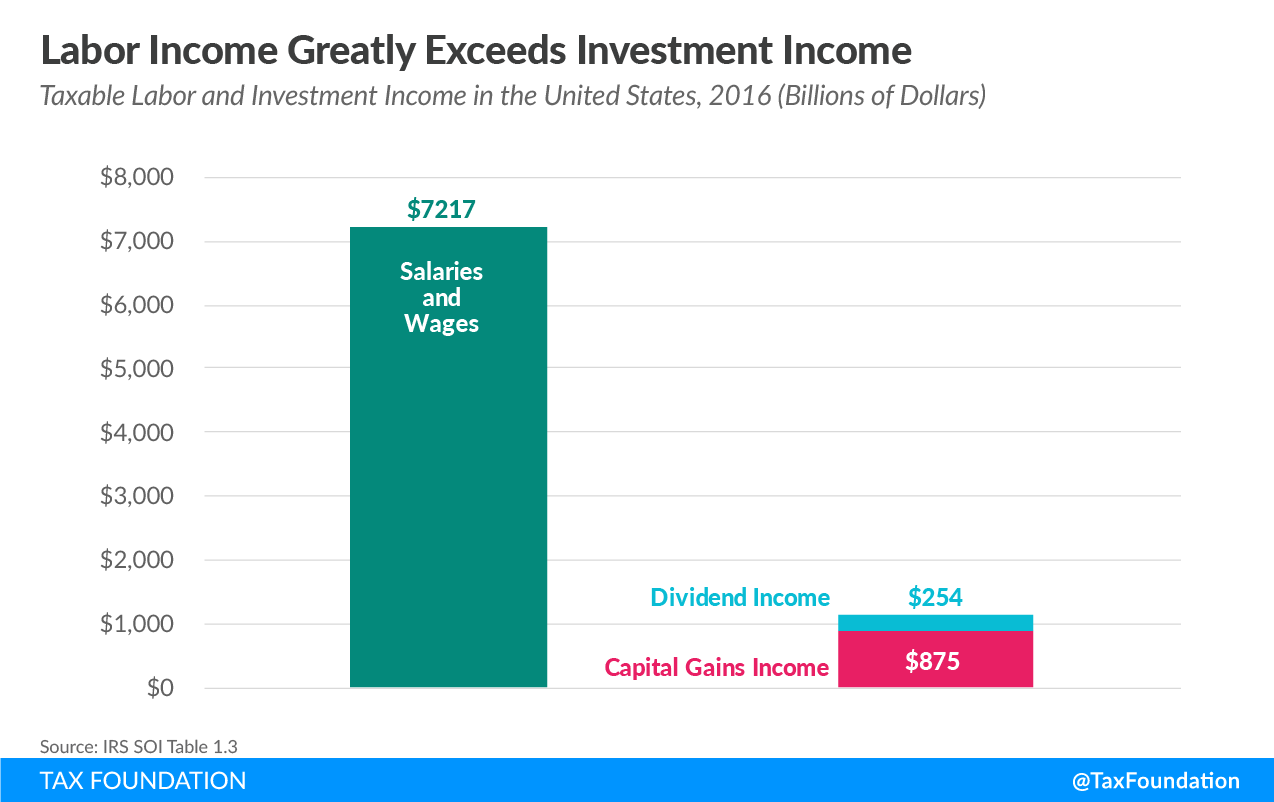
- Seventy percent ($7.2 trillion) of total income reported on the 1040 consists of wages and salaries, and about 83 percent of all tax filers report wage income.
- Pensions and retirement accounts are an important source of capital income for the middle class. Pensions and annuities ($694 billion), Individual Retirement Arrangement (IRA) distributions ($258 billion), and Social Security ($286 billion) combine to create $1.2 trillion in taxable retirement income.
- Business income is also a large component of reported personal income. Some businesses, like S corporations, sole proprietorships, or partnerships, file their taxes through the individual tax code, accounting for $1 trillion in personal income.
- Capital gains and dividends accounted for about $875 billion in income in 2016, less than income from business ($1 trillion) and retirement accounts ($913 billion).
Introduction
The individual income taxAn individual income tax (or personal income tax) is levied on the wages, salaries, investments, or other forms of income an individual or household earns. The U.S. imposes a progressive income tax where rates increase with income. The Federal Income Tax was established in 1913 with the ratification of the 16th Amendment. Though barely 100 years old, individual income taxes are the largest source of tax revenue in the U.S. is the federal government’s largest source of revenue. More than 150 million individual income tax returns were filed for tax year 2016,[1] and in each of these filings a household added up its income to report it to the Internal Revenue Service (IRS). The way the IRS individual income tax form (1040) is structured, all sources of income are listed on the first page of the form, and added up to reach “total income.” Then, the tax return moves on to calculating how much each household owes in taxes and determining deductions and credits.
This report will focus on sources of reported total income in 2016,[2] which totaled $10.4 trillion.[3] It will break down that income into its component parts, reported on lines 7 to 22 of the 2016 Form 1040. Going through the income reported in each category is valuable for understanding both the composition of the government’s revenue base and the way Americans earn their taxable incomeTaxable income is the amount of income subject to tax, after deductions and exemptions. For both individuals and corporations, taxable income differs from—and is less than—gross income. .[4]
This report divides income into four major categories–wages and salaries, business income, investment income, and retirement income–and reviews each of the four categories for tax year 2016.
| Income Type | Amount |
|---|---|
|
Note: *tax-free interest, such as interest on municipal bonds, adds another $61 billion. Source: IRS SOI Table 1.3 |
|
| Salaries and wages | $7,217 |
| Taxable pensions and annuities | $694 |
| Capital gains less losses | $621 |
| Partnership and S corporation net income | $629 |
| Business net income | $389 |
| Taxable Social Security benefits | $286 |
| Taxable Individual Retirement Arrangement (IRA) distributions | $258 |
| Ordinary dividends | $254 |
| Total rental and royalty net income | $98 |
| Taxable interest[1] | $97 |
Wages and Salaries Make Up 70 Percent of Total Income at $7.2 Trillion
For most tax filers in the U.S., the largest number on the 1040 comes on line 7, the very first line pertaining to income. On this line, taxpayers mark wages, salaries, tips, and other compensation for their work. Most Americans get that number from their W-2 forms, supplied by their employers. In total, nearly 125 million tax filers in 2016 reported $7.2 trillion in wage income, or 69.5 percent of all total income.
Most Americans report labor income, and most of their income comes from labor. This should not be a surprise; the U.S. is a nation of workers, and most of its economy is labor compensation. Any meaningful attempt to raise revenue through the income tax will almost necessarily include wages and salaries in the base, simply by virtue of the math: One cannot raise much income tax revenue by excluding 70 percent of income.
The amounts reported on the 1040 reflect most, but not all, labor compensation. Firms also pay for employee health benefits and make contributions to Social Security. Although neither of these is subject to the personal income tax, the IRS has a hand in both. The Patient Protection and Affordable Care Act will levy a “Cadillac TaxThe Cadillac Tax is a 40 percent tax on employer-sponsored health care coverage that exceeds a certain value. The aim: to curb health-care cost growth, reduce favorable tax treatment of employer-provided insurance, and help fund the Affordable Care Act (ACA). It was repealed in late 2019 before taking effect. ” on some health plans beginning in 2022, and the IRS administers the payroll taxA payroll tax is a tax paid on the wages and salaries of employees to finance social insurance programs like Social Security, Medicare, and unemployment insurance. Payroll taxes are social insurance taxes that comprise 24.8 percent of combined federal, state, and local government revenue, the second largest source of that combined tax revenue. through employer withholding.
Business Income Accounts for $1 Trillion of Personal Income
In the United States, the dominant tax filing structure for firms is as “pass-through” entities, so labeled because their income immediately passes through to individual owners’ tax returns using schedules C, E, and F. The U.S. Census Bureau has not yet released information on the percent of businesses using this structure in 2016, but in 2015, 92 percent of businesses used this structure, and the majority were sole proprietorships, fully owned by a single individual.[6] Pass-throughs employ most of the private-sector workforce in the U.S., and account for most of all business income.[7] Partnerships and S corporations accounted for $628 billion of net income in 2016, and individuals reported an additional $328 billion of business income, for a total of $956 billion.[8]
Investment Income Accounts for $913 Billion of Personal Income
Taxpayers reported $254 billion of taxable dividends in 2016, and $620 billion of net capital gains, only some of which come from sale of corporate stock.[9] Rhetoric about corporate income often exaggerates the impact of shareholder income on personal income and income inequality. Though the returns to corporate equity, as found on individual income tax returns, are substantial, they are much more modest than the rhetoric might suggest. While these amounts certainly matter, they are substantially smaller than the $7.2 trillion of labor income described above.
Taxable labor compensation greatly exceeds taxable investment income (Figure 1). This contradicts the notion that increasing taxes on investment income would have a substantial effect on the U.S. budget deficit; it is simply too small a portion of the economy.
Retirement Income Accounts for $1.2 Trillion, Mostly Benefiting the Middle Class
In 2016, taxpayers reported a total of $694 billion from pensions and annuities, and another $258 billion in taxable Individual Retirement Arrangement (IRA) distributions.[10] America’s system of retirement accounts, while overly complex, is taxed in a neutral way that removes the bias against saving. Notably, the income from retirement accounts is slightly above the capital gains and dividend income reported outside of retirement accounts.
It’s often hard to keep track of capital income in retirement accounts, especially because it doesn’t show up on IRS forms until it is distributed. Economists often struggle with categorizing it correctly. For example, the Congressional Budget Office (CBO) released a report in 2011 on trends in the distribution of income.[11] The report accounted for all the sources of income, including some nontaxable sources. It divided income into categories—largely the same kinds discussed in this report. However, it sorted pensions into a separate category from labor income and capital income. Pensions are, of course, in part compensation for labor. But by deferring their income for many years and having the fund invest it, workers also get a lot of capital income out of the deal—many multiples of their original contributions. While it’s impossible to allocate pension income precisely between labor and capital, it leans primarily to the capital side for most workers. The CBO report sorted retirement income into a category called “other.”
The CBO’s system of categorization was certainly defensible, but it can also leave a misleading impression. The report found that capital income–as defined on its terms–was very unevenly distributed; only the wealthiest Americans relied on it as a substantial source of income. It is important to remember this definition, though, and not conflate two ideas.
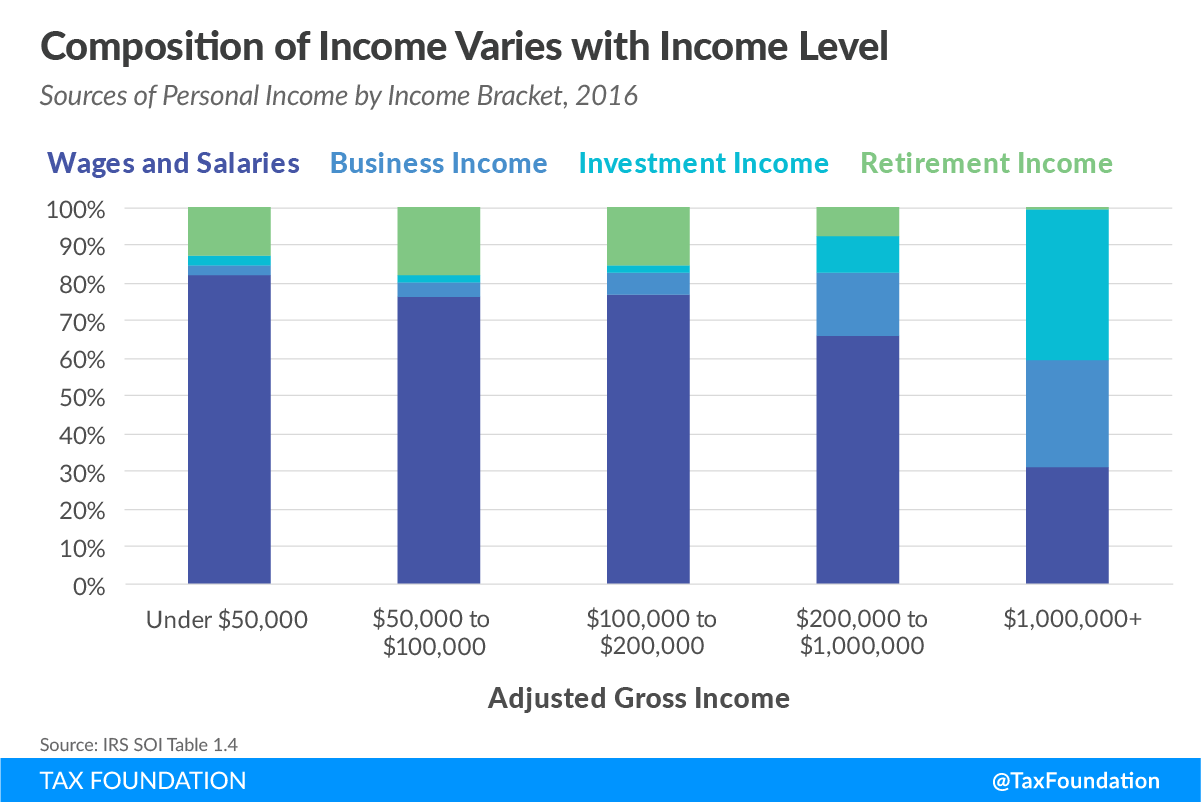
The first idea–that middle-class Americans don’t report many dividends or capital gains on their 1040s–is true. A second idea that would appear to follow logically–that middle-class Americans don’t earn substantial returns to capital–is false. Middle-class Americans wisely put their capital in retirement accounts–where it enjoys proper tax treatment–instead of keeping the money out of retirement accounts and subjecting it to poor tax treatment.
A look at the sources of personal income by income bracket shows the importance of retirement income to the middle class (Figure 2). Retirement income is most important as a source of personal income for taxpayers reporting between $50,000 and $100,000 of income, making up about 18 percent. In practice, of course, this means that a minority of middle-class taxpayers–the retirees–rely on this income quite a bit, while the majority, those of working age, do not.
Retirement income is difficult to account for, and the tax rules governing retirement accounts are not readily obvious to people unfamiliar with tax data. While pensions aren’t critical to every analysis of personal income, it is worth remembering a few things: pension income is, in economic terms, mostly a kind of capital income; it is about as important as any other kind of capital income; and it is most important to middle-class workers, given its employer-based structure.
Conclusion
Walking through sources of personal income reveals many things about our tax code and our economy in general. Our personal income tax is largely a tax on labor, primarily because our personal income largely comes from labor. However, varied sources of capital income are in the mix as well. While these sources, even when combined, are small compared to labor income, they are still significant and need to be accounted for well, both by policymakers trying to collect revenue efficiently and by economists or journalists attempting to understand the distribution of personal income.
| Wages and Salaries | Business Income | Investment Income | Retirement Income | |
|---|---|---|---|---|
|
Source: IRS SOI Table 1.4 |
||||
| Under $50,000 | $1,610 | $44 | $51 | $251 |
| $50,000 to $100,000 | $1,815 | $81 | $59 | $420 |
| $100,000 to $200,000 | $1,922 | $142 | $43 | $388 |
| $200,000 to $1,000,000 | $1,450 | $369 | $222 | $166 |
| $1,000,000 and Above | $420 | $382 | $537 | $11 |
| Income Type | 1990 | 1995 | 2000 | 2001 | 2002 | 2003 | 2004 | 2005 | 2006 | 2007 | 2008 | 2009 | 2010 | 2011 | 2012 | 2013 | 2014 | 2015 | 2016 |
|---|---|---|---|---|---|---|---|---|---|---|---|---|---|---|---|---|---|---|---|
| Source: IRS, Table A. Selected Income and Tax Items for Tax Years, 1990-2016, in Current Dollars. Note: Capital Gains includes net capital gain less loss and capital gain distributions reported on Form 1040. | |||||||||||||||||||
| Wages and Salaries | $2,599 | $3,201 | $4,456 | $4,565 | $4,560 | $4,650 | $4,922 | $5,155 | $5,469 | $5,842 | $5,951 | $5,707 | $5,837 | $6,055 | $6,301 | $6,475 | $6,785 | $7,112 | $7,217 |
| Taxable Interest | $227 | $155 | $199 | $198 | $149 | $127 | $125 | $162 | $223 | $268 | $223 | $168 | $140 | $120 | $112 | $101 | $94 | $96 | $97 |
| Tax-exempt Interest | $40 | $49 | $54 | $56 | $55 | $54 | $52 | $58 | $73 | $79 | $80 | $74 | $75 | $73 | $71 | $68 | $62 | $62 | $61 |
| Ordinary Dividends | $80 | $95 | $147 | $120 | $103 | $115 | $147 | $166 | $199 | $237 | $219 | $163 | $184 | $195 | $260 | $215 | $255 | $260 | $254 |
| Qualified Dividends | N/A | N/A | N/A | N/A | N/A | $81 | $111 | $119 | $137 | $156 | $159 | $124 | $136 | $142 | $204 | $158 | $192 | $203 | $202 |
| State Income Tax Refunds | $10 | $12 | $18 | $21 | $24 | $23 | $23 | $22 | $24 | $27 | $28 | $30 | $27 | $28 | $27 | $28 | $30 | $31 | $33 |
| Alimony | $4 | $4 | $6 | $7 | $7 | $6 | $7 | $8 | $8 | $9 | $9 | $9 | $9 | $9 | $9 | $9 | $10 | $10 | $10 |
| Sole Proprietorship | $141 | $169 | $214 | $217 | $221 | $230 | $247 | $270 | $282 | $280 | $264 | $245 | $267 | $283 | $304 | $302 | $317 | $332 | $328 |
| Capital Gains | $114 | $170 | $626 | $327 | $239 | $294 | $474 | $668 | $779 | $908 | $469 | $232 | $364 | $377 | $623 | $490 | $699 | $707 | $621 |
| Sale of Noncapital Property | $1 | ($3) | ($1) | ($2) | ($2) | $0 | $3 | $4 | $4 | $4 | ($8) | ($18) | ($18) | ($14) | ($9) | $1 | $9 | $12 | $6 |
| Total IRA Distributions | $35 | $60 | $138 | $119 | $120 | $121 | $131 | $147 | $166 | $190 | $216 | $179 | $291 | $263 | $272 | $261 | $279 | $295 | $300 |
| Taxable IRA Distributions | $18 | $37 | $99 | $94 | $88 | $88 | $102 | $112 | $125 | $148 | $162 | $135 | $194 | $217 | $231 | $214 | $235 | $253 | $258 |
| Total Pensions and Annuities | $214 | $311 | $552 | $533 | $561 | $565 | $628 | $685 | $781 | $852 | $845 | $823 | $881 | $911 | $975 | $1,048 | $1,111 | $1,169 | $1,108 |
| Taxable Pensions and Annuitites | $159 | $221 | $326 | $339 | $358 | $373 | $394 | $420 | $450 | $491 | $506 | $523 | $559 | $581 | $613 | $639 | $663 | $690 | $694 |
| S corporation, Partnership, Rent, Royalty, Estate, Trust | $75 | $149 | $252 | $268 | $278 | $296 | $357 | $447 | $466 | $453 | $418 | $385 | $446 | $486 | $613 | $614 | $679 | $713 | $706 |
| Farm | $0 | ($8) | ($9) | ($11) | ($14) | ($12) | ($13) | ($12) | ($15) | ($15) | ($15) | ($14) | ($12) | ($10) | ($6) | ($8) | ($8) | ($14) | $(18) |
| Unemployment Compensation | $15 | $19 | $17 | $27 | $43 | $44 | $33 | $28 | $27 | $29 | $44 | $84 | $120 | $92 | $71 | $52 | $33 | $27 | $25 |
| Total Social Security Benefits | $100 | $119 | $187 | $197 | $206 | $214 | $232 | $252 | $340 | $382 | $416 | $457 | $478 | $491 | $527 | $554 | $575 | $605 | $620 |
| Taxable Social Security Benefits | $20 | $46 | $90 | $94 | $93 | $98 | $110 | $125 | $144 | $167 | $168 | $175 | $191 | $202 | $224 | $243 | $261 | $277 | $286 |
| Gambling Earnings | N/A | $8 | $17 | $17 | $19 | $19 | $23 | $25 | $28 | $30 | $27 | $24 | $25 | $27 | $29 | $30 | $29 | $33 | $32 |
| Other | $18 | $16 | $25 | $20 | $19 | $21 | $23 | $27 | $30 | $36 | $34 | $31 | $35 | $34 | $37 | $37 | $39 | $40 | $38 |
| Total Personal Income | $3,439 | $4,230 | $6,424 | $6,231 | $6,111 | $6,295 | $6,887 | $7,532 | $8,145 | $8,811 | $8,384 | $7,739 | $8,208 | $8,498 | $9,234 | $9,234 | $9,916 | $10,360 | $10,379 |
[1] Internal Revenue Service, “SOI Tax Stats – Individual Income Tax Returns Publication 1304 (Complete Report),” Table 1.3, https://www.irs.gov/statistics/soi-tax-stats-individual-income-tax-returns-publication-1304-complete-report.
[2] Note that this data is from 2016, prior to the passage of the Tax Cuts and Jobs Act.
[3] IRS, SOI Table 1.3.
[4] There are limitations on using data from the 1040 to understand the nature of income in the U.S. economy. Not all economic activity finds its way to personal income tax forms—particularly, employer-provided health insurance and returns to owner-occupied housing. Both are substantial components of economic output that do not appear on income tax returns. As broad economic aggregates, though, the categories of income established on the 1040 are still useful and instructive.
[5] Tax-free interest, such as interest on municipal bonds, adds another $61 billion.
[6] U.S. Census Bureau, “County Business Patterns (CBP),” https://www.census.gov/programs-surveys/cbp.html, and Census Bureau, “Nonemployer Statistics (NES),” https://www.census.gov/programs-surveys/nonemployer-statistics.html. The Census Bureau 2016 County Business Patterns and Nonemployer Statistics Combined Report with the relevant numbers for 2016 will be released this fall.
[7] Kyle Pomerleau, “An Overview of Pass-through Businesses in the United States,” Tax Foundation, Jan. 21, 2015, https://taxfoundation.org/overview-pass-through-businesses-united-states.
[8] IRS, SOI Table 1.3.
[9] IRS, “SOI Tax Stats – Individual Income Tax Returns Publication 1304 (Complete Report).”
[10] IRS, SOI Table 1.3.
[11] Congressional Budget Office, “Trends in the Distribution of Household Income between 1979 and 2007,” Oct. 25, 2011, http://www.cbo.gov/sites/default/files/10-25-HouseholdIncome_0.pdf.
Share this article