Key Findings
- Pass-through businessA pass-through business is a sole proprietorship, partnership, or S corporation that is not subject to the corporate income tax; instead, this business reports its income on the individual income tax returns of the owners and is taxed at individual income tax rates. income is taxed on the business owners’ taxA tax is a mandatory payment or charge collected by local, state, and national governments from individuals or businesses to cover the costs of general government services, goods, and activities. returns through the individual income taxAn individual income tax (or personal income tax) is levied on the wages, salaries, investments, or other forms of income an individual or household earns. The U.S. imposes a progressive income tax where rates increase with income. The Federal Income Tax was established in 1913 with the ratification of the 16th Amendment. Though barely 100 years old, individual income taxes are the largest source of tax revenue in the U.S. code.
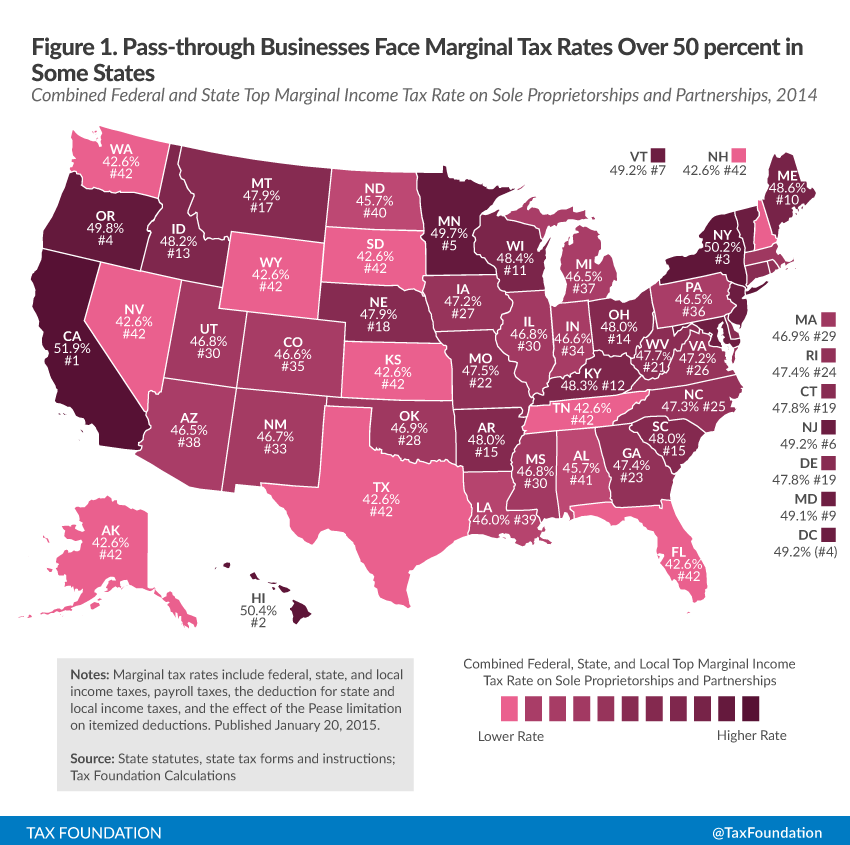
- Pass-through business income faces marginal tax rates that exceed 50 percent in some U.S. states.
- Pass-through businesses face only one layer of tax on their profits compared to the double taxationDouble taxation is when taxes are paid twice on the same dollar of income, regardless of whether that’s corporate or individual income. faced by C corporations.
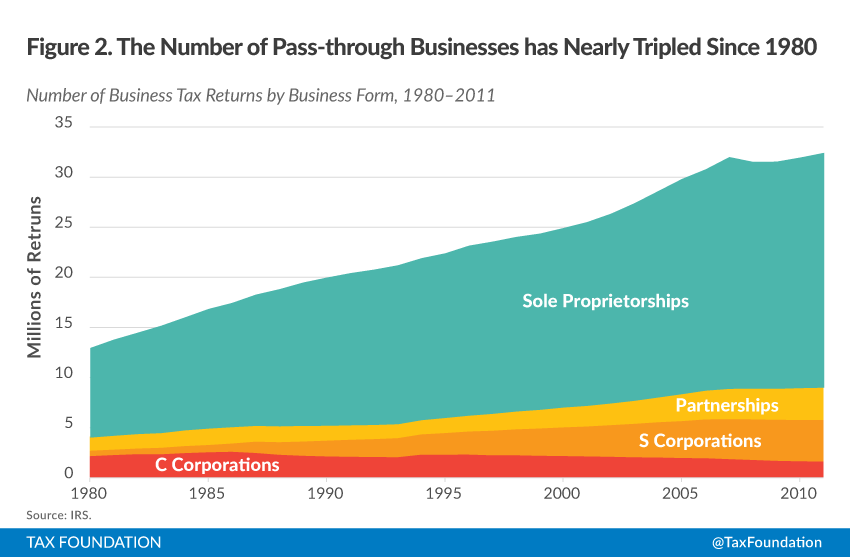
- The number of pass-through businesses has nearly tripled since 1980, while the number of traditional C corporations has declined.
- Pass-through businesses earn more net business income than C corporations.
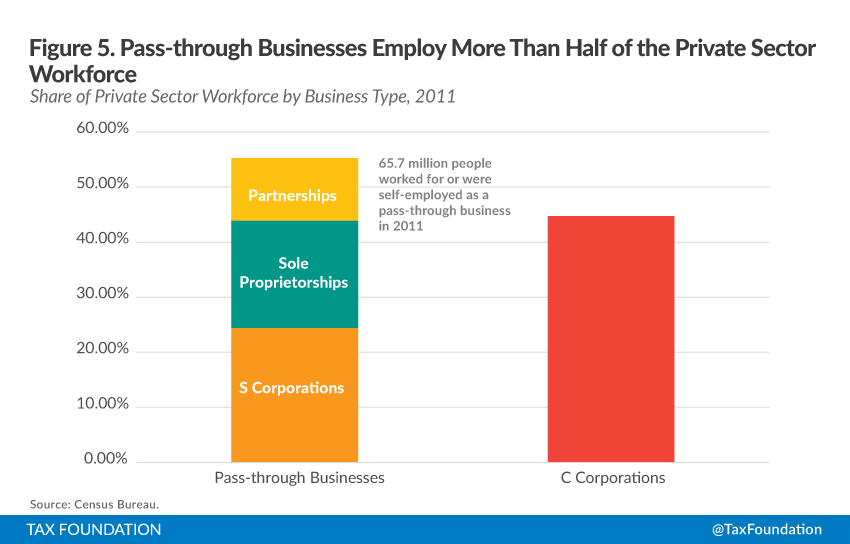
- Pass-through businesses employed more than 50 percent of the private sector work force and accounted for 37 percent of total private sector payroll in 2011.
- Although pass-through businesses are smaller than C corporations on average, they are not all small businesses. Many people work for large pass-through companies.
- The majority of pass-through business income is taxed at top individual tax rates.
- Tax reform aimed at improving the competitiveness of U.S. businesses needs to address the individual income tax code due to the economic importance of pass-through businesses.
Introduction
One of the goals of tax reform is to improve the competitiveness of U.S. businesses and grow the economy. A promising way to do that is by lowering taxes on saving and investment through business tax reform. Much time is devoted to improving the corporate side of the tax code, but corporate-only business tax reform misses a significant portion of business activity.
The United States currently has a large number of pass-through businesses, or businesses that pay their taxes through the individual income tax code rather than through the corporate code. These sole proprietorships, S corporations, and partnerships make up the vast majority of businesses and more than 60 percent of net business income in America. In addition, pass-through businesses account for more than half of the private sector workforce and 37 percent of total private sector payroll. Pass-through businesses are represented in all industries in the United States.
Given that pass-through businesses are a significant part of the U.S. economy, tax reform should address the individual income tax code along with the corporate tax code.
What Are Pass-through Businesses?
|
Table 1. Major Types of Pass-through Businesses |
|
|
Legal Form |
Description |
|
Sole Proprietorship |
An unincorporated business owned by a single individual that reports its income on schedule C of the 1040 tax form. |
|
Partnership |
An unincorporated business with multiple owners, either individuals or other businesses. |
|
Limited Liability Company (LLC) |
A type of business that has limited liability like a traditional C corporation. |
|
S Corporation |
A domestic corporation that can only be owned by U.S. citizens (not other corporations or partnerships) and can only have up to 100 shareholders. |
Sole proprietorships, S corporations, limited liability companies (LLCs), and partnerships are also known as pass-through businesses (Table 1). These entities are called pass-throughs, because the profits of these firms are passed directly through the business to the owners and are taxed on the owners’ individual income tax returns.
This is in contrast with traditional C corporations, which pay tax at the entity level through the corporate income tax. Their owners (shareholders) then pay tax on this income again when they receive a dividend or sell their stock and realize a capital gain.
Another difference between pass-through businesses and traditional C corporations is that owners of pass-through businesses pay the full tax on their business’s income every year as the business earns it. Contrast this with owners or shareholders of C corporations, who can defer the taxation on their share of corporate income as long as the corporation retains its earnings or if the shareholder does not realize a capital gain on his stock.
What Taxes Do Pass-through Businesses Pay?
Since pass-through businesses pass their income and losses directly to their owners, these businesses face the same marginal tax rates as individuals. These rates start at 10 percent on the first $9,075 of taxable income ($18,150 married filed jointly) and rise to 39.6 percent on taxable incomeTaxable income is the amount of income subject to tax, after deductions and exemptions. Taxable income differs from—and is less than—gross income. over $406,750 ($457,601 married filed jointly) (Table 2).
|
Table 2. 2014 Federal Income Tax Brackets and Rates, Pass-through Businesses |
||
|
Rate |
Single Filers |
Married Joint Filers |
|
10% |
$0 to $9,075 |
$0 to $18,150 |
|
15% |
$9,076 to $36,900 |
$18,151 to $73,800 |
|
25% |
$36,901 to $89,350 |
$73,801 to $148,850 |
|
28% |
$89,351 to $186,350 |
$148,851 to $226,850 |
|
33% |
$186,351 to $405,100 |
$226,851 to $405,100 |
|
35% |
$405,101 to 406,750 |
$405,101 to 457,600 |
|
39.6% |
$406,751+ |
$457,601+ |
|
Source: Internal Revenue Service. |
In addition, sole proprietorships and partnerships pay the self-employment (SE) tax. SE taxes are levied on self-employment income in order to fund both Social Security and Medicare and are ultimately equivalent to what wage earners pay in payroll taxes.[1] The SE payroll tax is a combined 15.3 percent on the first $117,000, 2.9 percent on the next $83,000, and 3.8 percent on any income above $200,000 ($250,000 for joint filers) (Table 3).
|
Table 3. Payroll and Self-Employment Taxes for a Single Filer, 2014 |
|||
|
Taxable Earnings |
Social Security |
Medicare |
Total |
|
$0–$117,000 |
12.40% |
2.9% |
15.3% |
|
$117,000–$200,000 |
0% |
2.9% |
2.9% |
|
$200,000 and over |
0% |
3.8% |
3.8% |
|
Source: Social Security Administration. |
Owners of sole proprietorships and partnerships are subject to the SE payroll taxA payroll tax is a tax paid on the wages and salaries of employees to finance social insurance programs like Social Security, Medicare, and unemployment insurance. Payroll taxes are social insurance taxes that comprise 24.8 percent of combined federal, state, and local government revenue, the second largest source of that combined tax revenue. on most of their net business income.[2] S corporationAn S corporation is a business entity which elects to pass business income and losses through to its shareholders. The shareholders are then responsible for paying individual income taxes on this income. Unlike subchapter C corporations, an S corporation (S corp) is not subject to the corporate income tax (CIT). owners are subject to SE payroll taxes on the portion of their net income paid out in wages. Specifically, an owner of an S corporation can designate his income as either a profit distribution or wages. The income designated as wages is subject to the SE tax while the non-wage income is not.[3]
S corporation income earned by a passive shareholder—an S corporation owner that does not actively participate in the day-to-day activities of the business but still receives income [4]—is not subject to the SE payroll tax. However, a passive shareholder is liable for the 3.8 percent Net Investment Income Tax that was passed as part of the Affordable Care Act.[5] This tax applies to investment income when a taxpayer’s modified AGI exceeds $200,000 ($250,000 for joint filers).
Pass-through business income can also be subject to the Alternative Minimum Tax (AMT), which increases the effective tax rate paid by business owners.[6]
In addition, pass-through businesses pay state and local income taxes, which vary from zero percent in states without personal income taxes to 13.3 percent, the top marginal income tax rate in California.[7]
Combined, the top marginal income tax rates faced by pass-through businesses can exceed 50 percent in some cases. For example, the top marginal tax rateThe marginal tax rate is the amount of additional tax paid for every additional dollar earned as income. The average tax rate is the total tax paid divided by total income earned. A 10 percent marginal tax rate means that 10 cents of every next dollar earned would be taken as tax. faced by sole proprietors in California tops 51.9 percent (see Table 4). The top marginal income tax rate for active shareholders of S corporations is slightly lower, since they do not pay the payroll tax on non-wage, business income (California’s top rate is 48.8 percent). [8] Passive S corporation shareholders in California face an effective marginal rate of 52.6 percent.
|
Table 4. Top Marginal Tax Rate for a Sole Proprietorship in California |
|
|
Top Marginal Federal Income Tax |
39.60% |
|
Top Marginal State Income Tax |
13.30% |
|
Self-employment Tax |
3.80% |
|
Deduction for State/Local Income Taxes and Self Employment Taxes (Less Pease) |
-4.80% |
|
Total |
51.90% |
|
Source: Author’s calculations. |
The average top marginal income tax rate on sole proprietorships and partnerships in the United States is 47.2 percent, and 44.5 and 48.3 percent, respectively, for active and passive shareholders of S corporations.[9]
Tax Differential with Traditional C Corporations
Due to the different tax treatment of pass-through businesses and C corporations, the two business forms face a tax burden differential (see Table 5). C corporations are first taxed at the entity level at the 39.1 percent combined federal and average state tax rate.[10] Then, when those profits are realized by the owners (shareholders) as either dividends or capital gains, the owners pay taxes on that income again. The double-taxation of corporate income creates a disparity between the total tax burden on the income of pass-through businesses and C corporations.
Pass-through businesses facing the top marginal tax rate (combined with the average state rate) face an average rate of 47.2 percent compared to an average total tax rate of 56.5 percent on C corporate income realized at the shareholder level.
|
Table 5. Total Tax Burden on Business Income, C Corporation vs. Pass-through Business |
||
|
Traditional C corporation |
Pass-through business |
|
|
Entity-Level Tax |
39.1% |
0.0% |
|
Individual-Level Tax |
28.6% |
47.2% |
|
Total Tax Rate |
56.5% |
47.2% |
|
Note: Assumes C corporation distributes dividends. Pass-through business is a partnership. |
Although traditional C corporations pay a higher overall tax rate on their income, there are specific advantages to the C corporate form that make it worthwhile for some businesses, specifically the ease of raising money, less restrictive shareholder rules (compared to an S corporation), deferral of domestic taxation on foreign income, and the ability to retain earnings without triggering shareholder taxation.[11]
The Number of Pass-through Businesses Filing Tax Returns Has Greatly Increased Over the Past Thirty Years
The number of pass-through businesses in the United States has increased considerably since the Tax Reform Act of 1986, which substantially lowered individual income tax rates.[12]
Between 1980 and 2011, the number of pass-through business tax returns has increased by 175 percent from roughly 10.9 million returns to about 30 million returns (Figure 2).[13] The number of sole proprietorships increased from 8.9 million in 1980 to 23.4 million in 2011. The number of partnership businesses grew from 1.3 million returns to 3.2 million returns.
S corporations experienced the fastest growth during this period. From 1980 to 2011, the number of S corporations filing tax returns grew from approximately 545,000 returns to over 4.15 million; an increase of 660 percent, more than three times the rate of growth experienced by pass-through businesses overall.
The number of C corporations filing tax returns during this period steadily declined from 2.2 million returns in 1980 to 1.6 million returns in 2011.
Pass-through Businesses Are the Most Common Business Form in the United States
Pass-through businesses are the most common business form in the United States. Of the 27.7 million firms in 2011,[14] about 94 percent of them were pass-through businesses according to the Census Bureau (Figure 3).[15]
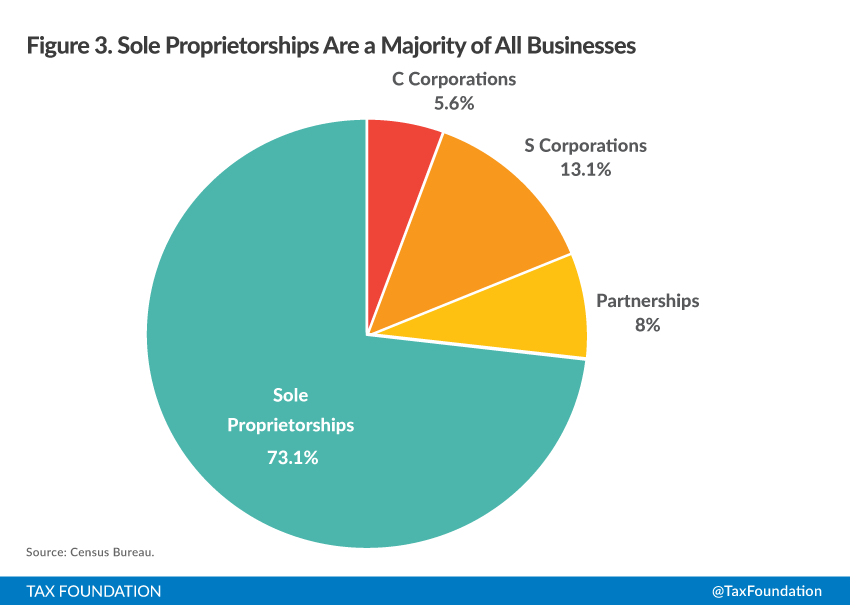
Sole proprietorships comprise the majority of all business forms. According to Census data, 73.1 percent of all businesses were sole proprietorships (20.3 million firms). 13.1 percent of all businesses were S corporations (3.65 million firms), and about 8 percent were partnerships (2.2 million firms).
C corporations make up the remaining 5.6 percent of businesses in the United States (1.5 million firms).
Pass-through Businesses Now Earn More Net Income Than Traditional C Corporations
As the number of pass-through businesses increased, they began to generate more net business income as a group than traditional C corporations. The combined net income of sole proprietorships, partnerships, and S corporations in 1980 was $188 billion compared to total C corporate net income of $697 billion (Figure 4).[16] By 1998, net pass-through income had grown by 340 percent to $829 billion, overtaking C corporate income—$773 billion in 1998—for the first time.
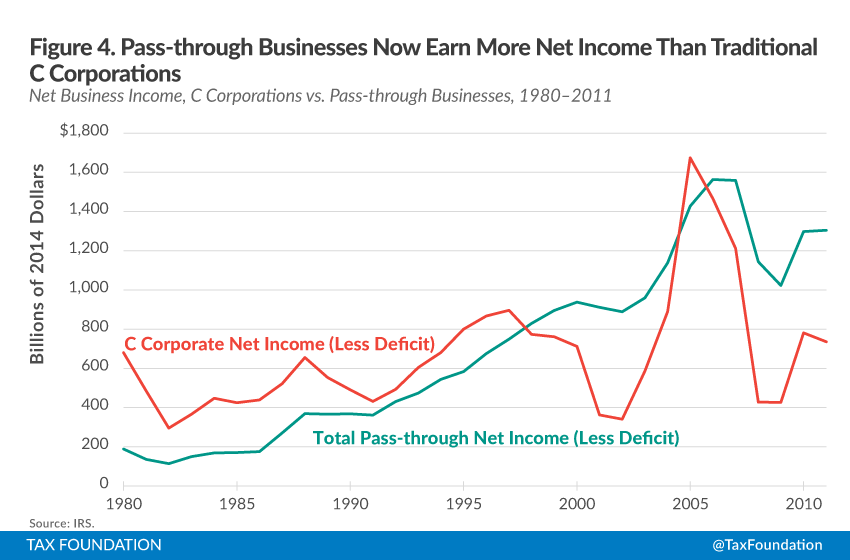
Pass-through business income has been persistently higher than corporate income since 1998, with the exception of 2005, when corporate net income peaked at $1.6 trillion. The most recent data shows that pass-through businesses earned $1.3 trillion in net income, or 63.9 percent of total business net income in 2011.
Most of the Private Sector Workforce Works at, or Is Self-Employed as, a Pass-through Business
Not only do pass-through businesses earn more net income than traditional C corporations, they also account for more employment.
According to 2011 Census data, pass-through businesses account for 55.2 percent of all private sector employment.[17] This represents 65.7 million workers. In contrast, traditional C corporations comprise 44.7 percent of the private sector workforce, or 53.2 million workers.
S corporations account for the most employment of all pass-through business types. In 2011, S corporations employed 24.4 percent of the private sector workforce, or 29 million workers. Sole Proprietorships comprised 19.5 percent of the private sector workforce. Partnerships accounted for the lowest amount of employment with only 11.3 percent of the private sector workforce.
Pass-Through Businesses Are Generally Smaller Than C Corporations, but Pass-Through Businesses Are Not Always Small Businesses
A major reason why C corporations account for a significant amount of employment but so few firms is that they are significantly larger than pass-through businesses on average. Figure 6, below, compares the distribution of pass-through and corporate employment by the size of firm.
Employment at C corporations is heavily concentrated in large firms. In 2011, 72.3 percent (38 million) of C corporate workers were employed at large firms with 500 or more employees with an additional 8.9 percent (4.7 million) working at firms with between 100 and 500 employees.[18] The remaining 18.7 percent (9.9 million) of corporate employment was at firms with fewer than 100 employees.
Pass-through business employment is more heavily distributed among smaller firms. However, it would be a mistake to completely conflate pass-through businesses with small businesses. While most pass-through employment is either self-employment (33.6 percent) or at small firms with between 1 and 100 employees (38.7 percent), a significant number of employees work at large pass-through businesses. According to 2011 Census data, a combined 27.5 percent (18.1 million) of pass-through employment was at firms with more than 100 employees, and 15.9 percent (10.3 million) of pass-through employees work at large firms with 500 or more employees.

Pass-through Businesses Account for Most of the Private Sector Workforce in 48 States
The prevalence of pass-through employment varies among U.S. states. According to Census Bureau data, pass-through businesses accounted more than 60 percent of business employment in eight states: Idaho (64 percent), Maine (62.4 percent), Montana (67.9 percent), North Dakota (60.5 percent), Rhode Island (60.6 percent), South Dakota (64.7 percent), Vermont (63.1 percent), and Wyoming (61.8 percent). [19] In contrast, Delaware (49.5 percent) and Hawaii (48 percent) had pass-through employment as a share of total private sector employment of less than 50 percent.[20]

Pass-Through Businesses Accounted for Nearly 40 Percent of Private Sector Payroll
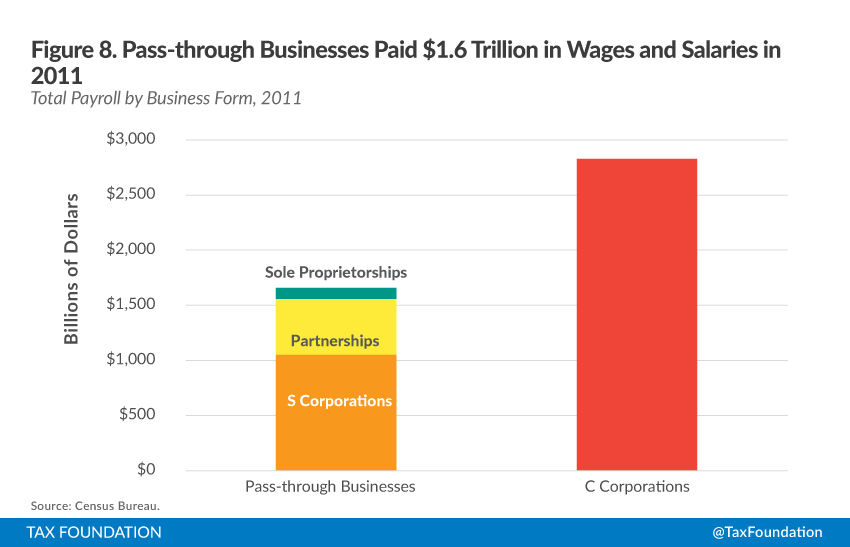
Pass-through businesses also account for a significant amount of private sector payroll. Of the $4.48 trillion of salaries and wages paid in 2011, pass-through businesses accounted for approximately $1.65 trillion, or 37 percent (Figure 8).[21] S corporations accounted for most pass-through business payroll with a total of $1 trillion. Partnerships paid $505 billion and sole proprietorships paid $98 billion.[22]
However, given their larger size, C corporations accounted for most of the private sector payroll in the United States. In 2011, 63 percent of private sector payroll was paid by C corporations, or $2.8 trillion.[23]
Pass-through Businesses Employ the Majority of Workers in Service Sector Industries
Pass-through businesses employ workers in every industry. However, service sector industries have larger shares of pass-through employment than corporate employment. In contrast, manufacturing and trade industries are dominated by C corporate employment.

Figure 9 shows the share of corporate versus pass-through employment by industry. According to Census data, pass-through business employment accounts for most employment in most industries. Pass-through employment accounts for 60 percent or more employment in the Arts, Entertainment, and Food Service (72.1 percent); Utilities, Construction, and Transportation (60.8 percent); and Information, Education, and Healthcare (60.3 percent) industries.[24]
C corporations accounted for a majority of employment in only three major industries: manufacturing (63.7 percent); wholesale and retail trade (58 percent); and Finance, Insurance, and Real Estate (50.6 percent).
Although C corporations accounted for more employment in these industries, there are consistently more pass-through businesses (firms) in all industries. For example, most employment in manufacturing is at C corporations, but the vast majority of manufacturing firms are pass-through businesses.[25] (See Appendix for complete industry numbers.)
High Income Individuals Report Most Pass-through Business Income
Since pass-through business income is taxed at the individual level, the distribution of pass-through income across individuals is important in understanding the effect of individual marginal tax rates.

If most pass-through business income were earned by low to moderate income individuals, pass-through business income would face relatively low marginal rates. Conversely, if most business income is earned by high-income individuals, pass-through business income would be taxed at potentially high marginal rates.
According to IRS data, 72 percent of returns with business income reported between $1 and $100,000 in business income.[26] However, these returns only accounted for 14 percent of total business income.[27]
The largest concentration of pass-through business income was reported on the 1.3 percent of returns that earned $1 million in net business income or more. This group of taxpayers earned 37 percent of total pass-through business income.
Combined with the 1.8 percent of tax returns with business income between $500,000 and $1 million, 51 percent of business income was earned by the few taxpayers (3.1 percent of returns) with net business income of $500,000 or more.
This means that 51 percent of pass-through business income in 2012 was potentially subject to the federal top marginal tax rate on individual income of 39.6 percent.
Conclusion
In the last thirty years, the number of pass-through businesses has greatly increased while the number of C corporations has declined. As a result, pass-through businesses now account for 94 percent of all businesses, earn more than 64 percent of total business net income, and employ more than half of the private sector workforce in the United States. In addition, they pay more than $1.6 trillion in wages and salaries and operate in every U.S. industry.
One of the main goals of fundamental tax reform is to make U.S. businesses more competitive and to increase economic growth. This requires a reduction in taxes on businesses and investment. Most attention is given to traditional C corporations because they face high tax burdens by international standards and account for a large amount of economic activity. As a result, less attention has been given to pass-through businesses. Since pass-through businesses now account for more than half of the business income and employment in the United States, any business tax reform needs to address the individual income tax code as well as the corporate income taxA corporate income tax (CIT) is levied by federal and state governments on business profits. Many companies are not subject to the CIT because they are taxed as pass-through businesses, with income reportable under the individual income tax. code.
Appendix
|
Appendix Table 1. Combined Top Marginal Tax Rate on Pass-through Businesses by State, 2014 |
|||
|
State |
Top Marginal Income Tax Rate (Sole Proprietorships/Partnerships) |
Top Marginal Income Tax Rate (S Corporations) |
|
|
Active Shareholders |
Passive Shareholders |
||
|
Alabama |
45.65% |
42.67% |
46.47% |
|
Alaska |
42.58% |
39.60% |
43.40% |
|
Arizona |
46.51% |
43.53% |
47.33% |
|
Arkansas |
48.00% |
45.02% |
48.82% |
|
California |
51.86% |
48.88% |
52.68% |
|
Colorado |
46.56% |
43.58% |
47.38% |
|
Connecticut |
47.81% |
44.83% |
48.63% |
|
Delaware |
47.81% |
44.83% |
48.63% |
|
Florida |
42.58% |
39.60% |
43.40% |
|
Georgia |
47.39% |
44.41% |
48.21% |
|
Hawaii |
50.41% |
47.43% |
51.23% |
|
Idaho |
48.24% |
45.26% |
49.06% |
|
Illinois |
46.79% |
43.81% |
47.61% |
|
Indiana |
46.61% |
43.63% |
47.43% |
|
Iowa |
47.22% |
44.25% |
48.05% |
|
Kansas |
42.58% |
39.60% |
43.40% |
|
Kentucky |
48.30% |
45.32% |
49.12% |
|
Louisiana |
45.96% |
42.98% |
46.78% |
|
Maine |
48.57% |
45.59% |
49.39% |
|
Maryland |
49.05% |
46.07% |
49.87% |
|
Massachusetts |
46.91% |
43.93% |
47.73% |
|
Michigan |
46.52% |
43.54% |
47.34% |
|
Minnesota |
49.72% |
46.74% |
50.54% |
|
Mississippi |
46.79% |
43.81% |
47.61% |
|
Missouri |
47.51% |
44.53% |
48.33% |
|
Montana |
47.93% |
44.96% |
48.76% |
|
Nebraska |
47.90% |
44.92% |
48.72% |
|
Nevada |
42.58% |
39.60% |
43.40% |
|
New Hampshire |
42.58% |
39.60% |
43.40% |
|
New Jersey |
49.18% |
46.21% |
50.01% |
|
New Mexico |
46.73% |
43.75% |
47.55% |
|
New York |
50.24% |
47.26% |
51.06% |
|
North Carolina |
47.27% |
44.29% |
48.09% |
|
North Dakota |
45.71% |
42.73% |
46.53% |
|
Ohio |
48.01% |
45.03% |
48.83% |
|
Oklahoma |
46.94% |
43.96% |
47.76% |
|
Oregon |
49.81% |
46.83% |
50.63% |
|
Pennsylvania |
46.53% |
43.55% |
47.35% |
|
Rhode Island |
47.38% |
44.41% |
48.21% |
|
South Carolina |
48.00% |
45.02% |
48.82% |
|
South Dakota |
42.58% |
39.60% |
43.40% |
|
Tennessee |
42.58% |
44.41% |
48.21% |
|
Texas |
42.58% |
39.60% |
43.40% |
|
Utah |
46.79% |
43.81% |
47.61% |
|
Vermont |
49.17% |
46.19% |
49.99% |
|
Virginia |
47.24% |
44.26% |
48.06% |
|
Washington |
42.58% |
39.60% |
43.40% |
|
West Virginia |
47.69% |
44.71% |
48.51% |
|
Wisconsin |
48.39% |
45.41% |
49.21% |
|
Wyoming |
42.58% |
39.60% |
43.40% |
|
District of Columbia |
49.17% |
46.19% |
49.99% |
|
U.S. Average |
47.25% |
44.51% |
48.31% |
|
Note: Many states also apply gross receipts, margin, and franchise taxes to pass-through business income. These numbers do not account for those. |
|||
|
Source: Author’s calculations. |
|
Appendix Table 2. Employment by Business Form and State, 2011 |
||||||||||
|
State |
C Corporations |
Pass-through Total |
Sole Proprietorship |
Partnership |
S Corporations |
|||||
|
Share |
Employment |
Share |
Employment |
Share |
Employment |
Share |
Employment |
Share |
Employment |
|
|
Alabama |
44.66% |
759,390 |
55.34% |
941,143 |
19.86% |
337,810 |
10.38% |
176,477 |
25.10% |
426,856 |
|
Alaska |
40.87% |
109,453 |
59.13% |
158,359 |
22.64% |
60,631 |
11.60% |
31,054 |
24.90% |
66,674 |
|
Arizona |
47.42% |
1,082,867 |
52.58% |
1,200,610 |
17.43% |
397,950 |
12.50% |
285,528 |
22.65% |
517,132 |
|
Arkansas |
45.68% |
470,789 |
54.32% |
559,763 |
19.41% |
200,025 |
10.43% |
107,464 |
24.48% |
252,274 |
|
California |
44.79% |
6,281,899 |
55.21% |
7,743,121 |
22.55% |
3,162,609 |
9.67% |
1,356,736 |
22.99% |
3,223,776 |
|
Colorado |
43.28% |
940,781 |
56.72% |
1,233,139 |
18.54% |
402,999 |
13.04% |
283,389 |
25.15% |
546,751 |
|
Connecticut |
46.90% |
670,857 |
53.10% |
759,461 |
20.03% |
286,557 |
14.79% |
211,596 |
18.27% |
261,308 |
|
Delaware |
50.50% |
183,955 |
49.50% |
180,326 |
13.57% |
49,425 |
13.63% |
49,656 |
22.30% |
81,245 |
|
District of Columbia |
47.72% |
167,067 |
52.28% |
183,012 |
15.44% |
54,037 |
21.26% |
74,435 |
15.58% |
54,540 |
|
Florida |
43.30% |
3,347,252 |
56.70% |
4,382,664 |
19.28% |
1,490,678 |
9.57% |
739,885 |
27.84% |
2,152,101 |
|
Georgia |
46.21% |
1,728,269 |
53.79% |
2,011,755 |
20.61% |
770,791 |
9.64% |
360,372 |
23.55% |
880,592 |
|
Hawaii |
51.96% |
262,206 |
48.04% |
242,420 |
20.58% |
103,853 |
10.32% |
52,053 |
17.14% |
86,514 |
|
Idaho |
35.98% |
192,506 |
64.02% |
342,513 |
21.29% |
113,916 |
15.06% |
80,578 |
27.67% |
148,019 |
|
Illinois |
45.65% |
2,381,740 |
54.35% |
2,836,017 |
17.50% |
912,902 |
9.85% |
513,968 |
27.01% |
1,409,147 |
|
Indiana |
41.98% |
1,036,757 |
58.02% |
1,433,031 |
16.49% |
407,276 |
11.75% |
290,192 |
29.78% |
735,563 |
|
Iowa |
46.27% |
570,868 |
53.73% |
662,857 |
17.63% |
217,458 |
8.79% |
108,486 |
27.31% |
336,913 |
|
Kansas |
46.70% |
526,274 |
53.30% |
600,592 |
18.27% |
205,836 |
10.72% |
120,835 |
24.31% |
273,921 |
|
Kentucky |
44.34% |
677,683 |
55.66% |
850,549 |
19.90% |
304,105 |
11.74% |
179,351 |
24.02% |
367,093 |
|
Louisiana |
41.03% |
712,283 |
58.97% |
1,023,924 |
20.02% |
347,506 |
15.05% |
261,321 |
23.91% |
415,097 |
|
Maine |
37.64% |
182,221 |
62.36% |
301,958 |
24.41% |
118,201 |
8.29% |
40,159 |
29.66% |
143,598 |
|
Maryland |
43.75% |
952,896 |
56.25% |
1,225,339 |
20.13% |
438,505 |
10.55% |
229,728 |
25.58% |
557,106 |
|
Massachusetts |
47.52% |
1,322,241 |
52.48% |
1,460,544 |
18.21% |
506,686 |
9.62% |
267,801 |
24.65% |
686,057 |
|
Michigan |
43.80% |
1,553,073 |
56.20% |
1,992,942 |
19.41% |
688,336 |
11.44% |
405,675 |
25.35% |
898,931 |
|
Minnesota |
43.94% |
1,012,541 |
56.06% |
1,291,745 |
17.43% |
401,737 |
8.43% |
194,226 |
30.20% |
695,782 |
|
Mississippi |
44.65% |
425,946 |
55.35% |
528,010 |
22.49% |
214,554 |
11.23% |
107,121 |
21.63% |
206,335 |
|
Missouri |
46.72% |
1,076,499 |
53.28% |
1,227,605 |
18.39% |
423,710 |
10.66% |
245,567 |
24.23% |
558,328 |
|
Montana |
32.10% |
113,952 |
67.90% |
241,049 |
23.97% |
85,091 |
11.13% |
39,516 |
32.80% |
116,442 |
|
Nebraska |
44.02% |
350,531 |
55.98% |
445,817 |
16.58% |
132,034 |
8.72% |
69,434 |
30.68% |
244,349 |
|
Nevada |
46.82% |
530,211 |
53.18% |
602,201 |
17.00% |
192,474 |
15.32% |
173,438 |
20.87% |
236,289 |
|
New Hampshire |
44.65% |
250,754 |
55.35% |
310,874 |
20.67% |
116,064 |
9.60% |
53,901 |
25.09% |
140,909 |
|
New Jersey |
45.46% |
1,617,960 |
54.54% |
1,941,400 |
17.12% |
609,281 |
13.66% |
486,253 |
23.76% |
845,866 |
|
New Mexico |
41.31% |
262,688 |
58.69% |
373,147 |
20.85% |
132,589 |
12.97% |
82,499 |
24.86% |
158,059 |
|
New York |
40.69% |
2,985,817 |
59.31% |
4,351,881 |
21.13% |
1,550,289 |
12.49% |
916,635 |
25.69% |
1,884,957 |
|
North Carolina |
45.56% |
1,576,409 |
54.44% |
1,883,894 |
19.20% |
664,216 |
9.47% |
327,524 |
25.78% |
892,154 |
|
North Dakota |
39.54% |
111,283 |
60.46% |
170,176 |
18.77% |
52,831 |
10.37% |
29,201 |
31.32% |
88,144 |
|
Ohio |
46.43% |
2,071,166 |
53.57% |
2,389,484 |
17.68% |
788,483 |
11.40% |
508,487 |
24.49% |
1,092,514 |
|
Oklahoma |
42.23% |
573,296 |
57.77% |
784,340 |
20.33% |
276,021 |
13.08% |
177,594 |
24.36% |
330,725 |
|
Oregon |
42.03% |
577,733 |
57.97% |
796,751 |
19.97% |
274,531 |
11.04% |
151,715 |
26.96% |
370,505 |
|
Pennsylvania |
44.64% |
2,150,826 |
55.36% |
2,667,428 |
18.03% |
868,870 |
10.54% |
507,738 |
26.79% |
1,290,820 |
|
Rhode Island |
39.39% |
152,988 |
60.61% |
235,359 |
19.30% |
74,945 |
8.40% |
32,629 |
32.90% |
127,785 |
|
South Carolina |
45.77% |
751,398 |
54.23% |
890,332 |
19.01% |
312,102 |
10.95% |
179,753 |
24.27% |
398,477 |
|
South Dakota |
35.27% |
111,142 |
64.73% |
203,998 |
20.85% |
65,698 |
11.28% |
35,561 |
32.60% |
102,739 |
|
Tennessee |
48.72% |
1,193,808 |
51.28% |
1,256,432 |
22.21% |
544,306 |
14.90% |
364,991 |
14.17% |
347,135 |
|
Texas |
46.72% |
4,715,695 |
53.28% |
5,378,460 |
21.02% |
2,121,668 |
14.54% |
1,468,145 |
17.72% |
1,788,647 |
|
Utah |
42.84% |
472,883 |
57.16% |
630,968 |
15.39% |
169,915 |
14.84% |
163,839 |
26.93% |
297,214 |
|
Vermont |
36.88% |
96,160 |
63.12% |
164,610 |
26.69% |
69,589 |
9.45% |
24,653 |
26.98% |
70,368 |
|
Virginia |
48.01% |
1,521,565 |
51.99% |
1,647,972 |
16.81% |
532,800 |
10.01% |
317,146 |
25.18% |
798,026 |
|
Washington |
45.23% |
1,087,939 |
54.77% |
1,317,293 |
18.45% |
443,831 |
10.73% |
258,114 |
25.58% |
615,348 |
|
West Virginia |
48.80% |
270,479 |
51.20% |
283,815 |
19.43% |
107,701 |
11.77% |
65,268 |
20.00% |
110,846 |
|
Wisconsin |
44.03% |
1,002,392 |
55.97% |
1,274,178 |
16.53% |
376,296 |
9.90% |
225,355 |
29.54% |
672,527 |
|
Wyoming |
38.17% |
86,542 |
61.83% |
140,161 |
20.13% |
45,631 |
13.22% |
29,965 |
28.48% |
64,565 |
|
Source: Author’s calculations based on U.S. Census data. |
|
Appendix Table 3. Payroll by Business Form and State, 2011 |
||||||||||
|
State |
C Corporate Payroll |
Pass-Through Payroll |
Sole Proprietorship Payroll |
Partnership Payroll |
S Corporation Payroll |
|||||
|
Share |
Amount |
Share |
Amount |
Share |
Amount |
Share |
Amount |
Share |
Amount |
|
|
Alabama |
60.5% |
$32,007,619 |
39.5% |
$20,921,116 |
2.3% |
$1,242,116 |
9.35% |
$4,948,624 |
27.8% |
$14,730,376 |
|
Alaska |
58.9% |
$6,837,634 |
41.1% |
$4,777,962 |
3.9% |
$450,529 |
10.87% |
$1,263,055 |
26.4% |
$3,064,378 |
|
Arizona |
66.4% |
$50,723,125 |
33.6% |
$25,705,549 |
1.5% |
$1,138,622 |
10.18% |
$7,778,764 |
22.0% |
$16,788,163 |
|
Arkansas |
65.0% |
$19,880,118 |
35.0% |
$10,727,277 |
1.8% |
$548,160 |
9.68% |
$2,962,057 |
23.6% |
$7,217,060 |
|
California |
66.3% |
$391,528,884 |
33.7% |
$199,022,094 |
2.5% |
$14,631,666 |
9.64% |
$56,916,574 |
21.6% |
$127,473,854 |
|
Colorado |
62.2% |
$51,740,233 |
37.8% |
$31,422,572 |
1.5% |
$1,285,006 |
11.89% |
$9,889,960 |
24.3% |
$20,247,606 |
|
Connecticut |
65.0% |
$45,463,512 |
35.0% |
$24,480,045 |
2.6% |
$1,806,889 |
15.18% |
$10,618,564 |
17.2% |
$12,054,592 |
|
Delaware |
63.1% |
$9,733,653 |
36.9% |
$5,699,143 |
1.4% |
$221,388 |
17.36% |
$2,679,297 |
18.1% |
$2,798,458 |
|
District of Columbia |
56.5% |
$12,464,549 |
43.5% |
$9,595,380 |
2.9% |
$630,936 |
27.74% |
$6,119,752 |
12.9% |
$2,844,692 |
|
Florida |
59.9% |
$142,247,165 |
40.1% |
$95,084,198 |
1.3% |
$3,105,904 |
10.41% |
$24,716,547 |
28.3% |
$67,261,747 |
|
Georgia |
66.1% |
$83,965,206 |
33.9% |
$43,133,496 |
1.6% |
$1,976,450 |
9.93% |
$12,619,545 |
22.5% |
$28,537,501 |
|
Hawaii |
68.3% |
$10,349,394 |
31.7% |
$4,807,095 |
3.6% |
$549,641 |
10.35% |
$1,568,729 |
17.7% |
$2,688,725 |
|
Idaho |
52.5% |
$7,778,024 |
47.5% |
$7,026,080 |
2.2% |
$320,483 |
15.97% |
$2,364,049 |
29.3% |
$4,341,548 |
|
Illinois |
62.0% |
$132,851,641 |
38.0% |
$81,256,813 |
2.1% |
$4,574,599 |
11.38% |
$24,375,339 |
24.4% |
$52,306,875 |
|
Indiana |
57.4% |
$47,204,435 |
42.6% |
$35,090,766 |
2.1% |
$1,724,555 |
11.25% |
$9,255,257 |
29.3% |
$24,110,954 |
|
Iowa |
63.3% |
$24,808,579 |
36.7% |
$14,408,835 |
2.2% |
$844,610 |
6.90% |
$2,704,843 |
27.7% |
$10,859,382 |
|
Kansas |
65.0% |
$24,718,807 |
35.0% |
$13,321,261 |
2.2% |
$828,865 |
8.77% |
$3,336,798 |
24.1% |
$9,155,598 |
|
Kentucky |
61.7% |
$28,913,905 |
38.3% |
$17,918,397 |
3.8% |
$1,788,935 |
10.67% |
$4,994,966 |
23.8% |
$11,134,496 |
|
Louisiana |
55.6% |
$32,183,055 |
44.4% |
$25,695,038 |
2.3% |
$1,350,352 |
16.15% |
$9,344,547 |
25.9% |
$15,000,139 |
|
Maine |
56.3% |
$7,762,347 |
43.7% |
$6,035,022 |
3.2% |
$438,128 |
7.41% |
$1,021,861 |
33.2% |
$4,575,033 |
|
Maryland |
59.9% |
$51,226,319 |
40.1% |
$34,226,875 |
2.2% |
$1,913,324 |
9.98% |
$8,531,057 |
27.8% |
$23,782,494 |
|
Massachusetts |
66.7% |
$89,890,293 |
33.3% |
$44,910,224 |
1.7% |
$2,327,184 |
9.78% |
$13,178,838 |
21.8% |
$29,404,202 |
|
Michigan |
62.3% |
$78,744,124 |
37.7% |
$47,663,679 |
1.9% |
$2,449,317 |
10.78% |
$13,623,258 |
25.0% |
$31,591,104 |
|
Minnesota |
63.8% |
$59,108,837 |
36.2% |
$33,589,449 |
1.9% |
$1,764,278 |
7.62% |
$7,059,076 |
26.7% |
$24,766,095 |
|
Mississippi |
62.9% |
$15,818,019 |
37.1% |
$9,310,039 |
2.8% |
$698,193 |
10.93% |
$2,747,398 |
23.3% |
$5,864,448 |
|
Missouri |
64.7% |
$50,397,113 |
35.3% |
$27,542,251 |
1.9% |
$1,486,279 |
9.51% |
$7,411,191 |
23.9% |
$18,644,781 |
|
Montana |
51.2% |
$4,632,791 |
48.8% |
$4,423,065 |
2.9% |
$259,706 |
9.29% |
$841,740 |
36.7% |
$3,321,619 |
|
Nebraska |
58.8% |
$15,008,653 |
41.2% |
$10,536,723 |
1.7% |
$443,661 |
6.90% |
$1,763,625 |
32.6% |
$8,329,437 |
|
Nevada |
59.2% |
$21,750,823 |
40.8% |
$14,967,337 |
4.1% |
$1,497,066 |
14.65% |
$5,377,575 |
22.0% |
$8,092,696 |
|
New Hampshire |
61.6% |
$12,618,559 |
38.4% |
$7,856,197 |
3.0% |
$620,889 |
7.10% |
$1,453,691 |
28.2% |
$5,781,617 |
|
New Jersey |
64.5% |
$106,136,669 |
35.5% |
$58,534,325 |
2.0% |
$3,235,618 |
10.88% |
$17,912,850 |
22.7% |
$37,385,857 |
|
New Mexico |
56.4% |
$10,599,304 |
43.6% |
$8,204,404 |
2.7% |
$512,359 |
15.03% |
$2,825,448 |
25.9% |
$4,866,597 |
|
New York |
59.9% |
$218,057,598 |
40.1% |
$146,082,409 |
2.1% |
$7,636,085 |
16.49% |
$60,063,617 |
21.5% |
$78,382,707 |
|
North Carolina |
65.0% |
$73,648,168 |
35.0% |
$39,575,743 |
1.9% |
$2,183,591 |
8.59% |
$9,723,911 |
24.4% |
$27,668,241 |
|
North Dakota |
57.0% |
$5,435,830 |
43.0% |
$4,099,686 |
2.3% |
$217,953 |
7.94% |
$757,496 |
32.8% |
$3,124,237 |
|
Ohio |
63.7% |
$99,012,006 |
36.3% |
$56,340,183 |
2.1% |
$3,266,377 |
10.12% |
$15,722,600 |
24.0% |
$37,351,206 |
|
Oklahoma |
60.8% |
$26,676,707 |
39.2% |
$17,185,828 |
2.4% |
$1,032,740 |
12.38% |
$5,428,372 |
24.5% |
$10,724,716 |
|
Oregon |
63.0% |
$29,763,256 |
37.0% |
$17,498,294 |
2.3% |
$1,072,023 |
8.37% |
$3,955,555 |
26.4% |
$12,470,716 |
|
Pennsylvania |
61.1% |
$111,739,161 |
38.9% |
$71,289,612 |
2.6% |
$4,823,178 |
9.53% |
$17,438,586 |
26.8% |
$49,027,848 |
|
Rhode Island |
54.1% |
$7,406,493 |
45.9% |
$6,294,069 |
4.6% |
$625,134 |
7.34% |
$1,005,234 |
34.0% |
$4,663,701 |
|
South Carolina |
62.2% |
$29,860,505 |
37.8% |
$18,155,968 |
2.3% |
$1,107,622 |
10.60% |
$5,091,516 |
24.9% |
$11,956,830 |
|
South Dakota |
49.6% |
$4,249,432 |
50.4% |
$4,325,195 |
2.8% |
$243,397 |
10.20% |
$874,870 |
37.4% |
$3,206,928 |
|
Tennessee |
66.6% |
$53,449,846 |
33.4% |
$26,780,728 |
3.1% |
$2,481,896 |
13.86% |
$11,118,643 |
16.4% |
$13,180,189 |
|
Texas |
65.5% |
$249,208,105 |
34.5% |
$131,034,636 |
2.3% |
$8,837,959 |
15.18% |
$57,711,580 |
17.0% |
$64,485,097 |
|
Utah |
60.7% |
$21,540,940 |
39.3% |
$13,958,186 |
1.2% |
$419,387 |
11.21% |
$3,979,060 |
26.9% |
$9,559,739 |
|
Vermont |
56.6% |
$4,248,011 |
43.4% |
$3,255,347 |
3.5% |
$265,584 |
7.24% |
$543,079 |
32.6% |
$2,446,684 |
|
Virginia |
63.5% |
$82,006,387 |
36.5% |
$47,083,789 |
1.9% |
$2,401,574 |
9.68% |
$12,501,885 |
24.9% |
$32,180,330 |
|
Washington |
65.7% |
$67,815,134 |
34.3% |
$35,472,191 |
2.5% |
$2,573,819 |
8.62% |
$8,906,822 |
23.2% |
$23,991,550 |
|
West Virginia |
66.9% |
$11,431,956 |
33.1% |
$5,666,790 |
3.4% |
$581,332 |
10.32% |
$1,763,804 |
19.4% |
$3,321,654 |
|
Wisconsin |
60.4% |
$48,179,529 |
39.6% |
$31,615,544 |
2.3% |
$1,854,671 |
7.78% |
$6,204,305 |
29.5% |
$23,556,568 |
|
Wyoming |
56.1% |
$4,545,034 |
43.9% |
$3,559,474 |
2.3% |
$188,161 |
10.63% |
$861,799 |
31.0% |
$2,509,514 |
|
Note: Does not include non-employer firms; dollar amounts in thousands. Source: Author’s calculations based on U.S. Census data. |
|
Appendix Table 4. Pass-through Businesses, Employment, and Payroll by Industry |
||||||||||
|
NAICS Classification |
NAICS Code |
Total Private Sector |
C Corporations |
Pass-through Businesses |
||||||
|
Firms |
Employment |
Payroll |
Firms |
Employment |
Payroll |
Firms |
Employment |
Payroll |
||
|
Agriculture, forestry, fishing and hunting |
11 |
258188 |
386229 |
$5,186,733 |
6767 |
50678 |
$1,957,557 |
251421 |
335551 |
$3,229,176 |
|
Mining, quarrying, and oil and gas extraction |
21 |
131247 |
758959 |
$55,142,854 |
8863 |
433115 |
$39,779,751 |
122384 |
325844 |
$15,363,103 |
|
Utilities |
22 |
20703 |
580534 |
$52,791,916 |
2159 |
537163 |
$50,520,384 |
18544 |
43371 |
$2,271,532 |
|
Construction |
23 |
3032846 |
7570862 |
$264,873,890 |
180636 |
1862122 |
$101,836,009 |
2852210 |
5708740 |
$163,037,881 |
|
Manufacturing |
31-33 |
585945 |
11237036 |
$571,217,485 |
95521 |
7160805 |
$406,976,997 |
490424 |
4076231 |
$164,240,488 |
|
Wholesale trade |
42 |
712192 |
5955180 |
$353,649,072 |
129530 |
3223821 |
$230,411,033 |
582662 |
2731359 |
$123,238,039 |
|
Retail trade |
44-45 |
2498799 |
16365278 |
$366,560,872 |
191122 |
9735727 |
$233,317,378 |
2307677 |
6629551 |
$133,243,494 |
|
Transportation and warehousing |
48-49 |
1202842 |
5115544 |
$174,926,243 |
62017 |
2794022 |
$125,680,588 |
1140825 |
2321522 |
$49,245,655 |
|
Information |
51 |
383354 |
3340315 |
$229,570,366 |
29305 |
2323834 |
$188,692,027 |
354049 |
1016481 |
$40,878,339 |
|
Finance and insurance |
52 |
940019 |
6214086 |
$472,183,897 |
63534 |
4461143 |
$376,795,088 |
876485 |
1752943 |
$95,388,809 |
|
Real estate and rental and leasing |
53 |
2604917 |
4209817 |
$82,333,393 |
132816 |
823592 |
$36,584,148 |
2472101 |
3386225 |
$45,749,245 |
|
Professional, scientific, and technical services |
54 |
3924278 |
10847469 |
$551,274,359 |
200958 |
3681456 |
$302,677,017 |
3723320 |
7166013 |
$248,597,342 |
|
Management of companies and enterprises |
55 |
25009 |
2605175 |
$278,703,195 |
12321 |
2131746 |
$240,527,725 |
12688 |
473429 |
$38,175,470 |
|
Administrative and support and waste management and remediation services |
56 |
2301092 |
11257122 |
$321,620,087 |
79696 |
4547393 |
$176,609,396 |
2221396 |
6709729 |
$145,010,691 |
|
Educational services |
61 |
630490 |
1405289 |
$25,206,522 |
13364 |
400570 |
$14,262,759 |
617126 |
1004719 |
$10,943,763 |
|
Health care and social assistance |
62 |
2534133 |
10742519 |
$367,325,270 |
125854 |
3421261 |
$175,269,506 |
2408279 |
7321258 |
$192,055,764 |
|
Arts, entertainment, and recreation |
71 |
1277971 |
2545644 |
$47,681,968 |
31199 |
541619 |
$16,208,131 |
1246772 |
2004025 |
$31,473,837 |
|
Accommodation and food services |
72 |
824512 |
11744451 |
$190,190,752 |
100135 |
4130380 |
$77,708,593 |
724377 |
7614071 |
$112,482,159 |
|
Other services (except public administration) |
81 |
3905021 |
6121087 |
$73,832,944 |
124134 |
1000942 |
$31,498,530 |
3780887 |
5120145 |
$42,334,414 |
|
Industries not classified |
99 |
15970 |
3716 |
$262,048 |
2123 |
2544 |
$54,870 |
13847 |
1172 |
$207,178 |
|
Note: Dollars in thousands of dollars. Source: Author’s calculations based on U.S. Census data. |
Stay informed on the tax policies impacting you.
Subscribe to get insights from our trusted experts delivered straight to your inbox.
Subscribe[1] Half of a worker’s payroll taxes are paid by their employer.
[2] Rental real estate income is exempt from the self-employment tax.
[3] The IRS sets a limit on how much income an owner can designate as a non-wage distribution to prevent abuse.
[4] The IRS sets guidelines on what they consider active or passive participation. If shareholders do not satisfy the “material participation” guidelines, the income received from the business is deemed passive and subject to the Net Investment Income Tax. See Michael Kosnitzky & Michael Grisolia, Net Investment Income Tax Regulations Affecting S Corporations, http://www.bsfllp.com/news/in_the_news/001548/_res/id=sa_File1/.
[5] Regulations require equal distribution among all S corporation shareholders, active or passive. S corporations must distribute enough money to all shareholders, including active shareholders, to cover the 3.8 percent Net Investment Tax, even though active shareholders are not actually required to pay the tax. Although not strictly a tax on S corporations, this limits the amount of money available for reinvestment.
[6] More than 2 million income tax returns with pass-through business income were subject to the AMT in 2007. U.S. Department of the Treasury, Office of Tax Analysis, Mathew Knittel et al., OTA Technical Paper 4: Methodology to Identify Small Businesses and Their Owners (Aug. 2011), http://www.treasury.gov/resource-center/tax-policy/tax-analysis/Documents/OTA-T2011-04-Small-Business-Methodology-Aug-8-2011.pdf.
[7] Tax Foundation, State Personal Income Tax Rates and Brackets 2014 Update, https://taxfoundation.org/article/state-personal-income-tax-rates-and-brackets-2014-update.
[8] Assuming the last dollar earned by an active shareholder is his non-salary income from his business.
[9] Averages are both weighted by the amount of pass-through income in each state. Assumes no effect of Pease in states with no individual income tax. Pease may apply in states with no income tax, in some cases adding 1.118 percent to the marginal rate. Many states also apply gross receipts, margin, and franchise taxes to pass-through business income. These numbers do not account for those.
[10] Assuming equity-financed investment.
[11] Nearly 40 percent of corporate equities are held by tax-exempt organizations and individuals (college endowments, pension funds, and tax preferred retirement accounts). The corporate income passed to these taxpayers is exempt from the second layer of tax. See Congressional Budget Office, Taxing Capital Income: Effective Marginal Tax Rates Under 2014 Law and Selected Policy Options (Dec. 2014), http://www.cbo.gov/sites/default/files/cbofiles/attachments/49817-Taxing_Capital_Income_0.pdf.
[12] The top marginal individual income tax rates were reduced from 50 percent in 1986 to 28 percent in 1988. This is compared to the corporate income tax rate that was lowered from 46 percent in 1986 to 34 percent in 1988. See Tax Foundation, U.S. Federal Individual Income Tax Rates History, 1862-2013 (Nominal and InflationInflation is when the general price of goods and services increases across the economy, reducing the purchasing power of a currency and the value of certain assets. The same paycheck covers less goods, services, and bills. It is sometimes referred to as a “hidden tax,” as it leaves taxpayers less well-off due to higher costs and “bracket creep,” while increasing the government’s spending power. -Adjusted Brackets), https://taxfoundation.org/article/us-federal-individual-income-tax-rates-history-1913-2013-nominal-and-inflation-adjusted-brackets; Tax Foundation, U.S. Federal Individual Income Tax Rates History, 1862-2013 (Nominal and Inflation-Adjusted Brackets), https://taxfoundation.org/article/us-federal-individual-income-tax-rates-history-1913-2013-nominal-and-inflation-adjusted-brackets.
[13] Internal Revenue Service, SOI Tax Stats – Integrated Business Data, 1980–2008, http://www.irs.gov/uac/SOI-Tax-Stats-Integrated-Business-Data; Internal Revenue Service, Business Tax Statistics, 2009–2011, http://www.irs.gov/uac/Tax-Stats-2. IRS data double counts some businesses due to the fact that some private partnerships can be owned by one or more other business entities.
[14] The number of firms differs from the number of returns. Specifically, an individual firm may own several different businesses that separately file tax returns.
[15] Census Bureau, County Business Patterns, http://www.census.gov/econ/cbp/; Census Bureau, Nonemployer Statistics, http://www.census.gov/econ/nonemployer/. 2011 is the most up-to-date year for all data sources.
[16] Internal Revenue Service, SOI Tax Stats – Integrated Business Data, 1980–2008, http://www.irs.gov/uac/SOI-Tax-Stats-Integrated-Business-Data; Internal Revenue Service, Business Tax Statistics, 2009–2011, http://www.irs.gov/uac/Tax-Stats-2.
[17] Numbers include self-employed individuals in order to get a complete picture of employment by business form. Census Bureau, County Business Patterns, http://www.census.gov/econ/cbp/; Census Bureau, Statistics of U.S. Businesses, http://www.census.gov/econ/susb/; Census Bureau, Nonemployer Statistics 2011, http://www.census.gov/econ/nonemployer/.
[18] Census Bureau, County Business Patterns, http://www.census.gov/econ/cbp/; Census Bureau, Statistics of U.S. Businesses, http://www.census.gov/econ/susb/; Census Bureau, Nonemployer Statistics 2011, http://www.census.gov/econ/nonemployer/.
[19] Census Bureau, County Business Patterns, http://www.census.gov/econ/cbp/; Census Bureau, Statistics of U.S. Businesses, http://www.census.gov/econ/susb/; Census Bureau, Nonemployer Statistics 2011, http://www.census.gov/econ/nonemployer/.
[20] See Appendix for full employment data table.
[21] Census Bureau, County Business Patterns, http://www.census.gov/econ/cbp/; Census Bureau, Statistics of U.S. Businesses, http://www.census.gov/econ/susb/; Census Bureau, Nonemployer Statistics 2011, http://www.census.gov/econ/nonemployer/.
[22] These numbers do not account for self-employment income, which is disproportionately earned by pass-through businesses, especially sole proprietorships. Unincorporated self-employed individuals reported approximately $600 billion in gross receipts in 2011. However, gross receipts cannot be directly compared to payroll due to the omission of business expenses. Wages would more accurately be compared to gross receipts minus costs.
[23] See Appendix for full data table with payroll by state and business form for 2011.
[24] Census Bureau, County Business Patterns, http://www.census.gov/econ/cbp/; Census Bureau, Statistics of U.S. Businesses, http://www.census.gov/econ/susb/; Census Bureau, Nonemployer Statistics 2011, http://www.census.gov/econ/nonemployer/.
[25] Robert Carroll & Gerald Prante, The Flow-Through Business Sector and Tax Reform: The economic footprint of the flow-through sector and the potential impact of tax reform (Apr. 2011), http://www.s-corp.org/wp-content/uploads/2011/04/Flow-Through-Report-Final-2011-04-08.pdf.
[26] Internal Revenue Service, SOI Tax Stats – Individual Statistical Tables by Size of Adjusted Gross IncomeFor individuals, gross income is the total of all income received from any source before taxes or deductions. It includes wages, salaries, tips, interest, dividends, capital gains, rental income, alimony, pensions, and other forms of income. For businesses, gross income (or gross profit) is the sum of total receipts or sales minus the cost of goods sold (COGS)—the direct costs of producing goods, including inventory and certain labor costs. , Table 1.4, http://www.irs.gov/uac/SOI-Tax-Stats—Individual-Statistical-Tables-by-Size-of-Adjusted-Gross-Income. Business income includes: business and professional income (Schedule C, 1040 Line 12), Rents, Royalties, S Corporation and Partnerships income (Schedule E), and Farm Income (Schedule F).
[27] It is important to note that individuals can report business income from incidental business activity. For example, an individual can earn rental income from a vacation home.