In fall 2012, the Carolina Business Coalition commissioned us to prepare a review of the North Carolina taxA tax is a mandatory payment or charge collected by local, state, and national governments from individuals or businesses to cover the costs of general government services, goods, and activities. system and recommend possible improvements. We undertook this project as a national organization familiar with tax developments in many states, with the view that tax systems should adhere to sound economic principles, and in the spirit of providing useful information and observations for North Carolina policymakers, journalists, and citizens as they evaluate their state’s tax system.
EXECUTIVE SUMMARY
In fall 2012, the Carolina Business Coalition commissioned us to prepare a review of the North Carolina tax system and recommend possible improvements. We undertook this project as a national organization familiar with tax developments in many states, with the view that tax systems should adhere to sound economic principles, and in the spirit of providing useful information and observations for North Carolina policymakers, journalists, and citizens as they evaluate their state’s tax system.
By outlining four tax reform options, and various smaller tax changes, we hope to provide North Carolinians with a menu of choices for making sure that their state builds on its recent growth and is where investment, entrepreneurs, and talented individuals go in the years ahead.
Option A would make North Carolina among the most pro-growth tax systems in the country:
- 6% simplified income tax (competitive with North Carolina’s neighbors), based on adjusted gross incomeFor individuals, gross income is the total pre-tax earnings from wages, tips, investments, interest, and other forms of income and is also referred to as “gross pay.” For businesses, gross income is total revenue minus cost of goods sold and is also known as “gross profit” or “gross margin.” and a $5,000 personal exemption
- 3.5% neutral state sales taxA sales tax is levied on retail sales of goods and services and, ideally, should apply to all final consumption with few exemptions. Many governments exempt goods like groceries; base broadening, such as including groceries, could keep rates lower. A sales tax should exempt business-to-business transactions which, when taxed, cause tax pyramiding. (reduced from 4.75%), expanding the base to services but excluding business-to-business transactions
- Repeals the corporate income and franchise taxes, eliminating taxes that impose enormous compliance costs on in-state job creation and capital investment
- Clears aside tax barriers to investment and job creation while establishing a more transparent tax system linked to reliable revenue sources
- Retains the low-income Earned Income Tax CreditA tax credit is a provision that reduces a taxpayer’s final tax bill, dollar-for-dollar. A tax credit differs from deductions and exemptions, which reduce taxable income, rather than the taxpayer’s tax bill directly. (EITC) and can include a low-income tax credit to offset grocery purchases
- Raises the same amount of revenue as the existing tax system
- Distributionally similar to the existing tax system
- State tax system would rank 5th on the State Business Tax Climate Index, up from 44th
Option B simplifies and stabilizes North Carolina’s existing tax system, broadening bases and adopting uniform 5 percent tax rates across-the-board:
- 5% simplified income tax: A rate reduction for all North Carolinians, the tax includes a generous $10,000 exemption for each household member
- 5% neutral state sales tax: Expanded to services but excludes business-to-business transactions
- 5% corporate income taxA corporate income tax (CIT) is levied by federal and state governments on business profits. Many companies are not subject to the CIT because they are taxed as pass-through businesses, with income reportable under the individual income tax. on the existing base, retaining present incentive programs
- Repeals the franchise tax, eliminating the tax on in-state capital investment
- Retains a mix of revenue sources, each transparently levied on a solid base
- Retains the low-income Earned Income Tax Credit (EITC) and can include a low-income tax credit to offset grocery purchases
- Raises the same amount of revenue as the existing tax system
- Distributionally similar to the existing tax system
- Resembles Utah’s tax reform under Gov. Jon Huntsman
- State tax system would rank 13th on the State Business Tax Climate Index, up from 44th
Option C moves North Carolina to a stable, transparent consumption-based tax system, making the state stand out as one of the few with no taxes on investment and job creation:
- 8.75% neutral state sales tax: Expanded to services but excludes business-to-business transactions
- No income tax: North Carolina would join the seven existing states with no tax on wages, salaries, dividends, capital gains, or business income
- Repeals the corporate income and franchise taxes, eliminating taxes that impose enormous compliance costs on in-state job creation and capital investment
- Avoids untried or economically destructive taxes on gross receipts or business assets
- Raises same amount of revenue as the existing tax system
- Distributionally regressive compared to the existing tax system
- State tax system would rank 3rd on the State Business Tax Climate Index, up from 44th
Option D would set North Carolina apart as the only state in the region with no sales tax, resembling tax systems in Delaware, Montana, and Oregon. Taxes on income would be higher but with low property taxA property tax is primarily levied on immovable property like land and buildings, as well as on tangible personal property that is movable, like vehicles and equipment. Property taxes are the single largest source of state and local revenue in the U.S. and help fund schools, roads, police, and other services. es and no state taxes on corporate profits or business assets:
- No state sales tax: Tax-free retail sales, 365 days a year for all North Carolinians (and visitors)
- 10% income tax based on federal adjusted gross income and a $5,000 personal exemption
- Repeals the corporate income and franchise taxes, eliminating taxes that impose enormous compliance costs on in-state job creation and capital investment
- Raises same amount of revenue as the existing state tax system (would reduce local revenue)
- Distributionally more progressive compared to the existing tax system
- State tax system would rank 5th on the State Business Tax Climate Index, up from 44th
Appendix A presents revenue estimates for these proposals and Appendix B reviews sales tax broadening options.
All four tax plans we modeled include a 0.5 percent real estate transfer tax as a placeholder but can be substituted with some level of sales tax baseThe tax base is the total amount of income, property, assets, consumption, transactions, or other economic activity subject to taxation by a tax authority. A narrow tax base is non-neutral and inefficient. A broad tax base reduces tax administration costs and allows more revenue to be raised at lower rates. expansion to housing.
Our report does not evaluate a cash-flow or consumed-income tax option due to uncertainties in how it would be administered, but the economic effects would be similar to a properly structured sales tax.
In addition to these comprehensive reforms, smaller tax changes are possible that can still improve the state’s business tax climate. These changes can be combined with a larger tax reform or enacted separately:
Franchise Tax Repeal: Eliminating the Tax on Investment
In broad economic terms, franchise taxes (or capital stock taxes, as they are sometimes called) are destructive because they discourage investment and the accumulation of assets. Several states have recognized this harmful effect and are moving away from franchise taxes as a source of revenue. West Virginia and Pennsylvania will fully phase out their tax by 2015 and 2014, respectively, and Kansas recently completely repealed its tax in 2011. Only three of North Carolina’s neighbors retain the tax.
North Carolina’s current franchise tax is 0.15 percent and raises approximately $700 million per year. The tax does not apply to pass-through businessA pass-through business is a sole proprietorship, partnership, or S corporation that is not subject to the corporate income tax; instead, this business reports its income on the individual income tax returns of the owners and is taxed at individual income tax rates. es, but those subject to it must pay it even in unprofitable years. Many tax reform proposals seek to expand the tax to all business forms, including the recent Civitas Institute’s recommendation to tax business net assets (i.e., equipment and inventory) at a 1.05 percent annual rate, seek to expand the tax to all business forms. A better approach would be to end this tax on business investment.
A more limited alternative that could be considered would be to cap liability for each legal entity, as is done in other states and as is done in North Carolina for holding companies. Other potential reforms include revisiting how intercompany debt is adjusted and linking statutory terminology to GAAP terms of art.
Net Operating Loss CarrybackA Net Operating Loss (NOL) Carryback allows businesses suffering losses in one year to deduct them from previous years’ profits. Businesses thus are taxed on their average profitability, making the tax code more neutral. In the U.S., a Net Operating Loss cannot be carried back (only carried forward). & Carryforward Reform
Twenty-six states and the District of Columbia (including Florida, Georgia, South Carolina, and Virginia) allow businesses to use past losses to offset current tax obligations for up to 20 years; North Carolina only allows 15 years. Fifteen states (including Georgia and Virginia) allow businesses to carry back losses against past taxes for 2 or 3 years; North Carolina does not allow any loss carrybacks.
Reduce Sales Tax PyramidingTax pyramiding occurs when the same final good or service is taxed multiple times along the production process. This yields vastly different effective tax rates depending on the length of the supply chain and disproportionately harms low-margin firms. Gross receipts taxes are a prime example of tax pyramiding in action.
Business inputs should be exempt from sales tax not because businesses deserve special treatment, but because failure to do so results in “tax pyramiding,” the process whereby taxes stack on top of each other as raw goods move through the production process. Sales taxes on business inputs make up 24 percent of total state and local business taxes collected in North Carolina. Many states try to avoid these problems by engaging in the laborious task of picking products that are frequently used as business inputs and individually carving out exemptions for them in the sales tax code. This approach is a step in the right direction but does not and cannot ever comprehensively address all the items that businesses use in the production process and should therefore not pay sales taxes on.
Intangibles Tax Repeal
North Carolina is one of 12 states that still have some form of intangible property tax. Historically, these taxes were imposed on the value of trademarks and stocks and are distortive in that they attempt to tax an abstract, future, unrealized value. They tax stock values that may not ever be attained (stock prices are in constant flux) and tax trademark values that may also fall (as a business loses brand integrity). North Carolina has repealed most of its taxation of intangibles, except for the taxation of leasehold interests in real property.[1]
Real Estate Transfer Tax
Residential housing sales and rentals are generally not subject to sales tax but are sometimes subject to a real estate transfer tax. North Carolina has this tax at a 0.2 percent rate, raising approximately $120 million per year. A broadened sales tax should include or be accompanied by a tax on some level of housing services and transactions, and the existence of property taxes and the large numbers involved suggest that the state should proceed thoughtfully. While Delaware and Washington have real estate transfer taxes of over 2 percent, they are usually 1 percent or less.[2] All four tax plans we modeled include a 0.5 percent real estate transfer tax as a placeholder but can be substituted with some level of sales tax base expansion to housing.
Estate & Inheritance TaxAn inheritance tax is levied upon an individual’s estate at death or upon the assets transferred from the decedent’s estate to their heirs. Unlike estate taxes, inheritance tax exemptions apply to the size of the gift rather than the size of the estate. Repeal
Estate and inheritance taxes are undesirable because they discourage the accumulation of capital, which hurts economic growth. They affect different businesses differently, as corporations do not pay them but family businesses are subject to them each generation. This distortion can prohibit family businesses from achieving an efficient business scale, which in turn makes them less able to compete with corporations on prices. Compliance costs associated with estate planning to avoid the estate taxAn estate tax is imposed on the net value of an individual’s taxable estate, after any exclusions or credits, at the time of death. The tax is paid by the estate itself before assets are distributed to heirs. actually are greater than the amount the tax collects.[3] In North Carolina, the estate tax brings in just 0.2 percent of state and local revenues, all at tremendous costs to taxpayers and to economic growth.
Tangible Personal Property Tax Repeal
In 2009, North Carolina collected $130 per capita in tangible personal property (TPP) taxes, thirteenth highest in the nation. TPP taxes are levied on business personal property such as office equipment and machinery, and are less preferable than taxes on real property because they distort business decisions by discouraging investment in new technology and the production processes. Many states have recognized this undesirable outcome and have limited or eliminated their TPP taxes in recent years (see Figure 46). Between 2000 and 2009, TPP tax collections per capita have decreased by an average of 20 percent.[4] In the last decade, Ohio has completely phased out TPP taxes, Maine has exempted most newly purchased property with the goal of eventual phase-out, and Vermont has adopted local options to reduce or repeal TPP taxes. Especially for high-tech industries that have lots of expensive capital and relatively less labor, TPP tax repeal would be helpful in luring new firms to the state.[5]
ApportionmentApportionment is the determination of the percentage of a business’ profits subject to a given jurisdiction’s corporate income or other business taxes. U.S. states apportion business profits based on some combination of the percentage of company property, payroll, and sales located within their borders. Formulas, Combined Reporting, & Throwback Rules
Multistate corporations earn profits all over the country and the world, so determining how much of the profit each state may tax is complicated. At one time, states adhered to a uniform formula averaging the share of employees, property, and sales in the state. This “three-factor” apportionment formula has been superseded in many states, including in North Carolina, by heavier weighting of the sales factor as states sought to shift tax burdens away from in-state businesses toward out-of-state businesses. The eagerness by which states have adopted single sales factor and encouraged targeted tax incentives to select companies—with little sign of the trend halting—is evidence of the eventual extinction of the state corporate income tax as a significant revenue source in a globally competitive economy.
Some states have sought to raise corporate taxes by requiring corporations to treat certain out-of-state sales like in-state sales with policies such as mandatory unitary combined reporting or “throwback” or “throwout” rules. Pursuing these policies would increase distortions without changing the overall trend and put North Carolina at a competitive disadvantage.
Economic Development Incentives
Even if all targeted economic development efforts work out spectacularly, they will be insufficient to create all of the jobs North Carolina needs each year. For example, the North Carolina Department of Commerce reported in 2011 that it engaged in 570 development project announcements that year that produced 28,711 new jobs.[6] Those new jobs—some induced by the incentives but some occurring anyways— compares to the 440,000 unemployed North Carolinians in 2012.[7] Incentives can be effective (particularly with performance measures and expectations) but are not efficient. Targeted tax credits do not and cannot substitute for good tax, regulatory, infrastructure, and education policies. Because the focus of North Carolina economic development should be on these basic structural questions and not on incentives, our report does not recommend paring back incentive programs. Options A, C, and D delete the corporate income tax and all accumulated credits associated with it. Option B retains the corporate income tax at a 5 percent rate, and assumes that credits will be prorated to that rate.
Reducing Total Tax Burden
North Carolina residents face the 17th highest state-local tax burden in the country, paying 9.9 percent of annual income in state and local taxes. Even with simplification and restructuring, taxes can only go so low while still funding essential and desired government services. Each of the recommended plans in this report is revenue-neutral: they raise the same amount of revenue as the current tax system. Whether North Carolina should aim to spend less or more on government services is beyond the scope of this report and beyond the expertise of the authors. Ultimately that question is up to the people of North Carolina and their legislative representatives, and we are happy to develop tax scenarios that adjust to reduced levels of state and local spending.
Table 1: Key Elements of North Carolina Tax Reform Options
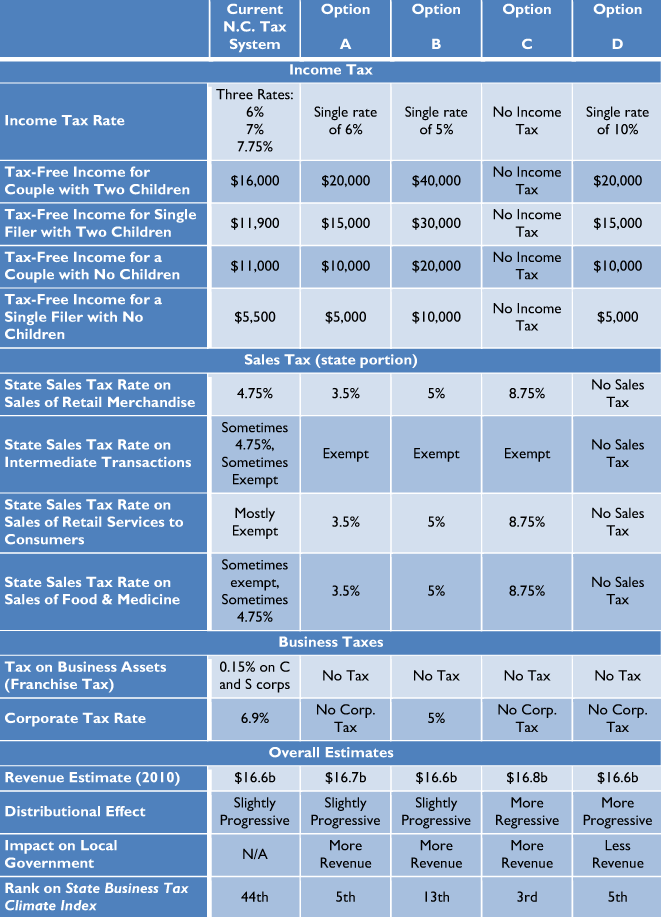
Table 2: Combined State Income & Sales Tax Liability under Reform Options
 Source: Tax Foundation calculations; Internal Revenue Service; U.S. Census Bureau; North Carolina Department of Revenue.
*Negative liability depending on EITC eligibility.
Includes average local sales tax of 2.1 percent; excludes federal tax liability and other state and local taxes. Calculations do not include EITC or grocery tax credit. Estimates are static analysis that assumes no immediate dynamic income growth from tax changes. Calculation assumptions: Using averages from IRS SOI data from 2009, calculations assume that income levels up to $60,000 take the standard deductionThe standard deduction reduces a taxpayer’s taxable income by a set amount determined by the government. It was nearly doubled for all classes of filers by the 2017 Tax Cuts and Jobs Act (TCJA) as an incentive for taxpayers not to itemize deductions when filing their federal income taxes.
, that the $100,000 income level takes 15 percent of income in itemized deductionItemized deductions allow individuals to subtract designated expenses from their taxable income and can be claimed in lieu of the standard deduction. Itemized deductions include those for state and local taxes, charitable contributions, and mortgage interest. An estimated 13.7 percent of filers itemized in 2019, most being high-income taxpayers.
s, that the $250,000 income level takes 11 percent of income in itemized deductions, and that the $500,000 level takes 8 percent of income in itemized deductions. Sales tax calculation assumptions used average estimates from national Consumer Expenditure Survey data from 2011: Households at $10,000 level spend 70 percent of income on taxable purchases at the current sales tax base and 135 percent on taxable purchases after base broadeningBase broadening is the expansion of the amount of economic activity subject to tax, usually by eliminating exemptions, exclusions, deductions, credits, and other preferences. Narrow tax bases are non-neutral, favoring one product or industry over another, and can undermine revenue stability.
; for households at the $25,000 level, 44 percent and 82 percent, respectively; for the $40,000 level, 33 percent and 60 percent, respectively; for the $60,000 level, 32 percent and 57 percent, respectively; for the $100,000 level, 26 percent and 44 percent, respectively; for the $250,000 level, 24 percent and 36 percent, respectively. See Appendix for detailed tables.
Table 3: Effective Tax Rates Combined State Income & Sales Tax Liability under Reform Options
 Source: Tax Foundation calculations; Internal Revenue Service; U.S. Census Bureau; North Carolina Department of Revenue.
*Negative liability depending on EITC eligibility.
Includes average local sales tax of 2.1 percent; excludes federal tax liability and other state and local taxes. Calculations do not include EITC or grocery tax credit. Estimates are static analysis that assumes no immediate dynamic income growth from tax changes. Calculation assumptions: Using averages from IRS SOI data from 2009, calculations assume that income levels up to $60,000 take the standard deduction, that the $100,000 income level takes 15 percent of income in itemized deductions, that the $250,000 income level takes 11 percent of income in itemized deductions, and that the $500,000 level takes 8 percent of income in itemized deductions. Sales tax calculation assumptions used average estimates from national Consumer Expenditure Survey data from 2011: Households at $10,000 level spend 70 percent of income on taxable purchases at the current sales tax base and 135 percent on taxable purchases after base broadening; for households at the $25,000 level, 44 percent and 82 percent, respectively; for the $40,000 level, 33 percent and 60 percent, respectively; for the $60,000 level, 32 percent and 57 percent, respectively; for the $100,000 level, 26 percent and 44 percent, respectively; for the $250,000 level, 24 percent and 36 percent, respectively.
PRINCIPLES OF GOOD TAX POLICY
Creating sound tax policy is more than a question of how much revenue is being raised and whether that amount is too much or not enough. Public finance experts and economists generally agree that not all taxes are created equal, and certain types of taxes are more damaging to the economy than others. The first modern public finance expert was Adam Smith, author of The Wealth of Nations. In that work, Smith outlined a few helpful principles of sound tax policy that can continue to serve as the cornerstone of tax reform discussions everywhere:
Simplicity
Time spent complying with taxes is a burden on individuals, and administrative costs are a loss to society. Complicated taxation also undermines voluntary compliance by creating incentives to shelter and disguise income. As Smith wrote, taxes should not be “more burdensome to the people than they are beneficial to the sovereign.”[8] With the complexity of the federal income tax, state tax codes should strive not to add to that complexity. Taxes may be the price of civilized society, as Justice Holmes once wrote,[9] but they ought to be as civil as possible.
Transparency
Tax rates and bases should be easily understandable by taxpayers. Tax changes should be made with careful consideration and input, allowing taxpayers to understand how much and how they will pay their taxes. As Smith wrote, “The time of payment, the manner of payment, the quantity to be paid, ought all to be clear and plain to the contributor, and to every other person.”[10]
Neutrality
The fewer economic decisions that are made for tax reasons, the better. Taxes are meant to raise revenue for necessary government services, not pick winners and losers in the economy. As much as is possible, the tax code should tax similar activities at the same rate, and not “fall unequally even upon that particular sort of private revenue which is affected by it.”[11] Economists often refer to the best tax system as one with “broad bases and low rates.”
Stability
Frequent changes to tax codes makes long term economic planning difficult and unpredictable. Temporary tax laws should be avoided. Taxes instead should “be levied at the time, or in the manner in which it is most likely to be convenient for the contributor to pay it.”[12]
GUIDELINES FOR SUCCESSFUL TAX REFORM
Excerpted from Prof. Benjamin Russo, State Tax Reform: Evidence, Logic, and Lessons from the Trenches, 39 State Tax Notes 467 (Feb. 13, 2006).
Push for Broader Bases & Lower Rates
Aside from serving as a good overall vision, broad tax bases are best for long-run revenue adequacy and minimizing the effects of economic volatility. Rate reductions, if sufficient, can be the tradeoff for losing special tax benefits.
Start with Principles
The tax reform effort should be guided by a set of uncontested principles, such as the desire for a fair, simple, pro-growth tax system.
Strive for Revenue Neutrality
Inequitable, relatively inefficient, complicated, unstable, and insufficient tax systems are so mainly because of flaws in their structures. Reform may be less controversial if it is made clear that the goal is revenue-neutral repair of the tax structure.
Apply Principles to the Whole, Not the Parts
Individual tax structures will satisfy one criterion but fall short on others. The reform package should be measured by the entire tax package, not individual parts.
Listen!
Seek out advice of taxpayers and administrators, as they often have unique insight into simplification and into what is and is not possible.
Acknowledge the Downside
Transparency dictates being open about the “losers” in tax reform as well as the “winners.”
Educate Policymakers
Complexity of tax issues is one reason that reform is difficult, and misunderstandings are widespread.
NORTH CAROLINA’S EVOLVING ECONOMY
The following charts illustrate how North Carolina has made substantial economic progress and job gains in recent decades, but is still trending below U.S. averages and key competitor states.
Income
In 1940, the average personal income of a North Carolina resident was $320 per year, barely half the U.S. average of $593 per year. By 1997, North Carolina had closed much of this gap in absolute and relative terms: that year, average personal income in North Carolina stood at $23,945, compared to the U.S. average of $27,402. Since 1997, however, North Carolina has lost ground relative to the U.S. average (see Figure 4).
Figure 4: North Carolina Average Personal Income as a Percent of U.S. Average, 1929-present
(U.S. Average Personal Income = 100%)

Source: Bureau of Economic Analysis.
North Carolina’s regional neighbors have made similar advances in closing the gap with the rest of the country (see Figure 5). Virginia has soared to become an above-average state, with Florida and Texas not far behind. North Carolina’s income statistics have closely tracked those of its neighbors Georgia and Tennessee (although Tennessee moved ahead in 2010), and ahead of its neighbor South Carolina. The gap between the states generally has also shrunk: in 1930, average income in the richest state (New York) was 5.2 times the average income in the poorest state (Mississippi), but by 2010, average income in the richest state (Connecticut) was just 1.8 times average income in the poorest state (Mississippi).
Figure 5: Select States’ Personal Income as a Percent of U.S. Average
(U.S. Average Personal Income = 100%)
 Source: Bureau of Economic Analysis.
Gross State Product
Similarly, North Carolina has a below-average Gross State Product (GSP) per capita, compared with U.S. Gross Domestic Product (GDP) per capita. The gap between them was nearly closed in 1999-2000, but the divergence has broadened (see Figure 6).
Figure 6: U.S. and North Carolina GDP per capita, 1997-2011
 Source: Bureau of Economic Analysis.
Unemployment
Prior to 2000, North Carolina had a lower unemployment rate than the U.S. as a whole (Figure 7); since then, North Carolina’s unemployment rate was slightly higher until the recent recessionA recession is a significant and sustained decline in the economy. Typically, a recession lasts longer than six months, but recovery from a recession can take a few years. , when it became notably higher. The unemployment rate in the Raleigh-Durham metropolitan area remains lower than the unemployment rate for the state and country as a whole, while that of the Charlotte metropolitan area remains higher (Figure 8).
The economic situation varies by region within North Carolina. Generally, metropolitan North Carolina is growing while small towns and rural areas are struggling. For instance, the small town of Robbins in northern Moore County has lost much of its economic base since its textile mills closed in the 1990s. Per capita income ranges from a low of $23,925 in Tyrell County to a high of $46,713 in Orange County in the Research Triangle. Part of this income and unemployment difference is due to education differences: statewide, only 26% of adults have a bachelor’s degree education or better, while the percentage is much higher in the cities of Raleigh (47%) and Charlotte (40%).
Figure 7: U.S. and North Carolina Unemployment Rate, 1990-2012
 Source: Bureau of Labor Statistics.
Figure 8: Raleigh and Charlotte Unemployment Rate, 1990-2012
 Source: Bureau of Labor Statistics.
Manufacturing
Generally, North Carolina is evolving from a manufacturing-centered economy to a service-centered economy. While manufacturing still accounts for one-fifth of the state’s economy (down from over a quarter in 1997), private services now account for nearly two-thirds of gross state product (Figure 8). The finance & insurance sector has notably grown in recent years. Government (not pictured; primarily education and military) represents about 14 percent of the state’s economy.
Figure 9: North Carolina Key Industries by GSP Percentage, 1997-present

Source: Bureau of Economic Analysis.
While manufacturing is dropping as a share of the economy, several key industries remain steady (e.g., tobacco, food, and beverage), or are sharply growing (computers & electronics, machinery, and chemicals) (see Figure 10). Textile manufacturing (dashed line), a historic centerpiece of North Carolina manufacturing, has declined.
Figure 10: North Carolina Key Manufacturing by Type, 1997-2010
 Source: Bureau of Economic Analysis.
Services
Services have grown across the board, with finance and insurance representing the most dramatic rise (see Figures 11 & 12). The growth of services as a share of economic activity presents a particular challenge for the sales tax, which taxes goods but not services.
Figure 11: Service Industries’ Share of North Carolina’s Economy
 Source: Bureau of Economic Analysis.
Figure 12: North Carolina Key Services by Type, 1997-2010
 Source: Bureau of Economic Analysis.
Interstate Migration
Interstate migration is another metric of economic health, and North Carolina has consistently attracted more people and income into the state than have left (see Table 13). Since 1993, the state has attracted a net of 872,000 people and nearly $23 billion in income.
Table 13: Income Migration between North Carolina and Other States, 1994-2010

North Carolina GAINED net
income from these states:
New York ($5.3 billion)
New Jersey ($3.0 billion)
Virginia ($2.8 billion)
Pennsylvania ($2.2 billion)
California ($2.0 billion)
Florida ($1.9 billion)
Ohio ($1.8 billion)
Maryland ($1.5 billion)
Connecticut ($1.3 billion)
Illinois ($1.3 billion)
and 30 other states
Note: 1994 to 2010. In three states, North Carolina lost net population but gained net income (Alaska, Arkansas, and Texas). Source: Internal Revenue Service
NORTH CAROLINA’S
EXISTING TAX SYSTEM
In 1921 and 1933, North Carolina implemented comprehensive tax reform, with the goal of financing a state takeover of local government responsibilities, for the purpose of providing a uniform level of government services across the state. As noted by the 2002 tax reform commission, “One consequence of that policy decision is that North Carolina relies more heavily than does almost any other state on state taxpayers to finance roads, schools, corrections, and courts.”[13]
North Carolinians consequently face a higher income tax burden and a lower property tax burden than other Americans. Taking state and local tax burdens together, North Carolina is medium-high nationally and high regionally.
North Carolina has many areas of its tax code that fail to comport with the principles of sound tax policy. From our meetings with business leaders and policymakers in the state, and from our research on the economic efficiency of various tax structures, we have isolated several components of North Carolina’s code that, with reform, would generate more equitable treatment of taxpayers, attract new businesses, and increase economic growth.
SOURCES OF REVENUE
HEAVY RELIANCE ON INCOME TAX, FEDERAL AID
For Fiscal Year 2012-13, North Carolina’s state government will spend just over $51.4 billion. 35 percent ($18.0 billion) of that amount will come from federal aid; 21 percent ($10.5 billion) from tuition, hospital fees, and other fees; and the remaining 44 percent ($22.9 billion) will come from taxes and other general revenues (see Table 14). As a percentage of the total budget, individual income taxes make up 20 percent ($10.2 billion), sales taxes make up 11 percent ($5.5 billion), and the corporate income tax makes up 2 percent ($1.06 billion).
Table 14: North Carolina State Government Sources of Revenue, 1989-present
Billions of dollars
 Source: North Carolina Office of State Budget & Management, Statistical Abstract of North Carolina Taxes.
In Fiscal Year 2010 (the latest year for which full data is available), state and local governments in North Carolina together spent $79.9 billion (48 percent by the state government and 52 percent by local governments).[14] Of this combined amount (see Figure 15), $32.7 billion was raised by taxes: $9.1 billion from the income tax, $8.6 billion from property taxes, $8.0 billion from sales taxes, $3.8 billion from excise taxAn excise tax is a tax imposed on a specific good or activity. Excise taxes are commonly levied on cigarettes, alcoholic beverages, soda, gasoline, insurance premiums, amusement activities, and betting, and typically make up a relatively small and volatile portion of state and local and, to a lesser extent, federal tax collections. es, and $1.3 billion from the corporate income tax, $0.7 billion from the franchise tax, and $1.2 billion from other taxes.
Figure 15: North Carolina State & Local Government Sources of Revenue, 2010
As a Percent of Total Revenue

Source: U.S. Census Bureau, 2010 Annual Surveys of State and Local Government Finance.
Looking at it another way (excluding local governments, fees, and non-tax revenues), every $1 in taxes collected by the North Carolina state government is made up of 42¢ in state individual income taxAn individual income tax (or personal income tax) is levied on the wages, salaries, investments, or other forms of income an individual or household earns. The U.S. imposes a progressive income tax where rates increase with income. The Federal Income Tax was established in 1913 with the ratification of the 16th Amendment. Though barely 100 years old, individual income taxes are the largest source of tax revenue in the U.S. , 27¢ in sales taxes, 20¢ in excise taxes (including 7¢ in gasoline tax and 3¢ in car tax), 6¢ in corporate tax, and 5¢ in other taxes. North Carolina relies more on individual income taxes and less on property taxes than the average state, and is about average on sales taxes.[15]
STATE-LOCAL TAX BURDEN
MEDIUM-HIGH NATIONALLY, HIGH REGIONALLY
Tax collections measures amounts collected by state and local governments. Tax burdens, by contrast, moves the focus from the tax collector to the taxpayer. For two decades, the Tax Foundation has estimated the percentage of state income that residents in each state are paying in state and local taxes. Collections data are adjusted for tax importation and tax exportation, and the result is a percentage paid in state-local taxes and a ranking. For the most recent year available, New Yorkers pay the most in state-local taxes (12.8 percent of personal income); Alaskans pay the least (7.0 percent).[16]
North Carolinians have a higher-than-average state-local tax burden. In Fiscal Year 2010, the latest year for which information is available, residents of the state paid $3,535 per capita in all state-local taxes (including $887 in taxes to other states), a rate of 9.9 percent of income and 17th highest in the country and higher than all nearby states (see Figure 16).
Figure 16: State & Local Tax Burdens as Percentage of State Income, FY 2010
 Source: Tax Foundation.
Specifically, North Carolina’s 9.9 percent (17th highest) compares to South Carolina’s 8.4 percent (41st highest), Virginia’s 9.3 percent (30th highest), Tennessee’s 7.7 percent (48th highest), and Georgia’s 9.0 percent (33rd highest).
Over time, North Carolinians’ tax burden has remained relatively steady since 1980, staying mostly between 9.0 percent and 10.2 percent of personal income (see Figure 17). Since 2004, however, it has exceeded the national average.[17]
Figure 17: North Carolina State-Local Tax Burden as Percentage of Personal Income, Compared to U.S. Average, 1980 to 2010

Source: Tax Foundation.
STATE BUSINESS TAX CLIMATE
BOTTOM TEN
Each year the Tax Foundation produces the State Business Tax Climate Index to enable business leaders, government policymakers, and taxpayers to gauge how their states’ tax systems compare.[18] While total taxes paid is a relevant measure, another is how the elements of a state tax system enhance (or harm) the competitiveness of a state’s business environment. The Index looks at over 100 variables in individual income tax, corporate income tax, sales tax, unemployment insurance tax, and property tax to reduce these many complex considerations to an easy-to-use ranking.
In the most recent report (see Figure 18), which gauges states as of July 1, 2012, the states with the best tax systems are Wyoming, South Dakota, Nevada, Alaska, Florida, Washington, New Hampshire, Montana, Texas, and Utah. The states with the worst tax systems are New York, New Jersey, California, Vermont, Rhode Island, Minnesota, North Carolina, Wisconsin, Iowa, and Maryland. North Carolina has one of the best unemployment tax systems, but is middle-of-the-pack or poor relative to the other states for the other major tax categories (see Table 19). North Carolina has the least business-friendly tax climate of any state in the southeast.
Figure 18: State Business Tax Climate Index, FY 2013

Source: Tax Foundation.
Table 19: 2013 State Business Tax Climate Index Ranks and Component Tax Ranks

Note: A rank of 1 is more favorable for business than a rank of 50. Rankings do not average to total. States without a tax rank equally as 1. D.C. score and rank do not affect other states. Report shows tax systems as of July 1, 2012 (the beginning of Fiscal Year 2013).
Source: Tax Foundation.
CORPORATE INCOME TAX
HIGH RATE, NARROW BASE
North Carolina’s corporate income tax is a flat 6.9 percent, the highest rate in the southeast (see Figure 20), higher than all neighboring states. The tax is poorly structured, with the biggest reason for the high rate being that the tax gives away roughly 35 cents in tax carve-outs for each dollar it collects in revenue.[19] Despite the high rate, in Fiscal Year 2009, the tax only accounted for 2.8 percent of state and local revenue collected in North Carolina.
Figure 20: Top State Corporate Income Tax Rates, 2012

These tax carve-outs act as a poorly structured subsidy program for favorable businesses in the state, but because they are done through the tax code, they are not subject to the same kind of scrutiny as are subsidies through spending appropriations. Economically, they are equivalent, as businesses that do not qualify for special credits operate on a different playing field as favored groups. The complexity added by targeted incentives results in companies needing teams of accountants and lawyers to find tax preferences that lower their tax bill.
Economists generally agree that corporate income taxes are not borne by businesses but are instead passed on to consumers in the form of higher prices, shareholders in the form of lower dividends, or labor in the form of lower wages.[20] This observation, coupled with the low revenue collection of corporate taxes, poor structure of their bases, and relatively small share they represent of state tax collections has led some observers to conclude that corporate tax repeal is a necessary, if not obvious, reform for state tax codes.[21]
Six states do without a corporate tax, although three of those six instead impose more destructive gross receipts taxA gross receipts tax, also known as a turnover tax, is applied to a company’s gross sales, without deductions for a firm’s business expenses, like costs of goods sold and compensation. Unlike a sales tax, a gross receipts tax is assessed on businesses and apply to business-to-business transactions in addition to final consumer purchases, leading to tax pyramiding. es on businesses. Wyoming, South Dakota, and Nevada do not have a corporate income tax or a gross receipts tax, and, not coincidentally, are the top three scoring states in the State Business Tax Climate Index.
Net Economic Loss & Carryforward
It is for convenience reasons that we tax income on an annual basis. However, that arbitrary time choice can be problematic for corporations with cyclical income, seeing high profits one year but losses the next. The federal government and most states allow corporations to deduct losses from previous years to offset current taxes owed. These Net Operating Loss (NOL) “carrybacks” and “carryforwards” smooth out tax obligations over time. This policy is valuable because it assures that industries with cyclical income are not set at a competitive disadvantage against industries with more stable revenue.
Twenty-six states and the District of Columbia (including Florida, Georgia, South Carolina, and Virginia) allow businesses to use past losses to offset current tax obligations for up to 20 years; North Carolina only allows 15 years. Fifteen states (including Georgia and Virginia) allow businesses to carry back losses against past taxes for 2 or 3 years; North Carolina does not allow any loss carrybacks. See Table 21 for net operating loss rules in neighboring states.
Table 21: Net Operating Loss Rules in Select States
 Source: Tax Foundation.
Additionally, North Carolina has a limited definition of “losses.” While other states allow any net operating loss to be carried forward, North Carolina requires that companies take their losses minus “a proportionate amount of any nontaxable income received in the loss year.” This unique provision weakens the business cycle neutrality that carryforwards are designed to foster while adding complexity due to the separate definition of taxable incomeTaxable income is the amount of income subject to tax, after deductions and exemptions. For both individuals and corporations, taxable income differs from—and is less than—gross income. needed for this one provision on the tax form.[22]
Apportionment Formulas, Combined Reporting, & Throwback Rules
Multistate corporations earn profits all over the country and the world, so determining how much of the profit each state may tax is complicated. At one time, states adhered to a uniform formula averaging the share of employees in the state, the share of property in the state, and the share of sales in the state. If a company had all of its sales in a state but none of its employees or property there, the state would apply its tax to one-third of the company’s profits. If a company had all of its property and employees in a state but none of its sales there, the state would apply its tax to two-thirds of the company’s profits.
This “three-factor” apportionment formula has been superseded in many states, including in North Carolina, by heavier weighting of the sales factor (and lower weighting to payroll and property factors) as states sought to shift tax burdens away from in-state businesses toward out-of-state businesses. The eagerness by which states have adopted single sales factor and encouraged targeted tax incentives to select companies—with little sign of the trend halting—is more evidence of the eventual extinction of the state corporate income tax as a significant revenue source in a globally competitive economy.
Some states have sought to raise corporate taxes by requiring corporations to treat certain out-of-state sales like in-state sales with policies such as mandatory unitary combined reporting or “throwback” or “throwout” rules. Pursuing these policies would increase distortions without changing the overall trend and put North Carolina at a competitive disadvantage (see Table 22).
Table 22: Corporate Tax Base Rules in Select States
 Source: Tax Foundation.
*North Carolina’s Department of Revenue requires corporationAn S corporation is a business entity which elects to pass business income and losses through to its shareholders. The shareholders are then responsible for paying individual income taxes on this income. Unlike subchapter C corporations, an S corporation (S corp) is not subject to the corporate income tax (CIT).
s to count as North Carolina sales any sales into a state where a tax return is not required to be filed. While this is neither required by statute nor considered a throwback rule by the Department of Revenue, it has the hallmarks of a throwback rule.
Economic Development Incentives
Between 2003 and 2009, North Carolina state government spent a cumulative $6.7 billion in economic development incentives, through tax abatements, tax credits, or special incentive packages. Concentrated especially in the high-tech, manufacturing, and film sectors, the state has received accolades for its willingness to put cash on the table to land new facilities and investments. As Incentives include a 3.5% investment tax credit over four years, a $750 per new job tax credit over four years, a 3.5% of new payroll manufacturing tax credit over eight years, a 1.25% research and development tax credit, and a 50% property tax abatement on improvements over five years.
Even if all targeted economic development efforts work out spectacularly, they will be insufficient to create all of the jobs North Carolina needs each year. For example, the North Carolina Department of Commerce reported in 2011 that it engaged in 570 development project announcements that year, a 22 percent increase over 2010.[23] This is a drop in the bucket compared to the 800,000 small businesses in the state.[24] The 28,711 new jobs relating to the incentives—some induced by the incentives but some occurring anyways— compares to the 440,000 unemployed North Carolinians in 2012.[25] Incentives can be effective (particularly with performance measures and expectations) but are not efficient. Targeted tax credits do not and cannot substitute for good tax, regulatory, infrastructure, and education policies.
Because the focus of North Carolina economic development should be on these basic structural questions and not on incentives, our report does not recommend paring back incentive programs. This may be advisable policy but not necessarily politically practicable. As the state is playing venture capitalist, there are times when the investment will not pan out. High-growth firms create lots of jobs but care more about fundamentals than targeted incentive packages. At minimum, officials should subject incentive programs to strong oversight and review performance metrics, evaluating whether they are the best use of scarce taxpayer resources. To the extent tax incentives make up for other tax deficiencies, such as high local personal property taxes, the core problem should be addressed for all taxpayers and not just select incentive recipients.
Options A, C, and D delete the corporate income tax and all accumulated credits associated with it. Option B retains the corporate income tax at a 5 percent rate, and assumes that credits will be prorated to that rate.
FRANCHISE TAX
AN ARCHAIC TAX ON CAPITAL INVESTMENT
North Carolina is one of 20 states retaining the once-universal franchise, or capital stock, tax on the net worth of businesses (see Table 22). Described as a “tax on breathing,” the North Carolina franchise tax is a 0.15 percent annual tax paid on the wealth of a C or S corporation. Because the tax is paid in good times and bad, businesses often find themselves using precious cash flow to pay it. The tax raises approximately $700 million per year.
In broad economic terms, franchise taxes (or capital stock taxes, as they are sometimes called) are destructive because they disincentivize the accumulation of additional wealth, which distorts the size of firms. Several states have recognized this harmful effect and are moving away from franchise taxes as a source of revenue. West Virginia and Pennsylvania will fully phase out their tax by 2015 and 2014, respectively, and Kansas recently completely repealed its tax in 2011.
Only three of North Carolina’s neighbors retain the tax: Georgia has only a de minimis tax capped at $5,000, Tennessee has a higher tax, and South Carolina has a lower tax. At present rates, a large business (one with $100 million or more in assets) in North Carolina would face the 9th highest franchise tax liability in the country (tied with New York; see Table 23).
Table 23: States with Capital Stock (Franchise) Taxes, as of July 1, 2012

Source: Tax Foundation; Commerce Clearing House.
INDIVIDUAL INCOME TAX
TOP RATE IS THE HIGHEST IN THE SOUTHEAST REGION
North Carolina’s individual income tax, first enacted in 1921, has a graduated rate structure, meaning that taxable income above each threshold (after subtracting deductions and exemptions) is taxed at progressively higher percentages (see Table 24). North Carolina currently allows a standard deduction ($3,000 for singles; $6,000 for married filing jointly; and $4,400 for head of household) and a $2,500 personal exemption for each dependent (phased out for high-income taxpayers).
Table 24: North Carolina Individual
|
|
| Taxable Income | Tax Rate |
| >$0 | 6% |
| >$12,750 | 7% |
| >$60,000 | 7.75% |
North Carolina’s top income tax rate is the highest in the region, and the other lower rates are still relatively high and kick in at low levels of income (see Figure 25). As North Carolina grows its finance sector, many prospective employees will have income levels above the top bracket, so the comparison to other states in the region (and other finance centers) is important for relocation decisions.
Excessive taxes on income are also generally less desirable than taxes on consumption because they discourage wealth creation. In a comprehensive summary of international econometric tax studies, Arnold et. al. (2011) found that personal income taxes are among the most destructive to growth, being outdone only by corporate income taxes.[26] The authors found that consumption and property taxes are the least harmful.
The economic literature on progressive income taxes is especially unkind.[27] For example, the Arnold et. al. study finding that reductions in the top marginal rate of income taxes would be beneficial to long term growth. Examining the period 1969-1986, Mullen and Williams (1994) found that higher marginal tax rates reduce gross state product growth. This finding even adjusts for the overall tax burden of the state, lending credence to the principle of broad bases and low rates.[28]
Prescott (2004) found that that progressive income taxes in Europe in the 1970s led workers on average to work fewer hours and not seek additional career-advancing opportunities.[29] This means that progressive taxA progressive tax is one where the average tax burden increases with income. High-income families pay a disproportionate share of the tax burden, while low- and middle-income taxpayers shoulder a relatively small tax burden. policy today can hinder the long run earning potential of a worker for the rest of their life. There is good evidence that progressive income taxes in Europe in the 1970s led workers on average to take on fewer hours and not seek additional career-advancing opportunities.[30]
A better approach would be to tax income at a lower rate but on a broader base, reducing the “sticker shock” of North Carolina’s current out-of-line tax rates. Applying the tax to all adjusted gross income would greatly reduce the taxpayers’ costs of figuring out state taxes, eliminate distortions between types of income, and maintain progressivity. North Carolina could also pursue joining the 9 other states (Alaska, Florida, Nevada, New Hampshire, South Dakota, Tennessee, Texas, Washington, and Wyoming) that do not have an individual income tax.
Figure 25: Top State Income Tax Rates, Tax Year 2012

SALES TAX
North Carolina was the second U.S. state to adopt a sales tax, doing so in 1933 as property tax revenues plummeted during the Great Depression. Initially a 3 percent temporary tax, it was made permanent in 1939. The rate went up in 1991 to 4 percent, up in 2001 to 4.5 percent, down in 2006 to 4.25 percent, up in 2008 to 4.5 percent, up in 2009 to 5.75 percent, then down in 2011 to the present 4.75 percent.
Local governments are authorized to charge add-on sales taxes up to 2.5 percent. In 91 counties, the local tax is 2 percent, for a combined state-local sales tax rate of 6.75 percent. Eight counties have a 2.25 percent local rate (combined rate of 7 percent), and Mecklenburg County has a local rate of 2.5 percent (7.25 percent). Averaging these figures and weighting them for population, North Carolina has a combined state and average local sales tax of 6.87 percent, the 23rd highest in the country (see Figure 26).[31]
Figure 26: Combined State and Average Local Sales Tax Rates, as of July 1, 2012

Sales Tax Applies to Business Inputs, Distorting Market
Another perhaps equally important sales tax reform is the exemption of business-to-business transactions from the sales tax. Business inputs should be exempt not because businesses deserve special treatment, but because failure to do so results in “tax pyramiding,” the process whereby taxes stack on top of each other as raw goods move through the production process.
As an example, if one were to build a car under a sales tax regime that taxes business-to-business transactions, the rubber of the tire would be taxed once when it was sold from the rubber producers to the tire company, then taxed again when the tire is sold to the car company, then taxed a final time when the finished car is sold to the end consumer. This practice inordinately burdens industries with long production lines with many components and has the inadvertent consequence of encouraging vertical integration to avoid taxes, even when it would not be otherwise economically efficient to do so. Finally, taxing business-to-business transactions reduces tax transparency, because while a statutory rate paid by the consumer at the point of final sale may be low, the business-to-business taxes are already embedded in the price of the product (see Figure 27 for an illustration).
Figure 27: Illustration of Taxes Embedded in Prices

By the latest estimate, sales taxes on business inputs make up 24 percent of total state and local business taxes collected in North Carolina. This is slightly higher than the 20 percent U.S. average.[32] Table 28 lists sales tax treatment of business-to-business transactions in select states.
Many states try to avoid these problems by engaging in the laborious task of picking products that are frequently used as business inputs and individually carving out exemptions for them in the sales tax code. This approach is a step in the right direction but does not and cannot ever comprehensively address all the items that businesses use in the production process and should therefore not pay sales taxes on. A more straightforward approach would be to give businesses an identifying card to present to retailers when making business purchases that exempts them from the tax on whatever they are buying.[33]
Table 28: Exemption of Select Business-to-Business Transactions in Select States as of July 1, 2012

T=Taxable; E=Exempt; R=Taxed at Reduced Rate; P=Partly Taxable Depending on Type.
Total is out of 50 states + DC.
Source: Tax Foundation; Commerce Clearing House.
Identical State & Local Sales Tax Base
North Carolina is one of just 7 states (Alabama, Arizona, Arkansas, California, Louisiana, New Jersey, and North Carolina) that permit the local sales tax base to be different from the state sales tax base.[34] While the difference is minor in North Carolina, compliance costs can skyrocket when retailers must deal with thousands of tax bases rather than merely dozens.
Sales Tax Does Not Apply to Services, at Expense of Goods Industry
When sales taxes were created in the 1930s as a response to falling revenues brought on by the Great Depression, most states placed them on goods and not services. This application to “the sale of tangible personal property” was for years a satisfactory base, as it taxed roughly two-thirds of the economy. However, in the decades since then, the service industry has expanded rapidly as the economy has grown, and goods now only make up one-third of the economy.
Professor John Mikesell, a leading sales tax scholar, estimates that North Carolina’s sales tax applies to about 31 percent of personal consumption expenditures, a drop from the 1970-2010 median of 44 percent and below the national average of 34 percent.[35] States that tax services have a broader base; South Dakota, for instance, applies its sales tax to an estimated 59 percent of consumption, and New Mexico applies its tax to an estimated 52 percent of consumption.
In response, instead of broadening the sales tax base to include services, most states have simply increased rates on the shrinking base of goods.[36] North Carolina is no exception and even exacerbates this narrow base and high rate situation by exempting from sales tax over $22 billion worth of annual food and medicine purchases.[37] When the state enacted the sales tax in 1933, the rate was 3 percent;[38] today the rate has climbed to 4.75 percent.[39] This practice is distortive to the economy as it discriminatorily burdens the goods industry but not the services industry. Services also represent a higher percentage of consumption for people with higher incomes, raising equity concerns.[40]
Expanding the sales tax to services has proven politically difficult; the only states that comprehensively tax services (Hawaii, New Mexico, and South Dakota) have done so since the inception of their sales tax. At the federal level, the Tax Reform Act of 1986 was able to overcome the efforts of individual lobbyists to preserve their tax benefits by enacting a comprehensive change (base broadening, rate reduction) that nearly everyone considered an improvement over the existing system.
Just as the federal tax reform of 1986 relied on producing a comprehensive, holistic reform that overcame the efforts of individual lobbyists to preserve tax benefits, a strong case can be made that successful sales tax base expansion must be comprehensive to succeed. A comprehensive effort in Florida in 1987 failed primarily due to the opposition of the Governor and the media. Attempts at limited base expansions have been more difficult, as defenders of exemptions mobilize to protect them, and are able to point out the injustice of being singled out while lawyers, accountants, real estate agents, etc. continue to offer tax-free services. This occurred in Maryland in 2007, when the state sought to tax “luxury” services. Lobbyists for the targeted services dissuaded the state, and the resulting legislation expanded the tax to just one service (computer services). This industry, which had no lobbyists in Annapolis, hired lobbyists and got the tax repealed.[41] These and other difficulties suggest that a comprehensive, fundamental approach would be more likely to succeed.
Five states have no state sales tax (Alaska, Delaware, Montana, New Hampshire, and Oregon). While no state taxes all final retail sales while exempting all business inputs, the three states that do it best are Iowa, Indiana, and Connecticut. States that do the worst job include North Dakota, Arizona, Nevada, New Jersey, and North Carolina (see Table 29). Even calculating potential revenue from base expansion is difficult, although the availability of NAICS and NAIPS data can allow for reasonably close approximations.[42]
Table 29: Taxability of Select Final Retail Services in Select States as of July 1, 2012

T=Taxable; E=Exempt. Total is out of 50 states + DC.
Source: Tax Foundation; Commerce Clearing House.
Appendix B reviews sales tax broadening options using National Income & Product Accounts (NIPA) categories. The estimates for Options A, B, and C in this report use “medium base-broadening” but narrower and broader base-broadening options are provided.
PROPERTY TAXES
North Carolina has medium-low property taxes relative to other states. This is primarily because North Carolina’s state government handles many functions that local governments in other states handle, a result of the 1921 and 1933 reforms. The property tax is now an exclusively local tax in the state. As a percentage of median home value, as of 2010, North Carolinians pay an average 0.8 percent property tax rate, the 32nd highest in the country (see Table 30 and Figure 31). Texans, by contrast, pay an average 1.9 percent property tax rate, the 4th highest in the country. The U.S. average is 1.1 percent.
Table 30: Property Taxes on Owner-Occupied Housing as Percentage of Median Home Value, 2010

Source: Tax Foundation calculations from U.S. Census Bureau data.
Figure 31: Median Property Taxes Paid by County, 2005-2009 Average

Source: Tax Foundation calculations from U.S. Census Bureau data.
TRANSPORTATION TAXES & FEES
North Carolina currently taxes gasoline at a rate of 37.8 cents per gallon, substantially more than neighboring states (see Table 32 and Figure 33) with fewer state-maintained roads. This tax differential affects the prices of gas at the pump, which leads creative commuters to fill up in other states when they get the chance, avoiding a higher bill. All of the states surrounding North Carolina boast gas prices that are at least five cents per gallon less expensive. For a car that holds 15 gallons of gas, filling up in North Carolina would be approximately $2.63 more expensive than filling up across the border in South Carolina.[43]
Table 32: Gasoline Taxes and Prices per Gallon in Select States, 2013

Source: American Petroleum Institute, American Automobile Association.
However, road funding should come out of taxes on gasoline and tolls on roads within the state. By funding roads from these sources, policymakers ensure that those drivers contribute to transportation funding in proportion to how much they drive. By contrast, funding roads out of the general fund makes roads “free,” and there is no price incentive for drivers to use roads economically. The result is overutilization, traffic congestion, and increased need for repairs as roads wear down more frequently.
Support for user-based provision of roads crosses ideological lines among policy experts. The Institute on Taxation and Economic Policy, which describes its work as focused particularly on issues of tax fairness and sustainability, noted in December 2011:
Lawmakers’ shortsightedness when it comes to the gas taxA gas tax is commonly used to describe the variety of taxes levied on gasoline at both the federal and state levels, to provide funds for highway repair and maintenance, as well as for other government infrastructure projects. These taxes are levied in a few ways, including per-gallon excise taxes, excise taxes imposed on wholesalers, and general sales taxes that apply to the purchase of gasoline. has also resulted in an increasing amount of pressure on other areas of state budgets. In 2011 alone, Nebraska, Utah, and Wisconsin all passed new legislation authorizing long term raids on their general funds in order to finance transportation. Oklahoma and Virginia’s governors are pushing for lawmakers to enact similar legislation in 2012.[44]
The Competitive Enterprise Institute, on the other side of the political spectrum, similarly notes that “maintaining the ‘user-pays/user-benefits’ funding principle should be of the utmost importance to transportation policy makers.”[45]
Finally, while cross-border shopping does exist, it might not exist much longer, as other states (notably South Carolina)[46] have seen proposals for gas tax increases as revenue shrinks. Most state gas taxes are not inflationInflation is when the general price of goods and services increases across the economy, reducing the purchasing power of a currency and the value of certain assets. The same paycheck covers less goods, services, and bills. It is sometimes referred to as a “hidden tax,” as it leaves taxpayers less well-off due to higher costs and “bracket creep,” while increasing the government’s spending power. indexed (though North Carolina’s is linked to the wholesale price of gas), so unless increased by legislation, each year they collect less in real terms.[47]
One option for raising necessary revenue for transportation but also maintaining competitive gas prices is to increase the reliance on tolls where possible. Tolls are even more effective at linking drivers to the road services they use, because cross-border effects do not exist.
Figure 33: Gasoline Tax Rates by State, 2013

TAX ADMINISTRATION
The Council on State Taxation (COST) regularly grades states on their tax administration procedures. As they note:
[O]ur federal and state tax systems are premised, to a great degree, on voluntary compliance. It is a common truth that taxpayers will more fully and willingly comply with a tax system they perceive to be balanced, fair, and effective. Taxpayers operating in a system they perceive as oppressive, unfair, or otherwise biased are less likely to voluntarily comply. The clear message to state legislatures is that they must be sensitive to the compliance implications and competitiveness concerns created by poor tax administrative rules and ineffective tax appeal systems.[48]
Key elements COST evaluates in state tax administration include:
- Whether the forum deciding taxpayer appeals is independent of the tax collection authority. About half the states have separated the tribunal or court hearing tax cases from the department of revenue, preserving both objectivity and the appearance of objectivity.
- Whether taxpayers are required to pay or post a bond prior to an independent hearing and resolution of a dispute (“pay-to-play”). Some states deny taxpayers a fair hearing before depriving them of their property.
- Whether the record for further appeals can be established before an independent body.
- Whether the arbiter at the hearing is well-versed in state tax laws and concepts.
- Whether the state is even-handed in imposing statutes of limitations for refunds and assessments. If a state can reach back three years to assess taxes, taxpayers should be able to reach back three years in pursuing refund claims.
- Whether interest rates on refunds and assessments are equalized.
- Whether taxpayers have adequate time to file a protest before an independent dispute forum. The American Bar Association recommends a 90-day protest period, and with taxpayers complying with multiple jurisdictions, protest periods of less than 60 days are unreasonable.
- Whether corporate income tax return due dates are at least 30 days after the federal due date with procedures for automatic extension upon a federal extension.
- Whether the state has reasonable and clearly defined procedures for filing amended returns after a change in federal liability.
- Whether the state has any additional ineffective, burdensome, or inequitable practices, such as contingent fee audits, duplicative local revenue departments, use of outside counsel to litigate cases, or retroactive statutes, penalties, or interest.
In their 2010 report, the most recent produced, COST determined Alaska to have the best state tax administration and California the worst. North Carolina received a B minus, a major improvement from the state’s D grade in the 2007 report (see Table 34; points r epresent areas of concern).
Table 34: North Carolina Grade on COST 2010 Administrative Scorecard
 Source: Council on State Taxation.
COST identified these issues with North Carolina’s tax system (as of 2010):
- Independent Dispute Forum. The Secretary of Revenue retains the statutory power to override the decision of the independent hearing officer, although taxpayers may appeal to Business Court. N.C. Gen. Stat. § 105-241.15 et seq.
- Pay-to-Play. While pay-to-play is not required to reach a hearing officer, it is required to appeal to Business Court. N.C. Gen. Stat. § 105-241.13 et seq.
- Ample Protest Period. Taxpayers have only 45 days to protest an assessment. N.C. Gen. Stat. § 105-241.11(a).
- Return Due Date/Automatic Extension. 6-month extensions do not occur automatically with a federal extension but require filing of Form CD-419. N.C. Gen. Stat. § 105-130.17(d) & N.C. Gen. Stat. § 105-263.
- Reporting Federal Tax Changes. No definition of final determination; changes must be filed within 6 months on an amended return. N.C. Gen. Stat. § 105-130.20.
- Other Issues
- Department of Revenue refuses to provide guidance on standards used for forced combination on auditA tax audit is when the Internal Revenue Service (IRS) conducts a formal investigation of financial information to verify an individual or corporation has accurately reported and paid their taxes. Selection can be at random, or due to unusual deductions or income reported on a tax return. .
- Retroactive imposition of controversial use tax presumption of nexus for soliciting sales.
DEBT, LIABILITIES, & CREDIT RATING
North Carolina has a low amount of government debt. As of 2009, the state owed $1,983 per capita, the 42nd highest among the states. For both state and local debt, $5,350 per person was owed, the 43rd highest among the states.
North Carolina’s public pension fund is mostly funded (one of just 7 states with over 90 percent funding ratio), but unfunded retiree health obligations remain worryingly high.[49]
North Carolina is one of just 13 states to maintain a AAA credit rating (see Figure 35). This highest rating is also held by regional neighbors Florida, Georgia, and Virginia. South Carolina and Tennessee are one notch down.
Figure 35: State Credit Ratings (S&P), as of July 2012

KEY PREVIOUS NORTH CAROLINA
TAX REFORM EFFORTS AND PROPOSALS
1921: Revenue Act of 1921
This major tax reform eliminated the state property tax (leaving it a strictly local tax), adopted an individual income and corporate income tax, and imposed a gasoline tax.
1933: Emergency Revenue Act of 1933
This major tax reform had the state assume fiscal responsibility for schools, roads, and prisons from the local governments. A temporary 3 percent sales tax was enacted, which was made permanent in 1939.
1951: The Sales Tax: Its History, Growth, Development, Problems, and Possibilities
Authored by Revenue Commissioner Eugene Shaw, this proposal recommended eliminating all exemptions except those constitutionally required (interstate sales, sales to government) and exempting inputs (sales of productive equipment and raw materials to farmers and manufacturers). The sales tax would also be extended to services.
1989: Tax Fairness Study Commission
This state panel made the following recommendations:
- Sales Tax: Eliminate sales tax cap of $300.
- Individual Income Tax: Conform to federal definition of income, retain the two tax brackets, increase tax credits for child care, elder care, and food purchases by low-income individuals to offset the sales tax.
- Corporate Income Tax & Franchise Tax: Repeal unnecessary tax credits.
- Other: Repeal the intangibles tax, increase penalties for tax evasion.
1991: Economic Future Study Commission
This state panel made the following recommendations:
- Sales Tax: Restructure the sales tax to tax all goods and services purchased by individuals, exempt inputs and raw materials, and eliminate existing sales tax preferences on purchases by individuals for personal use.
- Corporate Income Tax: Eliminate all special exemptions, deductions, and credits.
- Other: Repeal the intangibles tax, expand the cigarette tax to non-tobacco products, limit state budget growth to economic growth, implement a rainy day fund of up to 5% of state expenses, permit local governments to enact a land transfer tax, consider enacting a state lottery.
2001: Efficiency & Loophole-Closing Commission
This state panel recommended, among other things, expanding the franchise tax to LLCs, taxing vending machine sales, and imposing sales tax on the sale of fertilizer and seed to non-farmers.
2002: Governor’s Commission to Modernize State Finances
This blue ribbon state panel made the following recommendations:
- Sales Tax: Broaden the sales tax base to include food and services, but exempting business inputs; adhere to the Streamlined Sales Tax Agreement; have the state government collect local sales taxes.
- Individual Income Tax: Conform to the federal definition of income; enact an Earned Income Tax Credit (EITC) for low-income taxpayers.
- Corporate Income Tax & Franchise Tax: Retain the R&D tax credit but replace others with appropriated subsidies; adopt combined reporting; expand the franchise tax to pass-through entities; adopt a throwout rule; conform to the federal definition of income; consider returning to the three-factor apportionment formula.
- Other: Shift Medicaid costs from counties to the state; establish a State-Local Relations Commission; review unemployment insurance tax laws; repeal unnecessary fees; maintain a rainy day fund of at least 8 percent.
2005: N.C. Budget & Tax Center—A 21st Century Revenue Plan
This organization made the following recommendations:
- Sales Tax: Broaden the sales tax base to most services, candy, newspapers, and entertainment; lower rate to 3.25 percent.
- Individual Income Tax: Add two new brackets on high-earners; increase the EITC.
- Corporate Income Tax & Franchise Tax: Raise rate to 7.75 percent, revert to three-factor apportionment formula, adopt throwback rule, adopt combined reporting, repeal NOL deduction, and expand franchise tax to pass-through businesses.
- Other: Raise cigarette tax, retain estate tax, and raise real estate transfer tax.
2006: State & Local Fiscal Modernization
This state panel recommended broadening the income and sales tax bases, and using the revenue to lower tax rates.
2005-2009: Institute for Emerging Issues—Financing the Future
This multi-year working group of stakeholders made the following tax system recommendations:
- Reduce individual income tax and corporate income tax rates to competitive levels.
- Use the federal definition of income.
- Eliminate income tax deductions and credits.
2009: John Locke Foundation—Tax Reform in North Carolina
This organization made the following recommendations:
- Replace the individual income tax with a “consumed income tax,” exempting all saving and investment from tax.
- Repeal the corporate income tax.
- Eliminate all targeted tax incentives.
- Consolidate excise taxes into the sales tax at one rate.
2009: 21st Century Tax Rate Reduction & Modernization Plan (Senate)
This proposal, which ultimately did not pass, sought to raise revenue with the following changes:
- Sales Tax: Expand base to digital products, repair services, entertainment, and information services; lower rate to 4 percent; exempt depreciable equipment purchases
- Individual Income Tax: Lower all rates, create new zero bracket up to $10,000; conform to federal definition of income, exclude from federal AGI only EITC, child credit, mortgage credit (capped), charitable credit (capped), medical credit, and R&D credit.
- Corporate Income Tax: Lower rates; adopt throwout rule; repeal all credits except R&D and targeted incentives.
- Franchise Tax: Expand to LLCs.
- Other: Increase excise taxes on beer, wine, alcohol, and tobacco.
What the Legislature ultimately enacted in 2009 was a temporary individual income tax surcharge, a temporary sales tax increase, expansion of the sales tax to digital purchases, increased excise taxes, and expanded tax credits. As one official said at the time, “What was enacted violated every principle and recommendation.”
2012: Civitas Institute—More Jobs, Bigger Paychecks
This organization made the following recommendations:
- Sales Tax: Raise state rate to 6.5 percent; expand the sales tax base to all services taxed by at least one state, insurance premiums, residential leases, and lottery ticket sales; exempt business inputs; repeal preferential rates and exemptions.
- Individual Income Tax: Repeal.
- Corporate Income Tax: Repeal.
- Franchise Tax: Repeal but replace with new 1.05 percent annual tax on business net assets (assets less retained earnings) by all forms of business, with a $500 minimum payment.
- Other: Raise the real estate transfer tax to 1 percent.
Table 36: Common Themes in North Carolina Tax Reform Proposals
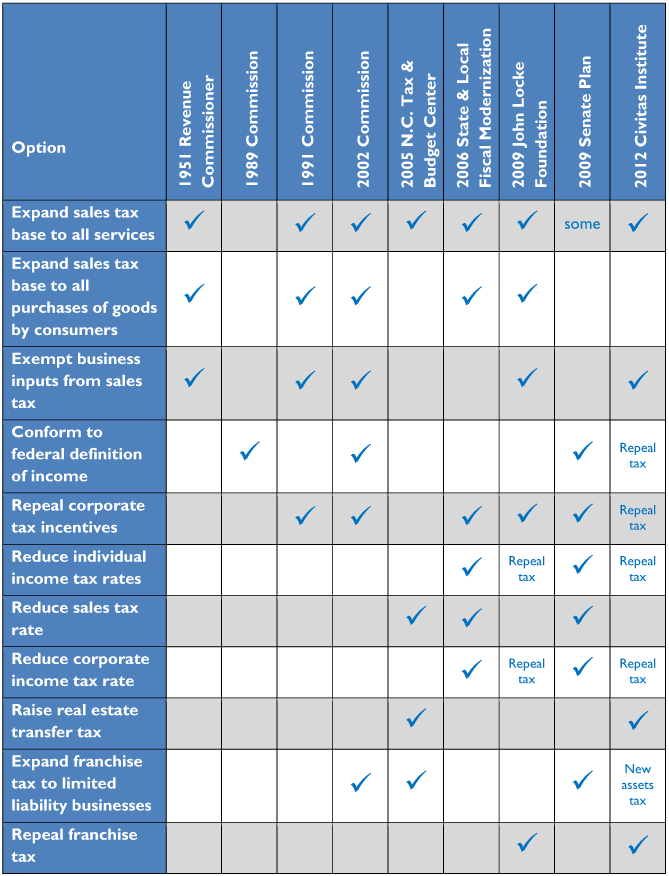
TAX REFORM OPTIONS
Option A
Option A would make North Carolina among the most pro-growth tax systems in the country:
- 6% simplified income tax (competitive with North Carolina’s neighbors), based on adjusted gross income and a $5,000 personal exemption
- 3.5% state sales tax (reduced from 4.75%), expanding the base to services but excluding business-to-business transactions
- Repeals the corporate income and franchise taxes, eliminating taxes that impose enormous compliance costs on in-state job creation and capital investment
- Clears aside tax barriers to investment and job creation while establishing a more transparent tax system linked to reliable revenue sources
- Retains the low-income Earned Income Tax Credit (EITC) and can include low-income tax credit to offset grocery purchases
- Raises the same amount of revenue as the existing tax system
- Distributionally similar to the existing tax system
- State tax system would rank 5th on the State Business Tax Climate Index, up from 44th
Table 37: Select State Top Income Tax Rates under Option A

Source: Tax Foundation
Table 38: Select State Sales Tax Rates under Option A

Source: Tax Foundation
Table 39: Key Elements of Option A

Option B
Option B simplifies and stabilizes North Carolina’s existing tax system, broadening bases and adopting uniform 5 percent tax rates across-the-board:
- 5% simplified income tax: A rate reduction for all North Carolinians, the tax includes a generous $10,000 exemption for each household member
- 5% state sales tax: Expanded to services but excludes business-to-business transactions
- 5% corporate income tax on the existing base, retaining present incentive programs
- Repeals the franchise tax, eliminating the tax on in-state capital investment
- Retains a mix of revenue sources, each transparently levied on a solid base
- Retains the low-income Earned Income Tax Credit (EITC) and can include low-income tax credit to offset grocery purchases
- Raises the same amount of revenue as the existing tax system
- Distributionally similar to the existing tax system
- Resembles Utah’s tax reform under Gov. Jon Huntsman
- State tax system would rank 13th on the State Business Tax Climate Index, up from 44th
Table 40: Select State Top Income Tax Rates under Option B

Source: Tax Foundation
Table 41: Select State Sales Tax Rates under Option B

Source: Tax Foundation
Table 42: Key Elements of Option B

Option C
Option C moves North Carolina to a stable, transparent, consumption-based tax system, making the state stand out as one of the few with no taxes on investment, job creation, and capital formation:
- 8.75% state sales tax: Expanded to services but excludes business-to-business transactions
- No income tax: North Carolina would join the seven existing states with no tax on wages, salaries, dividends, capital gains, or business income
- Repeals the corporate income and franchise taxes, eliminating taxes that impose enormous compliance costs on in-state job creation and capital investment
- Avoids untried or economically destructive taxes on gross receipts or business assets
- Raises same amount of revenue as the existing tax system
- Distributionally regressive compared to the existing tax system
- State tax system would rank 3rd on the State Business Tax Climate Index, up from 44th
Table 43: Select State Top Income Tax Rates under Option C

Source: Tax Foundation
Table 44: Select State Sales Tax Rates under Option C
 Source: Tax Foundation
Table 45: Key Elements of Option C

Option D
Option D sets North Carolina apart as the only state in the region with no sales tax, resembling tax systems in Delaware, Montana, and Oregon. Taxes on income would be higher but with low property taxes and no state taxes on corporate profits or business assets:
- No state sales tax: Tax-free retail sales, 365 days a year for all North Carolinians (and visitors)
- 10% income tax based on federal adjusted gross income and a $5,000 personal exemption
- Repeals the corporate income and franchise taxes, eliminating taxes that impose enormous compliance costs on in-state job creation and capital investment
- Raises same amount of revenue as the existing state tax system (would reduce local revenue)
- Distributionally more progressive compared to the existing tax system
- State tax system would rank 5th on the State Business Tax Climate Index, up from 44t
Table 46: Select State Top Income Tax Rates under Option D

Source: Tax Foundation
Table 47: Select State Sales Tax Rates under Option D

Source: Tax Foundation
Table 48: Key Elements of Option D

OTHER TAX REFORM SUGGESTIONS
Franchise Tax Repeal
See page 32.
In broad economic terms, franchise taxes (or capital stock taxes, as they are sometimes called) are destructive because they discourage investment and the accumulation of assets. Several states have recognized this harmful effect and are moving away from franchise taxes as a source of revenue. West Virginia and Pennsylvania will fully phase out their tax by 2015 and 2014, respectively, and Kansas completely repealed its tax in 2011. Only three of North Carolina’s neighbors retain the tax.
North Carolina’s current franchise tax is 0.15 percent and raises approximately $700 million per year. The tax does not apply to pass-through businesses, but those subject to it must pay it even in unprofitable years. Many tax reform proposals seek to expand the tax to all business forms, including the recent Civitas Institute’s recommendation to tax business net assets (i.e., equipment and inventory) at a 1.05 percent annual rate, seek to expand the tax to all business forms. A better approach would be to end this tax on business investment.
A more limited alternative that could be considered would be to cap liability for each legal entity, as is done in other states and as is done in North Carolina for holding companies. Other potential reforms include revisiting how intercompany debt is adjusted and linking statutory terminology to GAAP terms of art.
Net Operating Loss Carryback & Carryforward Reform
See page 29-30.
Twenty-six states and the District of Columbia (including Florida, Georgia, South Carolina, and Virginia) allow businesses to use past losses to offset current tax obligations for up to 20 years; North Carolina only allows 15 years. Fifteen states (including Georgia and Virginia) allow businesses to carry back losses against past taxes for 2 or 3 years; North Carolina does not allow any loss carrybacks.
Reduce Sales Tax Pyramiding
See page 36-39.
Business inputs should be exempt from sales tax not because businesses deserve special treatment, but because failure to do so results in “tax pyramiding,” the process whereby taxes stack on top of each other as raw goods move through the production process. Sales taxes on business inputs make up 24 percent of total state and local business taxes collected in North Carolina. Many states try to avoid these problems by engaging in the laborious task of picking products that are frequently used as business inputs and individually carving out exemptions for them in the sales tax code. This approach is a step in the right direction but does not and cannot ever comprehensively address all the items that businesses use in the production process and should therefore not pay sales taxes on.
Intangibles Tax Repeal
North Carolina is one of 12 states that still have some form of intangible property tax. These taxes historically were imposed on the value of trademarks and stocks and are distortive in that they attempt to tax an abstract, future, unrealized value. They tax stock values that may not ever be attained (stock prices are in constant flux) and tax trademark values that may also fall (as a business loses brand integrity). North Carolina has repealed most of its taxation of intangibles, except for the taxation of leasehold interests in real property.[50]
Real Estate Transfer Tax
Residential housing sales and rentals are generally not subject to sales tax but are sometimes subject to a real estate transfer tax. North Carolina has this tax at a 0.2 percent rate, raising approximately $120 million per year. A broadened sales tax should include or be accompanied by a tax on some level of housing services and transactions, and the existence of property taxes and the large numbers involved suggest that the state should proceed thoughtfully. While Delaware and Washington have real estate transfer taxes of over 2 percent, they are usually 1 percent or less.[51] All four tax plans we modeled include a 0.5 percent real estate transfer tax as a placeholder but can be substituted with some level of sales tax base expansion to housing.
Estate & Inheritance Tax Repeal
Estate and inheritance taxes are undesirable because they discourage the accumulation of capital, which hurts economic growth. They affect different businesses differently, as corporations do not pay them but family businesses are subject to them each generation. This distortion can prohibit family businesses from achieving an efficient business scale, which in turn makes them less able to compete with corporations on prices.
There are several practical considerations that make estate taxes undesirable as well. Several sources indicate that the compliance costs associated with estate planning to avoid the estate tax actually are greater than the amount the tax collects.[52] In North Carolina, the estate tax brings in just 0.2 percent of state and local revenues, all at tremendous costs to taxpayers and to economic growth. Among its neighbors, only Tennessee has the tax (see Figure 49):
Figure 49: State Inheritance & Estate Tax Rates and Exemptions, 2012

Tangible Personal Property Tax Repeal
In 2009, North Carolina collected $130 per capita in tangible personal property (TPP) taxes, thirteenth highest in the nation. TPP taxes are levied on business personal property such as office equipment and machinery, and are less preferable than taxes on real property because they distort business decisions by discouraging investment in new technology and the production processes.
Many states have recognized this undesirable outcome and have limited or eliminated their TPP taxes in recent years (see Figure 50). Between 2000 and 2009, TPP tax collections per capita have decreased by an average of 20 percent.[53] In the last decade, Ohio has completely phased out TPP taxes, Maine has exempted most newly purchased property with the goal of eventual phase-out, and Vermont has adopted local options to reduce or repeal TPP taxes. Especially for high-tech industries that have lots of expensive capital and relatively less labor, TPP tax repeal would be helpful in luring new firms to the state.[54]
Figure 50: Tangible Personal Property Tax Collections Per Capita, 2009

Reducing Total Tax Burden
North Carolina residents face the 17th highest state-local tax burden in the country, paying 9.9 percent of annual income in state and local taxes. Even with simplification and restructuring, taxes can only go so low while still funding essential and desired government services. Each of the recommended plans in this report is revenue-neutral: they raise the same amount of revenue as the current tax system. Whether North Carolina should aim to spend less or more on government services is beyond the scope of this report and beyond the expertise of the authors. Ultimately that question is up to the people of North Carolina and their legislative representatives, and we are happy to develop tax scenarios that adjust to reduced levels of state and local spending.
FALSE TAX REFORM
Gross Receipts Taxes
Gross receipts taxes (GRTs) are some of the most economically destructive taxes levied today, and economists left, right, and center are critical of their use by state and local governments.
At first glance, gross receipts taxes appear to satisfy economists’ prescription for taxes that have a broad base and low rate. Such taxes are imposed on all transactions, at a very low rate. However, the base of the tax is often broader than the entire economy, resulting in high effective tax rates that vary dramatically between industries. States with gross receipts taxes include Delaware (Merchants’ License Tax), Ohio (Commercial Activities Tax), Texas (Margin tax), Virginia (Business/Professional/Occupational License Tax), and Washington (Business & Occupation tax). Kentucky enacted a gross receipts tax in 2005 but repealed it within a year.[55]
The chief economic problem inherent with gross receipts taxes is the pyramiding nature of the tax.[56] That is, since the tax applies each time a business sells its goods or services, the tax “pyramids” on products as they move through the production process. The longer the production chain, the higher the effective tax rate on the final product. This produces major distortions in economic decision-making, with notably negative impacts on low-margin, high-volume businesses. Industries with more production stages end up paying the tax several times along the production process, resulting in high effective rates for those products. These costs are forwarded invisibly to the consumer.
This results in both economic and public policy problems. In the economy, this pyramiding effect subsidizes industries with short production processes at the expense of industries with more production stages. Some industries respond by vertically integrating the production process to avoid taxes, even if it is not otherwise economically efficient to do so. For these reasons and more, noted tax expert John Mikesell found in 2007 that GRTs “do not belong in any program for tax reform.”[57]
States with GRTs face ceaseless pressure from lobbyists pushing for lower rates for industries with more production stages, persuasively arguing that they are facing higher real tax burdens than other industries. Different categories and different rates emerge and steadily grow, with the conversation on tax reform becoming entirely supplanted by lobbyists working for preferential rates.
For example, the Washington State Business & Occupation (B&O) tax is the oldest gross receipts tax in the United States. First enacted in the 1930s, Washington has repeatedly amended it, resulting in an ever-changing blizzard of different rates and bases. Every business is assigned a B&O tax classification with different rates, exemptions and credits (See Table 51).
Table 51: Selected Washington B&O Gross Receipts Tax Rates

Source: Commerce Clearing House summary of Washington revenue code.
Delaware faces similar complexity with its Merchants’ License Tax (see Table 52).
Table 52: Selected Delaware MLT Gross Receipts Tax Rates

Source: Commerce Clearing House summary of Delaware revenue code.
Virginia has a varied structure with its BPOL tax, varying by county. Table 53 shows representative examples of Virginia jurisdictions near Washington, D.C.
Table 53: Selected Virginia BPOL Gross Receipts Tax Rates

Source: City of Alexandria, Virginia.
In 2011, after struggling with GRTs for over a decade, Michigan policymakers finally repealed and replaced the Michigan Business Tax, a move which catapulted the state from 49th to 7th in the State Business Tax Climate Index corporate tax component. The Michigan repeal brings the number of states with GRTs to just four: Delaware, Ohio, Texas and Washington.[58] Texas has had a poor experience with its GRT and is actively looking to restructure or even repeal it (see next section).
Despite the economic inefficiencies that these taxes create, lawmakers sometimes include them as a component in tax reform schemes because they have deceptively low rates but bring in substantial sums of revenue. This is of course an affront to transparency and is part and parcel of why GRTs are not desirable. Policymakers and businesses should be wary of the economic consequences of these tax gimmicks.
The Failing Texas Margin Tax Experiment
In 2006, Texas faced a court mandate to boost education spending from a source other than local property taxes.[59]Taking the opportunity to replace the corporate income tax (known in Texas as the franchise tax) with a tax that reached pass-through entities such as limited-liability corporations and partnerships, the state enacted a tax on business “margin,” a modified gross receipts tax and corporate income tax defined with some complexity as follows:
- Business taxpayers can choose one of three options for a tax base:
- Total revenue minus cost of goods sold; or
- Total revenue minus wages (limited to $300,000 per person) and benefits; or
- 70% of total revenue.
- “Cost of goods sold” is specially defined by statute: excludes services, selling costs, distribution costs, advertising, taxes, and compensation
- Tax is 1%, with a special rate of 0.5% for retailers and wholesalers. (The unequal rate, intended to reduce the negative effects of tax pyramiding, has led to court challenges.)
- Initially, the state had a discounted tax schedule for certain businesses:
- Total revenue of less than $300,000: no tax liability.
- Revenue between $300,000 and $400,000: pay 20% of tax liability.
- Revenue between $400,000 and $500,000: pay 40% of tax liability.
- Revenue between $500,000 and $700,000: pay 60% of tax liability.
- Revenue between $700,000 and $900,000: pay 80% of tax liability.
- After an initial outcry from small businesses, all businesses with revenue of less than $1 million are exempt from the tax. Beginning in 2012, the exemption falls to $600,000, but extension of the existing exemption is likely.
- Taxable entities with less than $10 million can instead elect to pay 0.575% of total revenue multiplied by Texas’s apportionment factors.
- No tax liability if tax due is less than $1,000.
- Tax owed on the Texas apportioned share of combined reported profits from all related business entities.
While it was enacted in 2006, officials proceeded cautiously with the untried tax. Large businesses were required to file informational returns as if they were paying the tax; the tax took effect in full beginning in 2008. Texas officials projected the tax would raise $5.9 billion per year (with some suggesting as much as $12 billion per year), but the 2006 informational returns suggested it would raise barely $5 billion.[60]In 2008, the tax raised just $4.45 billion, and collections fell under $4 billion in 2009.[61]The eliminated corporate income tax raised $2.5 billion per year.[62]
Far from solving the problems of the previous corporate franchise tax, the margin tax seems to have only aggravated them. The tax was designed to reach businesses not reached by the corporate income tax, including partnerships, unprofitable businesses, and small businesses. As the tax was enacted, however, legislators expanded exclusions in the face of arguments that hefty tax compliance costs on small businesses were disproportionate.[63]Calls for additional exclusions, such as on unprofitable businesses, continue, and the state may well end up with something resembling its old corporate franchise tax but with added complexity. At the same time, over 18,000 taxpayers that had paid the franchise tax reported no liability under the new tax.[64]In 2009, the Texas House Ways and Means CommitteeThe Committee on Ways and Means, more commonly referred to as the House Ways and Means Committee, is one of 29 U.S. House of Representative committees and is the chief tax-writing committee in the U.S. The House Ways and Means Committee has jurisdiction over all bills relating to taxes and other revenue generation, as well as spending programs like Social Security, Medicare, and unemployment insurance, among others. struggled with over 100 proposals to modify the tax, greatly increasing legislative workloads for a session that lasts only five months every other year.[65]These ongoing changes result in taxpayer confusion and aggravate the margin tax’s shortfall in collections.
Significant wrangling has occurred over the vague definition of “cost of goods sold.” Associate Deputy Comptroller Mike Reissig points to this as the main reason for the tax’s underperformance.[66]Texas permits numerous items as “cost of goods sold” that differ from federal tax rules, many of which were directly added when the legislation was enacted.
Other issues have included taxpayer confusion, increased compliance costs, and a lack of guidance for the peculiar definitions and rules under what is essentially a brand new type of tax. Jon Hoke, of the Texas chapter of the National Federation of Independent Business (NFIB), seeks the margin tax’s repeal because in the group’s view it is “crippling the small and mid-sized businesses without bringing in what [legislators] thought.”[67]The NFIB is also concerned that the 1 percent tax rate will rise due to the collections shortfall, a concern shared by the Texas Retail Association (whose members pay 0.5 percent).[68]Dale Craymer of the Texas Taxpayers and Research Association has said that “[f]rom a taxpayer standpoint, it isn’t as simple as it was conceived, and from an economic standpoint, it’s controversial.”[69]
Noted tax academic John Mikesell has referred to the Texas margin tax as a “badly designed business profits tax…combin[ing] all the problems of minimum income taxation in general—excess compliance and administrative cost, penalization of the unsuccessful business, undesirable incentive impacts, doubtful equity basis—with those of taxation according to gross receipts.”[70]
With the Texas margin tax collecting far less in revenue than expected, causing significant confusion and compliance costs, resulting in significant litigation and controversy over “cost of goods sold” definitions, and facing calls for substantial overhaul and even repeal, it should not be used as a model tax reform for any state.
Industry-Specific Tax Incentives
Tax changes always create some immediate winners and some immediate losers, but if done successfully, pro-growth tax reform means that all parties will benefit a great deal in the long run. However, special interests are aware of how tax changes will affect their industries and often lobby to get preferential treatment. Policymakers and taxpayers should be aware of these concerns.
In 2007, Maryland lawmakers attempted to expand their sales tax base to services, which is a step toward good tax policy, but they made a few mistakes which ended up sabotaging the deal. They tried to expand the base to services, but not any of the substantial services, just services deemed “luxuries.” Lobbyists from the real estate management, landscaping, and even tanning industries descended on Annapolis and were successful in getting their services removed from the proposed sales tax expansion. The only industry that was subject to the new expansion was the computer services industry, and even they were successful in getting themselves exempted the year after.[71]
This indicates that base expansion efforts should “go for the gusto” and aim to include all services in the base so rates can be brought down as much as possible. If other positive tax reforms (e.g., elimination of corporate taxes) are part of the package, a small sales tax increase might still be a relatively good deal for most industries.
This same lesson applies to eliminating distortive corporate tax carve outs. Ideally a corporate tax code taxes all business profits at the same rate, but many codes give away preferences to select industries. Eliminating these carve-outs can be difficult, because the businesses that use them lobby to keep them.
In Illinois in 2011, lawmakers raised corporate and individual income taxes substantially, and many businesses responded by moving to other states. However, Sears and the Chicago Mercantile Exchange (two companies very sympathetic to the region) were successful in procuring sweetheart deals (to the tune of $263 million in FY 2013 and $325 million in FY 2014) to stay in the state.
To minimize the concentrated cost of eliminating just a few corporate tax carve-outs, a wholesale approach is necessary to bring rates down to competitive levels overall. Given the relatively small amount of revenue the corporate tax produces (in North Carolina, less than 3 percent of state and local revenue), corporate tax repeal (which has numerous economic benefits, detailed above) may well be less politically difficult than corporate tax reform.
As a last effort, if removing tax carve-outs is too politically difficult, policymakers should consider moving these incentives to the spending side, where they will at least be subject to additional scrutiny and examined for what they are: subsidies.
APPENDIX A: REVENUE ESTIMATES
(billions of dollars)

Source: Tax Foundation calculations.
APPENDIX B: SALES TAX BROADENING OPTIONS


Source: Tax Foundation estimates based on Personal Consumption data (Table 2.4.5U) from the Bureau of Economic Analysis, applied to North Carolina’s share of national personal income.
*Items are excluded from sales tax due to the levy of a higher separate tax. Purchases of alcohol and tobacco are subject to separate excise taxes; utilities are subject to a separate gross receipts tax; accommodations are subject to local hotel taxes.
**The separate 3% amusements tax would be replaced by the state sales tax in each option.
***Percentage for current sales tax base excludes business-to-business transactions.
APPENDIX C: INCOME TAX LIABILITY ESTIMATES
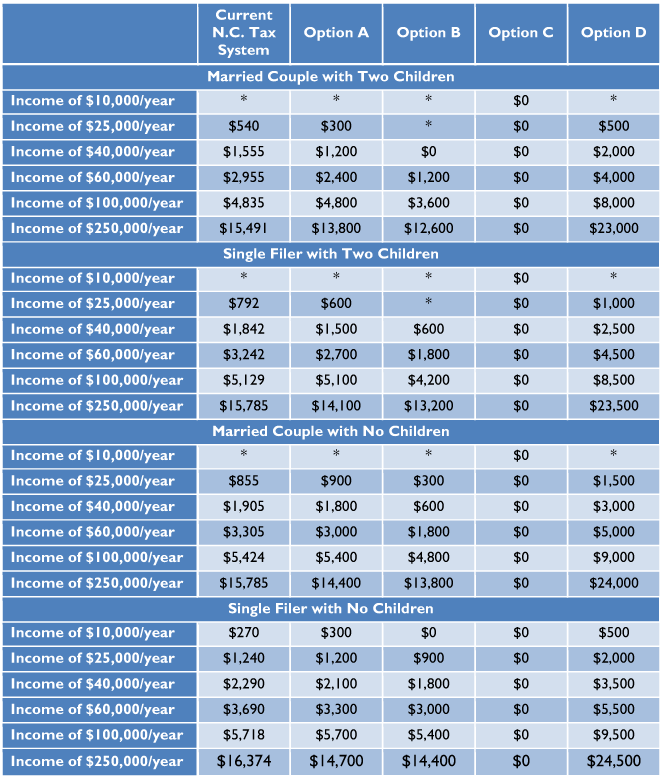
Source: Tax Foundation calculations; Internal Revenue Service; North Carolina Department of Revenue.
*Negative liability depending on EITC eligibility.
Excludes federal tax liability. Calculations do not include EITC or grocery tax credit. Estimates are static analysis that assumes no immediate dynamic income growth from tax changes. Calculation assumptions: Using averages from IRS SOI data from 2009, calculations assume that income levels up to $60,000 take the standard deduction, that the $100,000 income level takes 15 percent of income in itemized deductions, that the $250,000 income level takes 11 percent of income in itemized deductions, and that the $500,000 level takes 8 percent of income in itemized deductions.
APPENDIX D: SALES TAX LIABILITY ESTIMATES

Source: Tax Foundation calculations; Internal Revenue Service; U.S. Census Bureau.
Includes average local sales tax of 2.1 percent; excludes federal tax liability and other state and local taxes. Sales tax calculation assumptions used average estimates from national Consumer Expenditure Survey data from 2011: Households at $10,000 level spend 70 percent of income on taxable purchases at the current sales tax base and 135 percent on taxable purchases after base broadening; for households at the $25,000 level, 44 percent and 82 percent, respectively; for the $40,000 level, 33 percent and 60 percent, respectively; for the $60,000 level, 32 percent and 57 percent, respectively; for the $100,000 level, 26 percent and 44 percent, respectively; for the $250,000 level, 24 percent and 36 percent, respectively.
ACKNOWLEDGEMENTS
The Tax Foundation is grateful to the Carolina Business Coalition for commissioning this study and supporting its release. Neither the Carolina Business Coalition nor any of its members or sponsors directed the analysis or any of the recommendations made in this report.
The authors are also grateful for the research assistance of Ben Stutts and the logistical assistance of Peter Barnes and Michael Vogler in completing this project.
The authors would also like to thank the countless officials, organizations, and individuals who shared their thoughts with us on the subject of North Carolina’s tax system, as well as the people of North Carolina for their wonderful hospitality as we solicited that input.
Carolina Business Coalition
P.O. Box 19581
Raleigh, NC 27619
(919) 332-2717
www.carolina-business.org
Tax Foundation
National Press Building
529 14th Street N.W., Suite 420
Washington, DC 20045
(202) 464-6200
www.TaxFoundation.org
[1] See N.C. Gen. Stat. § 105-275(31); N.C. Gen. Stat. § 105-275(31e); Bragg Inv. Co. v. Cumberland County, 96 S.E.2d 341 (N.C. 1957) (upholding the intangibles tax on leaseholds).
[2] See National Conference of State Legislatures, Real Estate Transfer Taxes, http://www.ncsl.org/issues-research/budget/real-estate-transfer-taxes.aspx.
[3] See Scott Drenkard, Why Progressives Should Want to End the Estate Tax, Too, The Huffington Post, Sept. 13, 2012, http://www.huffingtonpost.com/scott-drenkard/estate-tax-repeal_b_1882227.html.
[4] Weighted average, based on inflation-adjusted collection data.
[5] Joyce Errecart, Ed Gerrish, & Scott Drenkard, States Moving Away from Taxes on Tangible Personal Property, Tax Foundation Background Paper No. 63 (Oct. 2012), https://taxfoundation.org/article/states-moving-away-taxes-tangible-personal-property.
[6] North Carolina Department of Commerce, North Carolina’s Community Investment Report (2011), http://www.nccommerce.com/Portals/0/Research/CIR/2011%20CIR%20Annual%20Report%20Summary.pdf.
[7] See John Hood, Let’s Focus on Job Creation, NC Spin, Dec. 20, 2012, http://www.ncspin.com/2012/12/20/lets-focus-on-job-creation.
[8] Adam Smith, An Inquiry into the Nature and Causes of the Wealth of Nations 779 (Random House 1937) (1776).
[9] See Compania General de Tabacos de Filipinas v. Collector, 275 U.S. 87, 100 (Holmes, J., dissenting) (“Taxes are what we pay for civilized society . . . .”).
[10] Smith, The Wealth of Nations at 778.
[11] Id. at 777.
[12] Id. at 778.
[13] North Carolina Governor’s Commission to Modernize State Finances, Final Report at 2 (Dec. 2002).
[14] The total dollar amount and percentage are adjusted to avoid double counting local spending financed by state aid.
[15] See Tax Foundation, Facts & Figures 2012: How Does Your State Compare? (2012) (Table 8).
[16] Elizabeth Malm & Gerald Prante, Annual State-Local Tax Burden Ranking 2010: New York Citizens Pay the Most, Alaska the Least, Tax Foundation Background Paper No. 65 (Oct. 2012), https://taxfoundation.org/article/annual-state-local-tax-burden-ranking-2010-new-york-citizens-pay-most-alaska-least.
[17] See Tax Foundation, North Carolina State-Local Tax Burden Compared to U.S. Average, 1977 to 2010, https://taxfoundation.org/article/north-carolinas-state-and-local-tax-burden-1977-2010.
[18] Scott Drenkard & Joseph Henchman, 2013 State Business Tax Climate Index, Tax Foundation Background Paper No. 64 (Oct. 2012), https://taxfoundation.org/article/2013-state-business-tax-climate-index.
[19] See North Carolina Department of Revenue, North Carolina Biennial Tax ExpenditureTax expenditures are a departure from the “normal” tax code that lower the tax burden of individuals or businesses, through an exemption, deduction, credit, or preferential rate. Expenditures can result in significant revenue losses to the government and include provisions such as the earned income tax credit (EITC), child tax credit (CTC), deduction for employer health-care contributions, and tax-advantaged savings plans. Report (Dec. 2009) (estimating corporate tax incentives in 2009 to be $295 million per year compared to $836 million in corporate tax collections), http://www.dor.state.nc.us/publications/nc_tax_expenditure_report_09.pdf.
[20] See, e.g., Robert Carroll, Corporate Taxes and Wages: Evidence from the 50 States, Tax Foundation Working Paper No. 8 (Aug. 2009), https://taxfoundation.org/article/corporate-taxes-and-wages-evidence-50-states. See also Jim Nunns, How TPC Distributes the Corporate Income Tax, Tax Policy Center Working Paper (Sep. 13, 2012) (changing TPC’s assumption from 0 percent incidence on labor to 20 percent incidence on labor, citing wide evidence of impact on labor), http://www.taxpolicycenter.org/UploadedPDF/412651-Tax-Model-Corporate-Tax-Incidence.pdf.
[21] See, e.g., David Brunori, State Tax Policy: A Political Perspective 95-110 (3rd ed. 2011).
[22] See North Carolina Department of Revenue, 2011 C-Corporation Income Tax Forms and Instructions at 6 (2011), http://www.dor.state.nc.us/downloads/cd405_instructions.pdf.
[23] North Carolina Department of Commerce, North Carolina’s Community Investment Report (2011), http://www.nccommerce.com/Portals/0/Research/CIR/2011%20CIR%20Annual%20Report%20Summary.pdf.
[24] North Carolina Department of Commerce, Small Business, http://www.nccommerce.com/smallbusiness.
[25] See John Hood, Let’s Focus on Job Creation, NC Spin, Dec. 20, 2012, http://www.ncspin.com/2012/12/20/lets-focus-on-job-creation.
[26] See Jens Arnold, Bert Brys, Christopher Heady, Åsa Johansson, Cyrille Schwellnus, & Laura Vartia, Tax Policy For Economic Recovery and Growth, 121 Economic Journal F59-F80 (2011).
[27] For a comprehensive review of 26 major academic studies evaluating the link between taxes and economic growth, see William McBride, What is the Evidence on Taxes and Growth?, Tax Foundation Special Report No. 207 (Dec. 2012), https://taxfoundation.org/article/what-evidence-taxes-and-growth.
[28] John Mullen & Martin Williams, Marginal tax rateThe marginal tax rate is the amount of additional tax paid for every additional dollar earned as income. The average tax rate is the total tax paid divided by total income earned. A 10 percent marginal tax rate means that 10 cents of every next dollar earned would be taken as tax. s and state economic growth, 24 Regional Science and Urban Economics 687-705 (1994).
[29] See, e.g., Edward C. Prescott, Why Do Americans Work So Much More than Europeans?, 28 Federal Reserve Bank of Minneapolis Quarterly Review 2-13 (2004), http://www.minneapolisfed.org/research/QR/QR2811.pdf.
[30] Id.
[31] See Scott Drenkard, State and Local Sales Taxes at Midyear 2012, Tax Foundation Fiscal Fact No. 323 (July 31, 2012), https://taxfoundation.org/article/state-and-local-sales-taxes-midyear-2012.
[32] Andrew Phillips et al., Total State and Local Business Taxes: State-by-State Estimates for Fiscal Year 2011, Ernst & Young LLP and the Council on State Taxation (July 2012) (North Carolina calculations based off Table 3 data), http://www.ey.com/Publication/vwLUAssets/Total_state_and_local_business_taxes_report/$FILE/YY2718_50_State_Tax_Cost_Report.pdf.
[33] See Scott Drenkard, The Two Hardest (But Most Important) Sales Tax Reforms, Tax Foundation Tax Policy Blog, Aug. 2, 2012, https://taxfoundation.org/blog/two-hardest-most-important-sales-tax-reforms.
[34] See N.C. Gen. Stat. § 105-498 (including building materials in the local sales tax base but excluding them from the state sales tax base).
[35] John Mikesell, The Disappearing Retail Sales Tax, 63 State Tax Notes 777, 780 (Mar. 5, 2012).
[36] See id.
[37] See North Carolina Department of Revenue, Biennial Tax Expenditure Report 78-107 (2011) (estimating foregone revenue from the sales tax exemptionA tax exemption excludes certain income, revenue, or even taxpayers from tax altogether. For example, nonprofits that fulfill certain requirements are granted tax-exempt status by the Internal Revenue Service (IRS), preventing them from having to pay income tax. on food for home consumption to be $622.1 million and from prescription drugs to be $464.7 million, based on a 4.83% average state sales tax rate), http://www.dor.state.nc.us/publications/nc_tax_expenditure_report_11.pdf.
[38] Interim Joint House and Senate Finance Committees. Overview of North Carolina Sales Tax. November 3, 2009 http://www.ncleg.net/documentsites/committees/jhsfctr/Meeting%20Documents/11-3-2009%20Meeting/Overview%20of%20NC%20Sales%20Tax.pdf
[39] Scott Drenkard, State and Local Sales Taxes at Midyear 2012, Tax Foundation Fiscal Fact No. 323 (July 31, 2012), https://taxfoundation.org/article/state-and-local-sales-taxes-midyear-2012.
[40] See, e.g., Chris Fitzsimon, A Little Tax Fairness to Fill a Budget Hole, North Carolina Policy Watch (Feb. 28, 2012), http://www.ncpolicywatch.com/2012/02/28/a-little-tax-fairness-to-fill-a-budget-hole.
[41] See Scott Drenkard, The Two Hardest (But Most Important) Sales Tax Reforms, Tax Foundation Tax Policy Blog, Aug. 2, 2012, https://taxfoundation.org/blog/maryland-covertly-singles-out-computer-services-new-tax.
[42] For one methodology (used by this paper’s authors to calculate potential sales tax revenues), see Michael Mazerov, Using Economic Census Data to Estimate the Revenue Impact of Taxing Services, Center on Budget & Policy Priorities (Feb. 2012), http://www.cbpp.org/files/2-15-12sfp.pdf.
[43] American Automobile Association, Daily Fuel Gauge Report, http://fuelgaugereport.opisnet.com/index.asp.
[44] Institute on Taxation and Economic Policy, Building a Better Gas Tax: How to Fix One of State Government’s Least Sustainable Revenue Sources (Dec. 2011), http://www.itepnet.org/bettergastax/bettergastax.pdf.
[45] Marc Scribner, Fixing Surface Transportation in Massachusetts: A Path Forward under a Devolved Federal Funding Scenario,” Competitive Enterprise Institute (Jun. 2012), http://bit.ly/XzdMHe.
[46] Adam Beam, S.C. group pushes for gas tax increase to repair state’s roads, Charlotte Observer, Dec. 27, 2012, http://www.charlotteobserver.com/2012/12/27/3748716/sc-group-pushes-for-gas-tax-increase.html.
[47] Joseph Henchman, Inflation Adjusted State Gas Taxes, Tax Foundation Tax Policy Blog, Apr. 27, 2009, https://taxfoundation.org/blog/inflation-adjusted-state-gas-taxes.
[48] Douglas J. Lindholm & Frederick J. Nicely, The Best and Worst of State Tax Administration: COST Scorecard on Tax Appeals & Procedural Requirements (Feb. 2010), http://www.cost.org/WorkArea/DownloadAsset.aspx?id=75910.
[49] See, e.g., Pew Center on the States, The Widening Gap Update (June 2012), http://bit.ly/V7GOwm (estimating North Carolina has a 96 percent pension funding ratio and a 3 percent retiree health funding ratio); Andrew Biggs, Public Sector Pensions: How Well Funded Are They, Really? (July 2012), http://bit.ly/V7H2Dw (estimating North Carolina has a 99 percent pension funding ratio).
[50] See N.C. Gen. Stat. § 105-275(31); N.C. Gen. Stat. § 105-275(31e); Bragg Inv. Co. v. Cumberland County, 96 S.E.2d 341 (N.C. 1957) (upholding the intangibles tax on leaseholds).
[51] See National Conference of State Legislatures, Real Estate Transfer Taxes, http://www.ncsl.org/issues-research/budget/real-estate-transfer-taxes.aspx.
[52] See Scott Drenkard, Why Progressives Should Want to End the Estate Tax, Too, The Huffington Post, Sept. 13, 2012, http://www.huffingtonpost.com/scott-drenkard/estate-tax-repeal_b_1882227.html.
[53] Weighted average, based on inflation-adjusted collection data.
[54] Joyce Errecart, Ed Gerrish, & Scott Drenkard, States Moving Away from Taxes on Tangible Personal Property, Tax Foundation Background Paper No. 63 (Oct. 2012), https://taxfoundation.org/article/states-moving-away-taxes-tangible-personal-property.
[55] Adam Smith theorized that a gross receipts tax helped destroy Spain’s economy and end its reign as a global power: “The famous alcavala of Spain… was at first a tax of ten per cent., afterwards of fourteen per cent., … upon the sale of every sort of property whether movable or immovable, and it is repeated every time the property is sold. The levying of this tax requires a multitude of revenue officers sufficient to guard the transportation of goods, not only from one province to another, but from one shop to another. It subjects not only the dealers in some sorts of goods, but those in all sorts, every farmer, every manufacturer, every merchant and shopkeeper, to the continual visits and examination of the taxgatherers. Through the greater part of a country in which a tax of its kind is established nothing can be produced for distant sale…. It is to the alcavala, accordingly, that Ustaritz imputes the ruin of the manufactures of Spain. He might have imputed to it likewise the declension of agriculture, it being imposed not only upon manufactures, but upon the rude produce of the land.” Smith, Wealth of Nations, supra, Book V, Chapter II.
[56] SeeAndrew Chamberlain & Patrick Fleenor, Tax Pyramiding: The Economic Consequences of Gross Receipts Taxes,Tax Foundation Special Report No. 147(Dec. 2006), https://taxfoundation.org/article/tax-pyramiding-economic-consequences-gross-receipts-taxes.
[57] John L. Mikesell, Gross Receipts Taxes in State Government Finances: A Review of Their History and Performance, Tax Foundation Background Paper No. 53 (Jan. 2007), http://bit.ly/Uf0ixZ.
[58] Additionally, Virginia’s Business, Occupational and Professional Licensing tax is levied locally in some areas of the state.
[59] SeeChris Atkins, Appropriation by Litigation: Estimating the Cost of Judicial Mandates for State and Local Education Spending,Tax Foundation Background Paper No. 55(July 2007), https://taxfoundation.org/article/appropriation-litigation-estimating-cost-judicial-mandates-state-and-local-education-spending.
[60] SeeBilly Hamilton, The Texas Margin Tax Falls Short of Projections,State Tax Notes(Dec. 22, 2008).
[61] Billy Hamilton, The Tax That Fell to Earth: Lessons From the Texas Margin Tax’s Launch, State Tax Notes(Sep. 6, 2010), at 671 [hereinafter Hamilton, The Tax That Fell].
[62] SeeDavid Bowser, New tax for businesses called ‘taxpayer’s nightmare’,Pampa News(Oct. 17, 2006).
[63] Billy Hamilton, Cosmetic Surgery for the Texas Margin Tax,State Tax Notes(Apr. 27, 2009), at 327 [hereinafter Hamilton, Cosmetic Surgery].
[64] SeeHamilton, The Tax That Fell, supra note 41.
[65] Hamilton, Cosmetic Surgery, supra note 43, at 327.
[66] Hamilton, The Tax That Fell, at 673.
[67] Paul Wiseman, NFIB Calls Texas’ Business Margin Tax a ‘Lose-Lose’ Situation,Midland Reporter-Telegram(Apr. 6, 2011).
[68] Samantha Stone, Word From Texas: Margin Tax is a Work in Progress, Not Meeting Projections, Likely Headed for Major Reform, Nevada News Channel (May 6, 2011).
[69] Id.
[70] John L. Mikesell, Gross Receipts Taxes in State Government Finances: A Review of Their History and Performance,Tax Foundation & Council on State Taxation Background Paper No. 53 (Jan. 2007), at 4 n.6,https://taxfoundation.org/article/gross-receipts-taxes-state-government-finances-review-their-history-and-performance.
[71] See Joseph Henchman, Maryland Covertly Singles Out Computer Services For New Tax, Tax Foundation Tax Policy Blog (Dec. 17, 2007), https://taxfoundation.org/blog/md-computer-services-tax-repealed-ga-tax-plans-die.
Share