Executive Summary
Increases in federal, state, and local fees drove the national average wireless taxA tax is a mandatory payment or charge collected by local, state, and national governments from individuals or businesses to cover the costs of general government services, goods, and activities. and fee burden to its highest level ever – nearly 18 percent of the average U.S. wireless customer’s bill. This is an increase of nearly one percentage point over 2014 levels and is almost two and one half times higher than the general sales tax rate imposed on most other taxable goods and services.
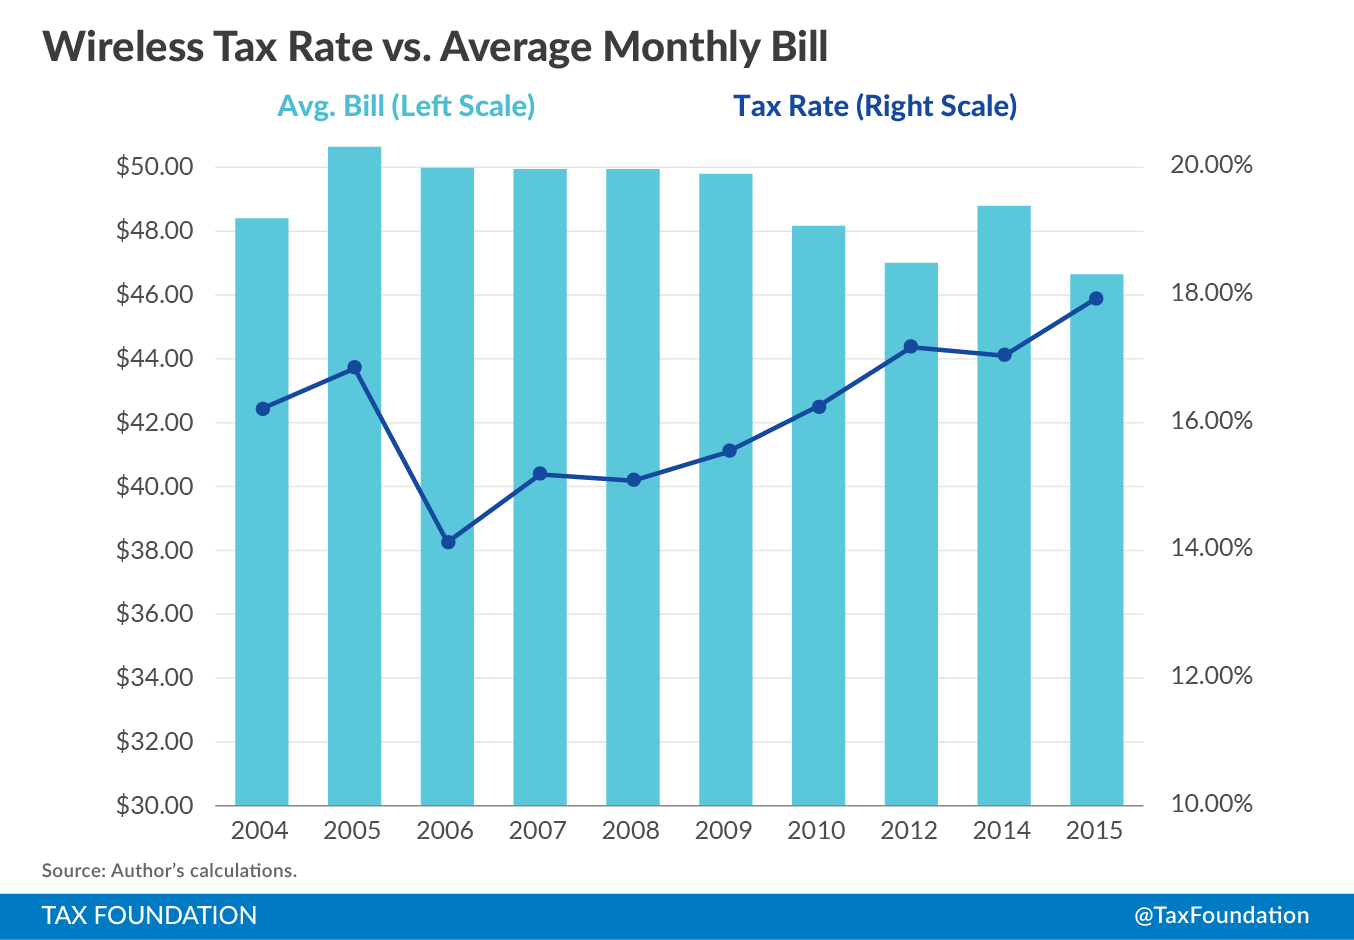
Wireless industry competition has led to significant reductions in average monthly bills even as consumers get new and expanded wireless plans. However, the consumer benefits of lower wireless prices have been partially offset by increases in government taxes and fees. The average monthly wireless bill dropped from just under $49.94 in 2008 to $46.64 in 2015, a price decrease of nearly 7 percent. At the same time, the tax rate increased from 15.5 percent to nearly 18 percent.
Consumers in Washington State pay over 25 percent of their bills in taxes and fees, while consumers in eight other states – Nebraska, New York, Illinois, Missouri, Rhode Island, Florida, Arkansas, and Pennsylvania – pay total taxes and fees in excess of 20 percent of their bills. Consumers in Oregon and Nevada continue to enjoy the lowest wireless taxes in the country.
Wireless consumers pay about $5.8 billion annually in excessive state and local taxes and fees, defined as taxes and fees in excess of the normal state and local sales taxes imposed on the purchase of other goods and services. In addition, wireless consumers pay about $5 billion in Federal Universal Service Fund surcharges.
Florida was the only state to buck the trend toward higher wireless taxes between 2014 and 2015. The governor and the legislature reduced the state Communications Services Tax from 9.17 percent to 7.44 percent, which will provide over $100 million in tax relief for Florida wireless consumers and businesses. This tax cut, along with a reduction in the 911 fee, drops Florida out of the “top five” states with the highest wireless taxes.
Wireless service is increasingly the sole means of communication and connectivity for many Americans, particularly those struggling to overcome poverty. At the end of 2014, according to surveys by the Centers for Disease Control, over 59 percent of all poor adults had only wireless service, and over 44 percent of all adults were wireless only. Excessive taxes and fees, especially the regressive per line taxes like those imposed in Chicago and Baltimore, impose a disproportionate burden on low-income consumers.
Congress is currently considering legislation to extend the federal moratorium on state and local taxes on internet access. The taxes described in this report are, for the most part, imposed on wireless voice and other taxable services, not wireless internet access. Should the moratorium not be extended by Congress, the excessive wireless taxes discussed in this report could be imposed on wireless internet access. This could add significantly to the growing tax burden on consumers, who increasingly rely on wireless devices to access the internet.
Wireless Tax and Fee Burdens Increase to a Record 18 Percent
This is the sixth in a series of reports that examines trends in the taxes, fees, and surcharges imposed by federal, state, and local governments on wireless services. These reports – published in 2004, 2008, 2011, 2012, and 2014[2] – use the methodology developed in 1999 by the Committee on State Taxation, now the Council on State Taxation (COST). Recognizing that it would be nearly impossible to aggregate tax rates from the over 10,000 taxing jurisdictions across the country, the COST study used an average of the most populated city and the capital city in each state as a proxy to compare tax rates across the states. This methodology allows for time series comparisons of trends in wireless taxation.
Figure 1 shows national trends in state and local average tax rates on wireless service between 2003 and 2015. Between 2005 and 2006, wireless tax burdens dropped after a series of federal court decisions forced the IRS to end the imposition of the 3 percent federal excise tax on wireless service. Since then, rates climbed steadily until hitting a record in 2015.
Figure 1.
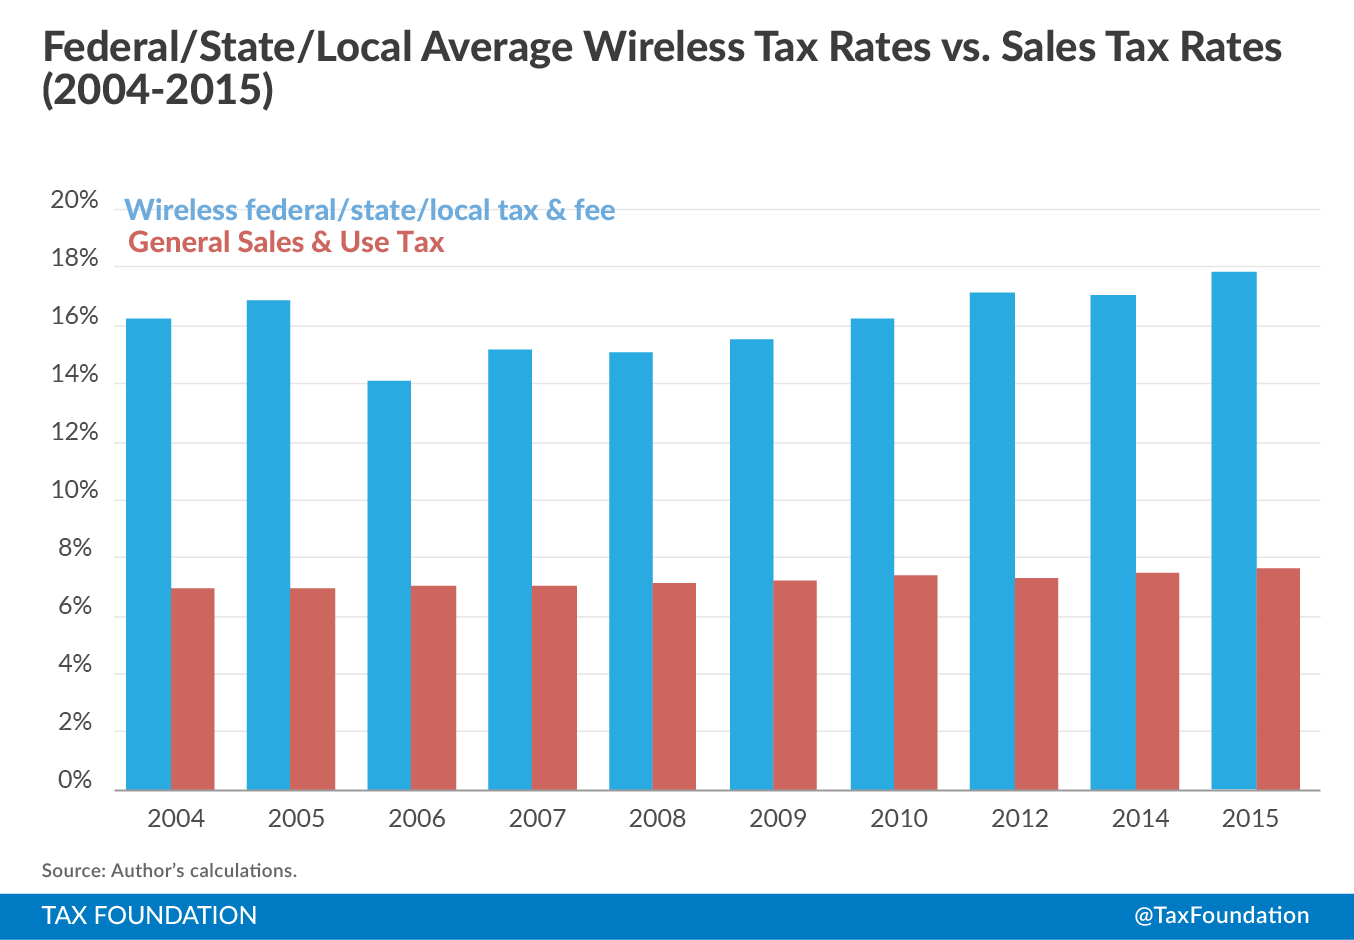
Table 1 shows the detail behind the trends highlighted in Figure 1, including state-local average rates as well as federal impositions. Between 2003 and 2015, state and local taxes, fees, and surcharges on wireless service increased by 1.3 percentage points – from 10.20 percent to 11.50 percent – while average state and local sales taxA sales tax is levied on retail sales of goods and services and, ideally, should apply to all final consumption with few exemptions. Many governments exempt goods like groceries; base broadening, such as including groceries, could keep rates lower. A sales tax should exempt business-to-business transactions which, when taxed, cause tax pyramiding. rates increased by seven-tenths of a percentage point – from 6.87 percent to 7.57 percent. Federal taxes and Universal Service Fund (USF) charges increased from 5.07 percent to 6.46 percent.
Table 1.
| US Average Wireless and General Sales & Use Tax Rates | |||||||||||
| 1/1/2003 | 4/1/2004 | 7/1/2005 | 7/1/2006 | 7/1/2007 | 7/1/2008 | 7/1/2009 | 7/1/2010 | 7/1/2012 | 7/1/2014 | 7/1/2015 | |
| Weighted Average | |||||||||||
| Wireless -state & local tax & fee | 10.20% | 10.74% | 10.94% | 11.14% | 11.00% | 10.86% | 10.74% | 11.21% | 11.36% | 11.23% | 11.50% |
| Wireless – federal tax & fee | 5.07% | 5.48% | 5.91% | 2.99% | 4.19% | 4.23% | 4.79% | 5.05% | 5.82% | 5.82% | 6.46% |
| Wireless federal/state/local tax & fee | 15.27% | 16.22% | 16.85% | 14.13% | 15.19% | 15.09% | 15.53% | 16.26% | 17.18% | 17.05% | 17.96% |
| General Sales/Use Tax | 6.87% | 6.93% | 6.94% | 7.04% | 7.07% | 7.11% | 7.26% | 7.42% | 7.33% | 7.51% | 7.57% |
| Disparity — Wireless Tax Over General Sales Tax | 3.33% | 3.81% | 4.00% | 4.09% | 3.93% | 3.75% | 3.48% | 3.79% | 4.03% | 3.72% | 3.94% |
| Source: Methodology derived from Committee on State Taxation, “50-State Study and Report on Telecommunications Taxation,” May 2005. Updated July 2015 from state statutes, FCC data, and local ordinances by Scott Mackey, KSE Partners LLP, Montpelier, VT. | |||||||||||
| Federal includes 3% federal excise tax (until 5/2006) and federal universal service fund charge, which is set by the FCC and varies quarterly: | |||||||||||
| Federal USF 1/1/2003 — 28.5% FCC “hold harmless” times 7.3% FCC contribution factor = 2.07% | |||||||||||
| Federal USF 4/1/2004 — 28.5% x 8.7% = 2.48% | |||||||||||
| Federal USF 7/1/2005 — 28.5% x 10.2% = 2.91% | |||||||||||
| Federal USF 7/1/2006 — 28.5% x 10.5% = 2.99% | |||||||||||
| Federal USF 7/1/2007 — 37.1% x 11.3% = 4.19% | |||||||||||
| Federal USF 7/1/2008 — 37.1% x 11.4% = 4.23% | |||||||||||
| Federal USF 7/1/2009 — 37.1% x 12.9% = 4.79% | |||||||||||
| Federal USF 7/1/2010 — 37.1% x 13.6% = 5.05% | |||||||||||
| Federal USF 7/1/2012 — 37.1% x 15.7% = 5.82% | |||||||||||
| Federal USF 7/1/2014 — 37.1% x 15.7% = 5.82% | |||||||||||
| Federal USF 7/1/2015 — 37.1% x 17.4% = 6.46% | |||||||||||
| https://apps.fcc.gov/edocs_public/attachmatch/DA-14-812A1.pdf |
Wireless industry competition has led to significant reductions in average monthly bills, but the consumer benefits of lower wireless prices have been partially offset by increases in government taxes and fees. Figure 2 shows the relationship between average monthly bills and average wireless tax rates. The average monthly wireless bill dropped from just under $49.94 in 2008 to $46.64 in 2015, a price decrease of nearly seven percent. At the same time, the tax rate increased from 15.5 percent to nearly 18 percent.
Figure 2.
The combined federal, state, and local burden on wireless consumers increased from 15.27 percent to 17.96 percent, or nearly 3 percentage points. Over the last decade, tax burdens on wireless consumers grew more than four times faster than general sales taxes on other taxable goods and services.
The causes of the growth in the wireless tax burden are markedly different depending upon the time period considered. State and local impositions grew rapidly between 2003 and 2006, leveled off between 2007 and 2009, and increased again from 2010 to 2015. On the other hand, federal impositions dropped dramatically in 2006 when the Internal Revenue Service concluded that the 3 percent federal excise taxAn excise tax is a tax imposed on a specific good or activity. Excise taxes are commonly levied on cigarettes, alcoholic beverages, soda, gasoline, insurance premiums, amusement activities, and betting, and typically make up a relatively small and volatile portion of state and local and, to a lesser extent, federal tax collections. no longer applied to wireless service. However, the elimination of the Federal excise tax was offset by a rapid increase in the Federal USF, and the Federal USF rate more than doubled from 2.99 percent to its current level of 6.46 percent.
The Federal USF is administered by the Federal Communications Commission (FCC) with open-ended authority from Congress. The program subsidizes telecommunications services for schools, libraries, hospitals, and rural telephone companies operating in high cost areas. The Federal USF is assessed on a provider’s Interstate revenues, which the FCC deems to be 37.1 percent of the wireless bill for customers purchasing calling plans that do not distinguish between interstate and intrastate calls[3]. The notes at the bottom of Table 1 show the significant growth in the Federal USF contribution rate from 7.3 percent in 2003 to 17.4 percent in 2015.
Washington State Wireless Consumers Face a Combined Tax Bill of over 25 Percent, with over Half the States above 10 Percent
Table 2 provides a snapshot of wireless tax, fee, and surcharge burdens by state as of July 2015. Column 1 shows the state and local tax burden in each state, while column 3 shows the total tax, fee, and surcharge burden including the Federal USF surcharge. The state of Washington has now edged out Nebraska as the state with the highest average wireless consumer burden in the country, with a combined rate of 25.15 percent. Nebraska is not far behind with a combined burden of 24.99 percent.
Table 2.
| Taxes, Fees, and Government Charges on Wireless Service, July 2015 | ||||
| 2015 Wireless State-Local Rate | 2015 Federal USF Rate | 2015 Combined Federal/State/Local Rate | ||
| 1 | Washington | 18.69% | 6.46% | 25.15% |
| 2 | Nebraska | 18.53% | 6.46% | 24.99% |
| 3 | New York | 17.90% | 6.46% | 24.36% |
| 4 | Illinois | 17.46% | 6.46% | 23.92% |
| 5 | Missouri | 14.79% | 6.46% | 21.25% |
| 6 | Rhode Island | 14.70% | 6.46% | 21.16% |
| 7 | Florida | 14.66% | 6.46% | 21.12% |
| 8 | Arkansas | 14.31% | 6.46% | 20.77% |
| 9 | Pennsylvania | 14.14% | 6.46% | 20.60% |
| 10 | Kansas | 13.53% | 6.46% | 19.99% |
| 11 | Puerto Rico | 13.45% | 6.46% | 19.91% |
| 12 | South Dakota | 13.14% | 6.46% | 19.60% |
| 13 | Utah | 12.77% | 6.46% | 19.23% |
| 14 | Alaska | 12.69% | 6.46% | 19.15% |
| 15 | Maryland | 12.67% | 6.46% | 19.13% |
| 16 | North Dakota | 12.27% | 6.46% | 18.73% |
| 17 | Tennessee | 11.99% | 6.46% | 18.45% |
| 18 | Arizona | 11.98% | 6.46% | 18.44% |
| 19 | DC | 11.63% | 6.46% | 18.09% |
| 20 | California | 11.60% | 6.46% | 18.06% |
| 21 | Texas | 11.53% | 6.46% | 17.99% |
| 22 | New Mexico | 11.22% | 6.46% | 17.68% |
| 23 | Indiana | 11.06% | 6.46% | 17.52% |
| 24 | Oklahoma | 10.88% | 6.46% | 17.34% |
| 25 | Colorado | 10.78% | 6.46% | 17.24% |
| 26 | South Carolina | 10.58% | 6.46% | 17.04% |
| 27 | Kentucky | 10.56% | 6.46% | 17.02% |
| 28 | Alabama | 9.75% | 6.46% | 16.21% |
| 29 | Minnesota | 9.54% | 6.46% | 16.00% |
| 30 | Georgia | 9.22% | 6.46% | 15.68% |
| 31 | Mississippi | 9.14% | 6.46% | 15.60% |
| 32 | Massachusetts | 8.93% | 6.46% | 15.39% |
| 33 | New Jersey | 8.93% | 6.46% | 15.39% |
| 34 | Iowa | 8.71% | 6.46% | 15.17% |
| 35 | North Carolina | 8.59% | 6.46% | 15.05% |
| 36 | Vermont | 8.50% | 6.46% | 14.96% |
| 37 | Ohio | 8.42% | 6.46% | 14.88% |
| 37 | Michigan | 8.28% | 6.46% | 14.74% |
| 39 | New Hampshire | 8.22% | 6.46% | 14.68% |
| 40 | Wyoming | 7.95% | 6.46% | 14.41% |
| 41 | Hawaii | 7.61% | 6.46% | 14.07% |
| 42 | Connecticut | 7.44% | 6.46% | 13.90% |
| 43 | Maine | 7.35% | 6.46% | 13.81% |
| 44 | Louisiana | 7.29% | 6.46% | 13.75% |
| 45 | Wisconsin | 7.17% | 6.46% | 13.63% |
| 46 | Virginia | 6.61% | 6.46% | 13.07% |
| 47 | West Virginia | 6.43% | 6.46% | 12.89% |
| 48 | Delaware | 6.29% | 6.46% | 12.75% |
| 49 | Montana | 6.11% | 6.46% | 12.57% |
| 50 | Idaho | 2.17% | 6.46% | 8.63% |
| 51 | Nevada | 1.95% | 6.46% | 8.41% |
| 52 | Oregon | 1.80% | 6.46% | 8.26% |
| Weighted Avg. | 11.50% | 6.46% | 17.96% | |
| Simple Avg. | 10.42% | 6.46% | 16.88% | |
| Source: Methodology from COST, “50-State Study and Report on Telecommunications Taxation,” May 2005. Updated July 2015 using state statutes, FCC data, and local ordinances. |
Figure 2 shows the states by average state and local rates, without including federal impositions. Consumers in four states pay rates in excess of 15 percent, and in another 21 states plus the District of Columbia and Puerto Rico the rate is between 10 percent and 15 percent. Of the remaining 24 states with rates below 10 percent, only three – Idaho, Nevada, and Oregon – have rates below 5 percent. Oregon consumers face the lowest combined state and local rates in the country, at just 1.8 percent.
Figure 3.
One of the longstanding arguments for reform of wireless taxation is the disparity in the tax burdens on wireless services as compared to the tax burdens on other goods and services subject to state sales and use taxes. Table 3 ranks the states by measuring the disparity in state and local tax rates between the wireless tax rate and the general sales and use rate. Nebraska and Alaska are the only states that have a disparity of greater than 10 percentage points between the wireless rate and the general sales tax rate. Other states with large disparities include Washington, New York, and Illinois. New Hampshire ranks sixth in the disparity between wireless taxes and sales taxes despite having a relatively low rate on wireless service because the state does not have a sales tax but imposes a 7 percent communications tax and a $0.57 monthly 911 fee on wireless service. Two other states that impose taxes on wireless but do not have sales taxes – Delaware and Montana – also rank relatively highly on this disparity scale despite their comparatively low rates on wireless consumers.
Four states have lower state and local rates on wireless service than the general sales tax rate. These states are West Virginia, Louisiana, Idaho, and Nevada.
Wireless consumers pay about $5.8 billion annually in excessive state and local taxes and fees, defined as taxes and fees in excess of the normal state and local sales taxes imposed on the purchase of other goods and services. In addition, wireless consumers pay about $5 billion in Federal Universal Service Fund surcharges[4].
Table 3.
| Disparity Between Wireless Tax & Fee Rate and General Sales Tax Rate, July 2015 | |||
| Sales Tax | Wireless Tax | Wireless Over/Under Sales Tax | |
| Nebraska | 7.00% | 18.53% | 11.53% |
| Alaska | 2.50% | 12.69% | 10.19% |
| Washington | 9.15% | 18.69% | 9.54% |
| New York | 8.44% | 17.90% | 9.46% |
| Illinois | 8.88% | 17.46% | 8.59% |
| New Hampshire | 0.00% | 8.22% | 8.22% |
| Rhode Island | 7.00% | 14.70% | 7.70% |
| Florida | 7.25% | 14.66% | 7.41% |
| Pennsylvania | 7.00% | 14.14% | 7.14% |
| South Dakota | 6.00% | 13.14% | 7.14% |
| Maryland | 6.00% | 12.67% | 6.67% |
| Missouri | 8.29% | 14.79% | 6.50% |
| Delaware | 0.00% | 6.29% | 6.29% |
| Montana | 0.00% | 6.11% | 6.11% |
| Utah | 6.80% | 12.77% | 5.97% |
| DC | 5.75% | 11.63% | 5.88% |
| North Dakota | 7.00% | 12.27% | 5.27% |
| Kansas | 8.33% | 13.53% | 5.20% |
| Arkansas | 9.38% | 14.31% | 4.94% |
| Kentucky | 6.00% | 10.56% | 4.56% |
| Indiana | 7.00% | 11.06% | 4.06% |
| Arizona | 8.20% | 11.98% | 3.78% |
| New Mexico | 7.75% | 11.22% | 3.47% |
| Texas | 8.25% | 11.53% | 3.28% |
| Colorado | 7.64% | 10.78% | 3.14% |
| California | 8.75% | 11.60% | 2.85% |
| Tennessee | 9.25% | 11.99% | 2.74% |
| Massachusetts | 6.25% | 8.93% | 2.68% |
| Wyoming | 5.50% | 7.95% | 2.45% |
| Oklahoma | 8.45% | 10.88% | 2.43% |
| Hawaii | 4.00% | 6.38% | 2.38% |
| South Carolina | 8.25% | 10.58% | 2.33% |
| Michigan | 6.00% | 8.28% | 2.28% |
| Iowa | 6.50% | 8.71% | 2.21% |
| Vermont | 6.50% | 8.50% | 2.00% |
| Puerto Rico | 11.50% | 13.45% | 1.95% |
| New Jersey | 7.00% | 8.93% | 1.93% |
| Maine | 5.50% | 7.35% | 1.85% |
| Minnesota | 7.70% | 9.54% | 1.84% |
| Oregon | 0.00% | 1.80% | 1.80% |
| Mississippi | 7.50% | 9.14% | 1.64% |
| Wisconsin | 5.55% | 7.18% | 1.63% |
| North Carolina | 7.00% | 8.59% | 1.59% |
| Georgia | 8.00% | 9.22% | 1.22% |
| Connecticut | 6.35% | 7.44% | 1.09% |
| Virginia | 5.65% | 6.61% | 0.96% |
| Ohio | 7.75% | 8.42% | 0.67% |
| Alabama | 9.50% | 9.75% | 0.25% |
| West Virginia | 7.00% | 6.43% | -0.57% |
| Louisiana | 9.00% | 7.29% | -1.71% |
| Idaho | 6.00% | 2.17% | -3.83% |
| Nevada | 7.85% | 1.95% | -5.90% |
| US Weighted Average | 7.57% | 11.50% | 3.72% |
| Source: Methodology from COST, “50-State Study and Report on Telecommunications Taxation,” May 2005. Updated July 2015 using state statutes, FCC data, and local ordinances. |
Appendix A provides a detailed breakdown of the types of taxes, fees, and surcharges imposed in each state and their relative rates. To facilitate interstate comparisons, local rates imposed in the most populated city and the capital city of each state are averaged into a single local rate. In states or localities where taxes, fees, or surcharges are imposed on a flat per-line basis – for example, $1.00 per month per line – the imposition is converted into a percentage by dividing the flat amount by the industry’s average revenue per line of $46.64 per month.
Trends in Wireless Taxes and Fees
911 Fees
Most states impose 911 fees to fund capital expenses for the 911 system, and in some cases the fees fund 911 operations as well. Wireless 911 fees vary greatly by state, from a low of zero in Missouri to a high of $3.00 per line per month in West Virginia.
Seven states increased 911 fees between 2014 and 2015. The largest increase was in the City of Chicago, which hiked the fee from $2.50 per line per month to $3.90 per line per month in October 2014. Massachusetts increased the fee from $0.75 to $1.25 per month per line. Alabama, Indiana, Michigan, North Dakota, and Tennessee also enacted modest increases. (Pennsylvania enacted a large fee increase, from $1.00 per month to $1.65 per month, but the rate increase is not reflected in this report because it took effect on August 1, 2015.)
Two states reduced 911 fees in the last year. The Connecticut fee was reduced from $0.70 to $0.51 per line per month. Legislation passed in Florida in 2014 lowered the fee from $0.50 per month to $0.40 per month beginning on January 1, 2015.
State Universal Service Funds
Some states have their own Universal Service Funds (USF) that provide subsidies for many of the same purposes as the Federal USF. State USF surcharges are imposed on revenues from intrastate telecommunications services, while the Federal USF applies to revenues from interstate services. In states like Alaska, Kansas, and Nebraska, state USF surcharge rates add significantly to the overall burden on wireless consumers.
Most state laws allow regulators to increase or decrease USF rates based on program needs and market factors. Eight states increased the rates of their state USFs between 2014 and 2015. Alaska increased its USF rate, which was already the highest in the country, from 9.2 percent to 10.4 percent of intrastate charges. Other states increasing their USF rates were Arkansas, California, Indiana, Kansas, Michigan, Minnesota, and Oklahoma. Texas was the only state that reduced the state USF rate.
State Level Wireless Taxes
In addition to 911 fees and state USF charges, a total of 13 states impose taxes on wireless service at the state level are either in addition to sales taxes or in lieu of sales taxes but at a higher rate than the state sales tax. Table 4 below shows these states.
Table 4.
| State Wireless Taxes by Type | ||
| State Gross Receipts Tax in Addition to Sales Tax | Higher State Tax Rate in Lieu of Sales Tax | Wireless Tax but No State Sales Tax |
| Indiana | District of Columbia | Delaware |
| Kentucky | Florida | Montana |
| New York | Illinois | New Hampshire |
| North Dakota | ||
| Pennsylvania | ||
| Rhode Island | ||
| South Dakota |
No states increased state-level discriminatory wireless taxes between 2014 and 2015. Kansas increased taxes on wireless service when it increased the sales tax rate from 6.15 percent to 6.5 percent. Florida lowered the rate of its Communications Services Tax from 9.17 percent to 7.44 percent, a tax cut for wireless consumers in excess of $100 million.
Local Taxes on Wireless Service
Some local governments also impose discriminatory taxes on wireless consumers. Many of these are legacy taxes established during the regulated telephone monopoly era that existed prior to the 1980s. Local governments in some states have had longstanding authority to impose “right-of-way fees” on telephone companies for placing poles, wires, and other landline infrastructure on public property. In other states, local governments had the authority to impose “franchise fees” on telephone companies in exchange for an exclusive franchise agreement to provide service within that municipality.
In the late 1990s and early 2000s, when wireless service began to displace landline service, some localities sought to extend these legacy impositions to wireless services and providers, even though wireless providers did not receive the same benefits for which the fees were established. A wireless provider does not receive the ability to access the public rights of way for infrastructure placement. Instead, they must negotiate a rental agreement for any use of public property similar to the agreements they negotiate for use of private property. In addition, Congress determined that wireless service should develop competitively in the United States, eliminating the need for exclusive franchise agreements with local governments.
Local governments in 12 states currently impose some type of local tax or fee on wireless consumers. With the exception of California, which does not impose a sales tax on wireless service, these local taxes are in addition to any applicable state-level tax on wireless service. Table 5 provides a breakdown of these local taxes.
Table 5.
| Local Wireless Taxes by Type | ||
| Privilege, License or User Taxes | State-Authorized Telecom Taxes | School District and Other Special District Taxes |
| Arizona | Florida | Kentucky |
| California | Illinois | New York |
| Maryland | Maryland | |
| Missouri | New York | |
| Nebraska | Utah | |
| Nevada | ||
| South Carolina | ||
| Washington | ||
| Note: Chart excludes local general sales taxes. |
Local government taxes have a significant impact on the overall tax burden on wireless consumers in many of the states that have high wireless taxes and fees. In all five states shown on Table 2 with the highest wireless tax rankings, local taxes play a prominent role. Washington allows municipal governments to impose “utility franchise taxes” with rates as high as 9 percent. Nebraska allows local business license taxes with rates as high as 6.25 percent. New York allows New York City, other selected cities, school districts, and certain transit districts to levy various wireless taxes in addition to county 911 fees. Finally, Florida and Illinois have special state communications taxes with a local add-on that result in rates typically two times higher than the sales tax.
In 2015, Prince George’s County (Maryland) increased its telecommunications tax from 8 percent to 9 percent. The County Executive had proposed to raise the tax to 12 percent but the increase was reduced by the council after an outcry from local citizens.
In 2014, the Illinois General Assembly passed legislation that permits the City of Chicago to increase the already regressive and excessive “911 fee” on wireless consumers from $2.50 to $3.90 per month. The City Council approved the increased, which took effect on September 1, 2014. The stated purpose of the hike in the 911 fee is to avoid a property tax increase. The use of 911 fees for purposes unrelated to direct expenditures on the 911 system breaks faith with wireless consumers.
Excessive per-line taxes impose a disproportionate burden on low-income individuals and families in particular. Most wireless providers have structured multi-line or “family share” plans that charge as little as $5.00 or $10.00 for additional lines added to the primary consumer’s account. With the new Chicago fee, the tax on the additional line could be nearly as expensive as the line itself. For some family share plans with four lines, the Chicago fee hike will increase the effective rate for consumers on to over 35 percent.
Table 6 illustrates the impact of taxes and fees on consumers in selected large cities around the country. Taxes in Chicago and Baltimore, which imposes a $4.00 per line tax for general revenue purposes, are particularly egregious. Wireless service is increasingly becoming the sole means of communication and connectivity for many Americans, particularly those struggling to overcome poverty. At the end of 2013, over 56 percent of all poor adults had only wireless service, and nearly 40 percent of all adults were wireless only[5]. Excessive taxes and fees, especially the regressive per line taxes like those imposed in Chicago and Baltimore, impose a disproportionate burden on low-income consumers.
Table 6.
| Wireless Taxes and Fees on Multi-Line Plan in Selected Cities, July 2015 | ||
| City | Tax on 4 line plan at $100 per month | Tax Rate |
| Chicago, IL | $36.06 | 36.06% |
| Baltimore, MD | $29.90 | 29.90% |
| Omaha, NE | $26.00 | 26.00% |
| New York, NY | $26.93 | 26.93% |
| Seattle, WA | $25.76 | 25.76% |
| Tallahassee, FL | $22.40 | 22.40% |
| Providence, RI | $23.50 | 23.50% |
| Philadelphia, PA | $23.46 | 23.46% |
| Kansas City, MO | $21.31 | 21.31% |
| Los Angeles, CA | $19.05 | 19.05% |
The Negative Effects of Burdensome and Discriminatory Wireless Taxes
The rising popularity of wireless service, and the explosive growth in the number of wireless subscribers, has led some to question whether wireless taxes matter to wireless consumers and the wireless industry. However, there are two compelling reasons why policymakers should be cautious about expanding wireless taxes, fees, and surcharges. First, as discussed above, wireless taxes and fees are regressive and have a disproportionate impact on poorer citizens. Excessive taxes and fees may reduce low-income consumer access to wireless service at a time when such access is critical to economic success. Second, discriminatory taxes may slow investment in wireless infrastructure. Ample evidence exists that investments in wireless networks provide economic benefits to the broader economy because so many sectors – transportation, health care, energy, education, even government – use wireless networks to boost productivity and efficiency.
Consumer demand for wireless service is price sensitive. According to the most recent study on the “price elasticity of demand” for wireless service, each 1 percent increase in the price of wireless service reduces consumer demand for wireless service by about 1.2 percent[6]. Using this estimate, the 10 percentage point disparity between rates on wireless service and other taxable goods and services suppresses demand for wireless service by almost 12 percent below what it would be if the tax and fee burden on wireless was equivalent to that imposed on other taxable goods and services. The reduced demand impacts network investment because subscriber revenues ultimately determine how much carriers can afford to invest in network modernization.
Network investment is important not only to consumers and businesses that use these networks, but to the entire American economy. A report by the International Chamber of Commerce (ICC) in Paris surveyed the evidence not only from the United States and Europe but from the developing world as well[7]. Economists that have examined the link between investments in communications and information technology infrastructure and economic growth have consistently found a strong link. Simply put, wireless infrastructure investment enables an entire entrepreneurial culture to focus on creating applications and devices to make businesses more productive and to improve the lives of consumers. These tools in turn make businesses more productive and profitable so that they can create new jobs that generate economic activity and tax revenues for governments.
While most infrastructure investments create these types of multiplier effects, the multiplier effects for telecommunications infrastructure are higher than for other industries because communications and information technology are so deeply embedded in business processes. These infrastructure investments also benefit the government and nonprofit sectors in ways that do not necessarily show up directly in economic statistics but nonetheless make these sectors more efficient and enable them to lower the cost of providing government services.
As noted in the ICC report, “Remedying the discriminatory tax treatment of telecom goods and services may reduce tax receipts in the short-term, but the longer-term increase in the use of advanced capability devices, service demand, and network deployment resulting from these tax reductions is likely to counteract this loss of revenue over time.”[8] Policymakers need to weigh the tradeoffs between the short-term revenue benefits of excessive wireless taxes versus the long-term economic impact on the state from reduced infrastructure investment.
Conclusion
Wireless consumers continue to be burdened with excessive taxes, fees, and surcharges in many states and localities across the United States. With state and local governments continuing to face revenue challenges, the wireless industry and its customers continue to be at risk as an attractive target for raising new revenues as demonstrated by fee increases approved in many states and the targeting of wireless customers with higher taxes in Prince George’s County, Maryland. Excessive taxes on wireless consumers disproportionately impacts poorer families and may have ramifications for long-term state economic development and growth. Higher taxes on wireless service, coupled with increased taxes on wireless investments, may lead to slower deployment of wireless network infrastructure, including fourth generation “4G” wireless broadband technologies that an increasingly mobile workforce relies upon for economic success.
Some of the increases in tax rates reflect state and local efforts to preserve revenues from communications services even as the communications marketplace is changing rapidly. Three trends suggest that the government revenue growth from communications taxes may slow or even decline in the coming years. First, there are now 355 million wireless subscribers in the United States, well above the population of 321 million. This suggests that wireless subscriber growth cannot continue at recent levels. Second, competition in the wireless industry has led to consumer price reductions, which translate into lower revenues for governments. Finally, consumers are communicating more using Internet-based services and “over the top” applications that are frequently not subject to state and local taxes or are offered for free.
States should study their existing communications tax structure and consider policies that transition their tax systems away from narrowly-based wireless taxes and toward broad-based tax sources that do not distort consumer purchasing decisions and do not slow investment in critical infrastructure like wireless broadband. Florida took a step in the right direction by reducing the Communications Services Tax in 2015, but wireless tax rates there are still well above the sales tax rate. Reform of communications taxes in states with excessive tax rates would position those states to attract additional wireless infrastructure investments that generate economic growth through the new jobs and revenue they produce while helping provide relief to low-income wireless users.
Appendix A.
| State and Local Transaction Taxes, Fees, and Government Charges on Wireless Service – July 1, 2015 | ||||
| STATE | TYPE OF TAX | RATE | COMMENTS | |
| Alabama | ||||
| AL Cell Service Tax | 6.00% | Access, interstate and intrastate | ||
| E911 | 3.75% | $1.75/ month | ||
| TOTAL TRANSACTION TAX | 9.75% | |||
| Alaska | ||||
| Local Sales Tax | 2.50% | Avg. of Juneau (5%) & Anchorage (0%) | ||
| Local E911 | 3.64% | Anchorage – $1.50; Juneau – $1.90 | ||
| State USF | 6.54% | 10.4% times FCC safe harbor | ||
| TOTAL TRANSACTION TAX | 12.69% | |||
| Arizona | ||||
| State sales (transaction priv.) | 5.60% | intrastate telecommunications service | ||
| County sales (transaction priv.) | 0.60% | Phoenix (Maricopa) = 0.7%; Tucson (Pima) = 0.5% | ||
| City telecommunications | 5.35% | Avg. Phoenix (4.7%) & Tucson (6.0%) | ||
| 911 | 0.43% | $.20 per month | ||
| TOTAL TRANSACTION TAX | 11.98% | |||
| Arkansas | ||||
| State sales tax | 6.50% | |||
| Local sales taxes | 2.88% | Avg. Little Rock (2.5%) & Fayetteville (3.25%) | ||
| State High Cost Fund | 3.46% | 5.5% times FCC safe harbor | ||
| Wireless 911 | 1.39% | $.65 / month statewide. | ||
| TRS service & TRS equipment | 0.09% | $.04 per line per month | ||
| TOTAL TRANSACTION TAX | 14.31% | |||
| California | ||||
| Local Utility User Tax | 8.00% | Avg. of LA (9%) and Sacramento (7%) | ||
| State 911 | 0.47% | 0.75% times FCC safe harbor | ||
| PUC fee | 0.11% | 0.18% times FCC safe harbor | ||
| ULTS (lifeline) | 1.51% | 2.4% times FCC safe harbor | ||
| Deaf/CRS | 0.31% | 0.5% times FCC safe harbor | ||
| High Cost Funds A & B | 0.22% | 0.35% times FCC safe harbor | ||
| Teleconnect Fund | 0.68% | 1.08% times FCC safe harbor | ||
| CASF – advanced services fund | 0.29% | 0.464% times FCC safe harbor | ||
| TOTAL TRANSACTION TAX | 11.60% | |||
| Colorado | ||||
| State Sales Tax | 2.90% | access and intrastate | ||
| Local Sales Tax — City/County | 4.74% | Avg. of Denver (4.75%) & Colorado Springs (4.73%) | ||
| 911 | 1.50% | Denver ($.70) / Colorado Springs ($.70) | ||
| USF | 1.64% | 2.6% times FCC safe harbor | ||
| TOTAL TRANSACTION TAX | 10.78% | |||
| Connecticut | ||||
| State sales tax | 6.35% | Access, interstate and intrastate | ||
| 911 | 1.09% | $.51 per line | ||
| TOTAL TRANSACTION TAX | 7.44% | |||
| Delaware | ||||
| Public Utility Gross Receipts Tax | 5.00% | Access and intrastate | ||
| Local 911 tax | 1.29% | $.60 / month | ||
| TOTAL TRANSACTION TAX | 6.29% | |||
| District of Columbia | ||||
| Telecommunication Privilege Tax | 10.00% | Monthly gross charge; | ||
| 911 | 1.63% | $0.76 per month; | ||
| TOTAL TRANSACTION TAX | 11.63% | |||
| Florida | ||||
| State Communications services | 7.44% | Access, interstate and intrastate | ||
| Local Communications services | 6.36% | Jacksonville 5.82%; Tallahassee 6.9% | ||
| 911 | 0.86% | $.40/month statewide | ||
| TOTAL TRANSACTION TAX | 14.66% | |||
| Georgia | ||||
| State sales tax | 3.00% | 4% of “access charge” — assume $35 | ||
| Local sales tax | 3.00% | Avg. rate Atlanta (4%) & Augusta (4%) | ||
| Local 911 | 3.22% | Altanta — $1.50/line; Augusta — $1.50/line | ||
| TOTAL TRANSACTION TAX | 9.22% | |||
| Hawaii | ||||
| Public service company tax | 4.00% | |||
| Additional county tax | 1.89% | |||
| PUC Fee | 0.31% | 0.5% times FCC safe harbor | ||
| Wireless 911 | 1.42% | $.66 per month | ||
| TOTAL TRANSACTION TAX | 7.61% | |||
| Idaho | ||||
| Telephone service assistance program | 0.02% | Set annually by PUC — currently $.01/mo | ||
| Statewide wireless 911 | 2.14% | Boise = $1.00 per month | ||
| TOTAL TRANSACTION TAX | 2.17% | |||
| Illinois | ||||
| State telecom excise tax | 7.00% | Access, interstate and intrastate | ||
| Simplified municipal tax | 5.50% | Avg. of Chicago (7%) & Springfield (4%) | ||
| Wireless 911 | 4.96% | Chicago $3.90/mo.; others $.73/mo | ||
| TOTAL TRANSACTION TAX | 17.46% | |||
| Indiana | ||||
| State sales tax | 7.00% | Access and intrastate | ||
| Utility receipts tax | 1.40% | Same base as sales tax | ||
| Wireless 911 | 2.14% | Increased from $.90 to $1.00 7/1/2015 | ||
| State USF | 0.39% | .62% x FCC safe harbor | ||
| PUC fee | 0.12% | Statutory max 0.15% | ||
| TOTAL TRANSACTION TAX | 11.06% | |||
| Iowa | ||||
| State sales tax | 6.00% | |||
| Local option sales taxes | 0.50% | Avg. of Cedar Rapids (1%) & Des Moines (0%) | ||
| Wireless 911 | 2.14% | $1.00 per month eff. 7/1/2013 | ||
| Dual Party Relay Service fee | 0.06% | $0.03 per month | ||
| TOTAL TRANSACTION TAX | 8.71% | |||
| Kansas | ||||
| State sales tax | 6.50% | intrastate & interstate | ||
| Local option sales taxes | 1.83% | Avg. of Wichita (1.0%) & Topeka (2.65%) | ||
| USF | 4.07% | 6.47% x FCC safe harbor | ||
| Wireless 911 | 1.14% | $.53 per month per line | ||
| TOTAL TRANSACTION TAX | 13.53% | |||
| Kentucky | ||||
| State sales tax | 6.00% | Access, interstate and intrastate | ||
| School utility gross receipts | 1.50% | Avg Frankfort (3%) and Lousiville (0%) | ||
| Kentucky USF | 0.17% | $.08 per month | ||
| Kentucky TAP & TRS | 0.09% | $.04 per month | ||
| Wireless 911 | 1.50% | $.70 / month | ||
| Communications gross receipts tax | 1.30% | Access, interstate and intrastate | ||
| TOTAL TRANSACTION TAX | 10.56% | |||
| Louisiana | ||||
| State sales tax | 3.00% | Intrastate rate | ||
| Wireless 911 | 1.82% | New Orleans $0.85/mo.; Baton Rouge $.85/mo. | ||
| State USF | 2.47% | May vary by carrier | ||
| TOTAL TRANSACTION TAX | 7.29% | |||
| Maine | ||||
| State service provider tax | 5.00% | intrastate | ||
| 911 fee | 0.96% | $.45 per month | ||
| Maine USF | 0.95% | 1.51% times FCC safe harbor | ||
| MTEAF | 0.44% | 0.7% times FCC safe harbor | ||
| TOTAL TRANSACTION TAX | 7.35% | |||
| Maryland | ||||
| State sales tax | 6.00% | “mobile telecommunications service” | ||
| Local telecom excise | 4.29% | $4.00 per month in Baltimore; no tax in Annapolis | ||
| State 911 | 0.54% | $.25 per month | ||
| County 911 | 1.61% | $.75 per month in all counties | ||
| State USF | 0.24% | $0.11 per month | ||
| TOTAL TRANSACTION TAX | 12.67% | |||
| Massachusetts | ||||
| State sales tax | 6.25% | interstate and intrastate | ||
| Wireless 911 | 2.68% | Increased to $1.25 from $.75 per month on 7/1/2015 | ||
| TOTAL TRANSACTION TAX | 8.93% | |||
| Michigan | ||||
| State sales tax | 6.00% | interstate and intrastate | ||
| State wireless 911 | 0.41% | $.19 per month | ||
| County wireless 911 | 1.45% | Detroit $.70; Lansing $.65 | ||
| Intrastate toll assessment | 0.43% | Up from 0.32% to 0.68% of intrastate charges | ||
| TOTAL TRANSACTION TAX | 8.28% | |||
| Minnesota | ||||
| State sales tax | 6.88% | Interstate and intrastate | ||
| Local sales tax | 0.83% | Minneapolis (0.9%) and St. Paul (0.75%) | ||
| 911 | 1.67% | $.78 per month | ||
| Telecom access MN fund | 0.17% | PUC increased from $.06 to $.08 on 11/1/2014 | ||
| TOTAL TRANSACTION TAX | 9.54% | |||
| Mississippi | ||||
| State sales tax | 7.00% | Access, interstate and intrastate | ||
| Wireless 911 | 2.14% | $1.00 per month per line | ||
| TOTAL TRANSACTION TAX | 9.14% | |||
| Missouri | ||||
| State sales tax | 4.23% | Access and intrastate | ||
| Local sales taxes | 4.06% | Avg. Jefferson City (3.5%) & Kansas City (4.625%) | ||
| Local business license tax | 6.50% | Jefferson City (7%); Kansas City (6% residential) | ||
| TOTAL TRANSACTION TAX | 14.79% | |||
| Montana | ||||
| Telecom excise tax | 3.75% | Access, interstate and intrastate | ||
| 911 & E911 tax | 2.14% | $1.00 per number per month | ||
| TDD tax | 0.21% | $.10 per number per month | ||
| TOTAL TRANSACTION TAX | 6.11% | |||
| Nebraska | ||||
| State sales tax | 5.50% | Access & intrastate | ||
| Local sales tax | 1.50% | Lincoln (1.5%) and Omaha (1.5%) | ||
| City business and occupation tax | 6.13% | Avg. of Omaha (6.25%) & Lincoln (6.0%) | ||
| State USF | 4.37% | 6.95% times FCC safe harbor | ||
| Wireless 911 | 0.96% | $.45 per month | ||
| TRS | 0.06% | $.03 per month | ||
| TOTAL TRANSACTION TAX | 18.53% | |||
| Nevada | ||||
| Local franchise / gross receipts | 1.61% | 5% of first $15 intrastate revenues | ||
| Local 911 tax | 0.27% | Washoe County = $.25 / month; Clark County no fee | ||
| State deaf relay charge | 0.06% | $.03 per month | ||
| Nevada USF | 0.01% | 0.01% times FCC safe harbor | ||
| TOTAL TRANSACTION TAX | 1.95% | |||
| New Hampshire | ||||
| Communication services tax | 7.00% | Access, interstate and intrastate | ||
| 911 tax | 1.22% | $.57 per month | ||
| TOTAL TRANSACTION TAX | 8.22% | |||
| New Jersey | ||||
| State sales tax | 7.00% | |||
| Wireless 911 | 1.93% | $.90 per month | ||
| TOTAL TRANSACTION TAX | 8.93% | |||
| New Mexico | ||||
| State gross receipts (sales) tax | 5.13% | 5.125% intrastate; 4.25% interstate | ||
| City and county gross receipts tax | 2.62% | Avg. Santa Fe (3.19%) & Albuquerque (2.06%) | ||
| Wireless 911 | 1.09% | $.51 per month | ||
| TRS surcharge | 0.21% | 0.33% times FCC safe harbor | ||
| State USF | 2.17% | 3.45% times FCC safe harbor | ||
| TOTAL TRANSACTION TAX | 11.22% | |||
| New York | ||||
| State sales tax | 4.00% | Intrastate and monthly access | ||
| Local sales taxes | 4.25% | NYC 4.5%; Albany 4% | ||
| MCTD sales tax | 0.19% | NYC 0.375%; Albany 0% | ||
| State excise tax (186e) | 2.90% | mobile telecom service — includes interstate | ||
| MCTD excise/surcharge (186e) | 0.36% | NYC & surrounding counties – .72%; Albany 0% | ||
| Local utility gross receipts tax | 1.49% | NYC — 84% of 2.35%; Albany 1% | ||
| State wireless 911 | 2.57% | $1.20 per month | ||
| Local wireless 911 | 0.64% | $.30 per month — NYC & most counties | ||
| School district utility sales tax | 1.50% | Albany 3%; NYC no tax | ||
| TOTAL TRANSACTION TAX | 17.90% | |||
| North Carolina | ||||
| State sales tax | 7.00% | Access, interstate and intrastate | ||
| Wireless 911 | 1.29% | $.60 per month | ||
| TRS Charge | 0.30% | $.14 per month | ||
| TOTAL TRANSACTION TAX | 8.59% | |||
| North Dakota | ||||
| State sales tax | 5.00% | Access and intrastate | ||
| Local sales taxes | 2.00% | Avg Fargo (2.5%) & Bismarck (1.5%) | ||
| State gross receipts tax | 2.50% | interstate and intrastate | ||
| Local 911 tax | 2.68% | $1.00 Bismarck; $1.50 Fargo | ||
| TRS | 0.09% | Up to $.11/mo — currently $.04 | ||
| TOTAL TRANSACTION TAX | 12.27% | |||
| Ohio | ||||
| State sales tax | 5.75% | Access, interstate and intrastate | ||
| Local sales taxes | 2.00% | Columbus (1.75%) and Cleveland (2.25%) | ||
| Regulatory fee | 0.13% | Intrastate Gross Revenues | ||
| State/local wireless 911 | 0.54% | $.25 per month | ||
| TOTAL TRANSACTION TAX | 8.42% | |||
| Oklahoma | ||||
| State sales tax | 4.50% | Access, interstate and intrastate | ||
| Local sales taxes | 3.95% | Avg. of OK City (3.875%) & Tulsa (4.017%) | ||
| Local 911 | 1.07% | $.50 per month in OK City and Tulsa | ||
| USF | 1.36% | 2.16% times FCC safe harbor | ||
| TOTAL TRANSACTION TAX | 10.88% | |||
| Oregon | ||||
| Local utililty tax | 0.00% | No tax on wireless in Portland or Salem | ||
| 911 tax | 1.61% | $.75 per month | ||
| RSPF Surcharge | 0.19% | $0.09 per month | ||
| TOTAL TRANSACTION TAX | 1.80% | |||
| Pennsylvania | ||||
| State sales tax | 6.00% | Access, interstate and intrastate | ||
| State gross receipts tax | 5.00% | Access, interstate and intrastate | ||
| Local sales tax | 1.00% | Philadephia 2%; Harrisburg 0% | ||
| Statewide wireless 911 | 2.14% | $1.00 per month; increases to $1.65 on 8/1/15 | ||
| TOTAL TRANSACTION TAX | 14.14% | |||
| Puerto Rico | IVU (Sales Tax) | 11.50% | Increased from 7% on 7/1/2015 | |
| 911 fee | 1.07% | $.50 per line | ||
| USF | 0.87% | 1.39% times FCC safe harbor | ||
| TOTAL TRANSACTION TAX | 13.45% | |||
| Rhode Island | ||||
| State sales tax | 7.00% | Access, interstate and intrastate | ||
| Gross receipts tax | 5.00% | Access, interstate and intrastate | ||
| 911 fee | 2.14% | $1.00 per month | ||
| Additional wireless 911 fee | 0.56% | $.26 per month | ||
| TOTAL TRANSACTION TAX | 14.70% | |||
| South Carolina | ||||
| State sales tax | 6.00% | Access, interstate and intrastate | ||
| Local sales tax | 2.25% | Avg. of Charleston (2.5%) and Columbia (2%) | ||
| Municipal license tax | 1.00% | Charleston (1.0%) and Columbia (1.0%) | ||
| 911 tax | 1.33% | $.62 / month | ||
| TOTAL TRANSACTION TAX | 10.58% | |||
| South Dakota | ||||
| State sales tax | 4.00% | access, interstate and intrastate | ||
| State gross receipts tax | 4.00% | Wireless only effective 7/1/03 | ||
| local option sales tax | 2.00% | Avg. of Pierre (2.0%) and Sioux Falls (2.0%) | ||
| 911 excise | 2.68% | $1.25 per month | ||
| TRS fee | 0.32% | $.15 per month by statute | ||
| PUC fee | 0.14% | intrastate receipts | ||
| TOTAL TRANSACTION TAX | 13.14% | |||
| Tennessee | ||||
| State sales tax | 7.00% | Access, interstate and intrastate | ||
| Local sales tax | 2.50% | Statewide local rate for intrastate | ||
| 911 tax | 2.49% | $1.16 per month | ||
| TOTAL TRANSACTION TAX | 11.99% | |||
| Texas | ||||
| State sales tax | 6.25% | Access, interstate and intrastate | ||
| Local sales tax | 2.00% | Austin (2.0%) & Houston (2.0%) | ||
| Wireless 911 tax | 1.07% | $.50 per month per line | ||
| Texas USF | 2.08% | 3.3% times FCC safe harbor | ||
| 911 Equalization surcharge | 0.13% | $.06 per line | ||
| TOTAL TRANSACTION TAX | 11.53% | |||
| Utah | ||||
| State sales tax | 4.70% | Access and intrastate | ||
| Local sales taxes | 2.10% | Avg. of Salt Lake City (2.15%) and Provo (2.05%) | ||
| Local utility wireless | 3.50% | Levied at 3.5% max. in SLC and Provo | ||
| Local 911 | 1.31% | $.61/month | ||
| State 911 | 0.19% | $.09/month | ||
| Poison Control | 0.13% | $.06/month | ||
| State USF | 0.63% | 1.0% rate times FCC safe harbor | ||
| State TRS | 0.21% | $.10 per line | ||
| TOTAL TRANSACTION TAX | 12.77% | |||
| Vermont | ||||
| State sales tax | 6.00% | Access, interstate and intrastate | ||
| Local sales tax | 0.50% | Avg. of Montpelier (0%) and Burlington (1%) | ||
| State USF | 2.00% | funds 911 and other programs | ||
| TOTAL TRANSACTION TAX | 8.50% | |||
| Virginia | ||||
| State communications sales tax | 5.00% | CST | ||
| Wireless 911 | 1.61% | $.75 per month | ||
| TOTAL TRANSACTION TAX | 6.61% | |||
| Washington | ||||
| State sales tax | 6.50% | Access, interstate and intrastate | ||
| Local sales taxes | 2.65% | Olympia (2.3%) & Seattle (3.0%) average | ||
| B&O / Utility Franchise — local | 7.50% | Olympia (9%) & Seattle (6%) average | ||
| 911 — state | 0.54% | $.25 per month | ||
| 911 — local | 1.50% | $.70 per month | ||
| TOTAL TRANSACTION TAX | 18.69% | |||
| West Virginia | ||||
| Wireless 911 | 6.43% | $3.00 per month | ||
| TOTAL TRANSACTION TAX | 6.43% | |||
| Wisconsin | ||||
| State sales tax | 5.00% | Access, intrastate and interstate | ||
| Local sales tax | 0.55% | Avg. of Milwaukee (0.6%) & Madison (0.5%) | ||
| Police and Fire Protection Fee | 1.61% | $.75 per month | ||
| State USF | 0.02% | 0.026% times FCC safe harbor | ||
| TOTAL TRANSACTION TAX | 7.17% | |||
| Wyoming | ||||
| State sales tax | 4.00% | access and intrastate | ||
| Local sales tax | 1.50% | Avg. of Cheyenne (2%) and Casper (1%) | ||
| TRS | 0.09% | Up to $.25/month — $.04 currently | ||
| USF | 0.75% | 1.2% times FCC safe harbor | ||
| 911 tax | 1.61% | $.75 per month in Cheyenne and Casper | ||
| TOTAL TRANSACTION TAX | 7.95% | |||
| ARPU = $46.64 | ||||
| FCC Safe Harbor = 62.9% | ||||
| Sources: Methodology: Committee on State Taxation, 50-State Study and Report on Telecommunications Taxation, May 2005. Updated July 2015 by Scott Mackey, KSE Partners LLP, using state statutes and regulations. | ||||
| Average Revenue Per Unit (ARPU): $46.64 per Cellular Telephone and Internet Association, July 2015. |
[1] State Tax Notes, July 19, 2004, p. 181; Feb. 18, 2008, p. 519; Feb. 14, 2011, p. 475; Oct. 29, 2012, p. 321; Tax Foundation, Fiscal Fact No. 441, Oct. 8, 2014, https://taxfoundation.org/article/wireless-taxation-united-states-2014.
[2] Committee on State Taxation, 50-State Study and Report on Telecommunications Taxation, 1999.
[3] FCC rules allow wireless providers to multiply this 37.1 percent “safe harbor” by the quarterly contribution percentage rate to determine the Federal USF surcharge rate imposed on monthly contract plans that do not distinguish between Interstate and Intrastate calls. The FCC also allows carriers to use “traffic studies” showing the actual, network-wide percentage of Interstate and Intrastate calls as an alternative method for determining the Federal USF contribution amounts and related surcharge rate. For the purposes of this study, the rates are calculated using the “safe harbor” method.
[4] This calculation uses an average monthly bill of $46.64 to estimate the amount of taxes paid in excess of what would be paid if only the average state and local sales tax rate applied to wireless service. For the Federal USF surcharge, the calculation uses the FCC Interstate safe harbor percentage (37.1 percent) to determine the interstate portion of the average monthly bill subject to the federal surcharge.
[5] Stephen J. Blumberg, Ph.D. and Julian V. Luke, Wireless Substitution: Early Release of Estimates from the National Health Interview Survey, July – December 2014, p. 6, June 2015, http://www.cdc.gov/nchs/data/nhis/earlyrelease/wireless201506.pdf.
[6] Allan T. Ingraham and J. Gregory Sidak, Do States Tax Wireless Services Inefficiently? Evidence on the Price Elasticity of Demand, pp. 249-261, Virginia Tax Review, Fall 2004.
[7] International Chamber of Commerce, ICC Discussion Paper on the Adverse Effects of Discriminatory Taxes on Telecommunications Service, Oct, 26, 2010, http://www.iccindiaonline.org/downloads/disscusstion-paper-28-oct.pdf.
[8] Ibid, p. 2.
Share this article