Executive Summary
Taxes and fees on wireless consumers increased to a record high 18.6% of the average U.S. customer’s monthly bill. In just two years, the average wireless taxA tax is a mandatory payment or charge collected by local, state, and national governments from individuals or businesses to cover the costs of general government services, goods, and activities. burden has increased by 1.5 percentage points, and wireless taxes are now 4.5 percentage points higher than they were ten years ago. A typical American household with four wireless phones paying $100 per month for wireless voice service is now paying nearly $225 per year in taxes, fees, and government surcharges.
Wireless industry competition has led to significant reductions in average monthly bills from $46.44 per month in 2015 to $44.65 in 2016. Since 2008, average monthly bills have dropped from just under $50 per month to $44.65 per month – an 11% reduction – while taxes and fees have increased from 15.1% to 18.6% – a 23% increase. Unfortunately, consumers are not enjoying the full benefit of these price reductions because of the growing tax burden on wireless service. Taxes are growing at a rate twice as fast as average wireless prices have been falling.
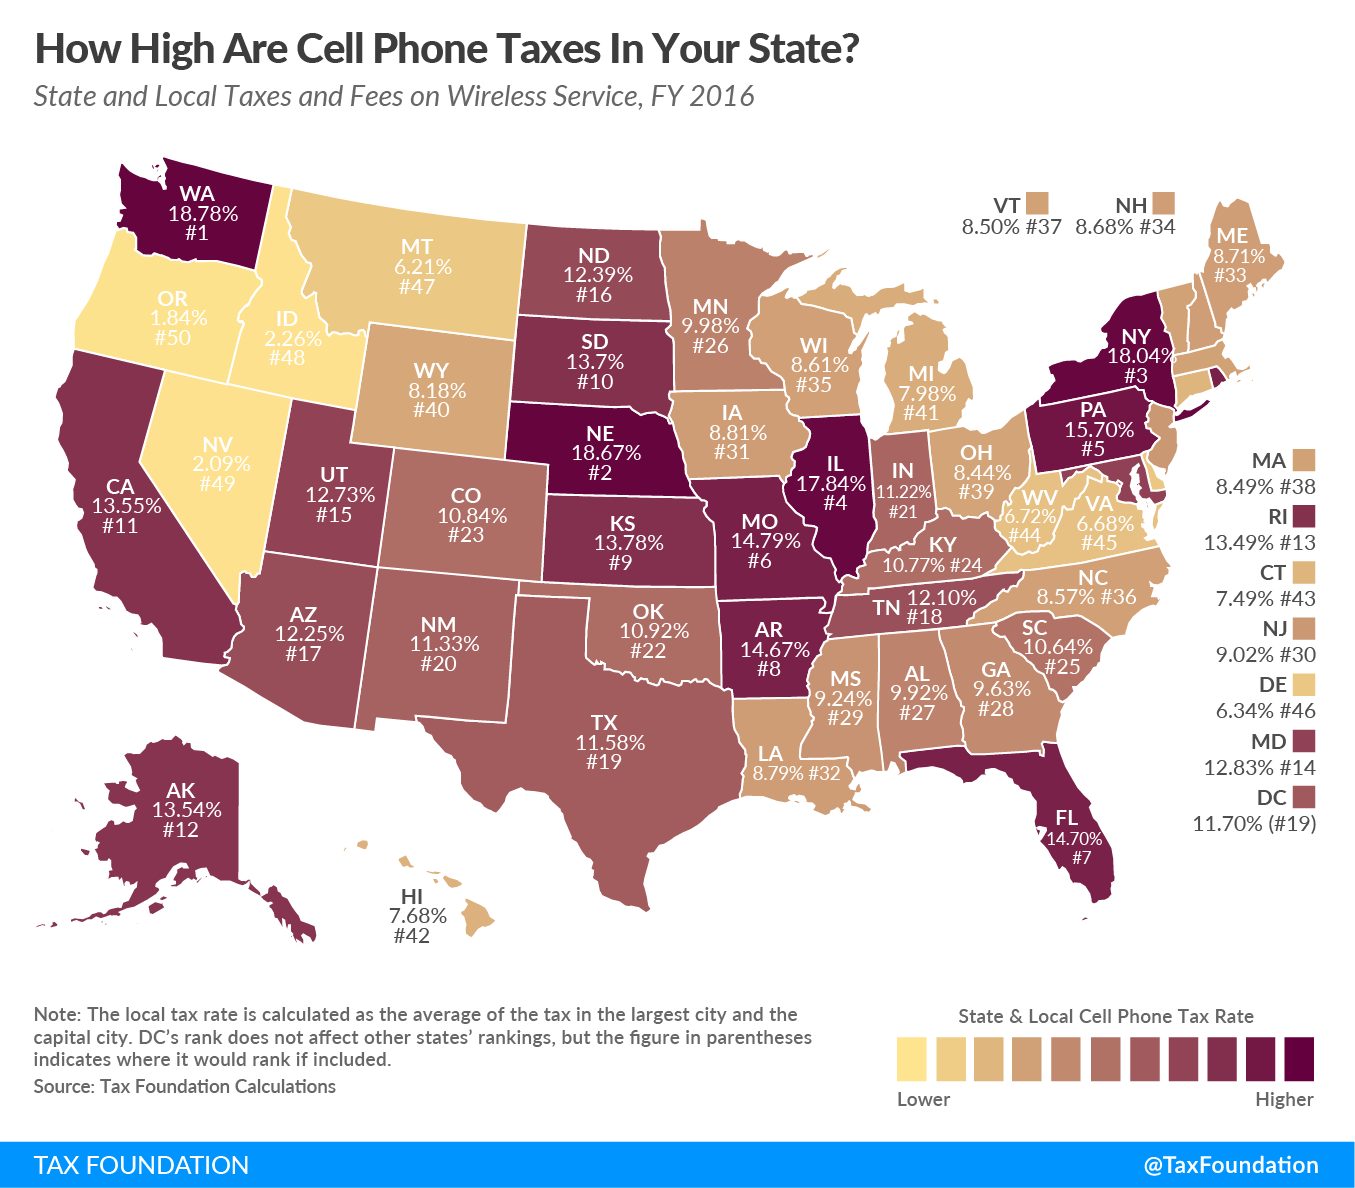
Once again, consumers in the state of Washington pay the highest wireless taxes in the country, with total taxes and fees again adding more than 25% to the bill. Nebraska, New York, Illinois, and Pennsylvania round out the “top five” states with high wireless taxes. Oregon, Nevada, and Idaho customers continue to enjoy the lowest wireless taxes and fees in the country.
Wireless consumers pay an estimated $17.2 billion in taxes, fees, and government surcharges. They break down as follows:
- $7.0 billion in sales taxes and other non-discriminatory broad-based consumption taxes
- $5.1 billion in federal Universal Service Fund (FUSF) surcharges
- $2.5 billion in 911 fees
- $2.6 billion in other discriminatory state and local taxes, fees, and surcharges
In recent years, increases in the federal USF charge were the largest drivers of rising wireless taxes and fees. This year, however, state and local taxes and fees increased significantly faster that the federal USF surcharge.
Wireless service is increasingly the sole means of communication and connectivity for many Americans, particularly those with lower incomes. At the end of 2015, according to the Centers for Disease Control, more than 64% of all poor adults had only wireless service and more than 48% of all adults of all incomes were wireless only. Excessive taxes and fees, especially regressive per-line taxes, impose a disproportionate burden on low-income consumers.
Wireless Tax and Fee Burdens Increase to a Record 18.6 Percent
This is the seventh in a series of reports that examines trends in the taxes, fees, and surcharges imposed by federal, state, and local governments on wireless services from 2003 through 2016. These reports use the methodology developed in 1999 by the Committee on State Taxation, now the Council on State Taxation (COST). Recognizing that it would be nearly impossible to aggregate tax rates from the more than 10,000 taxing jurisdictions across the country, the study used an average of the most populated city and the capital city in each state as a proxy to compare tax rates across the states.[1] This methodology allows for time-series comparisons of trends in wireless taxation.
Figure 1 shows national trends in state and local average tax rates on wireless service between 2003 and 2016. Between 2005 and 2006, wireless tax burdens dropped after a series of federal court decisions forced the IRS to end the imposition of the 3% federal excise tax on wireless service, reducing the average overall tax burden to 14.1%. Since then, rates climbed steadily until hitting the current record of 18.6%.
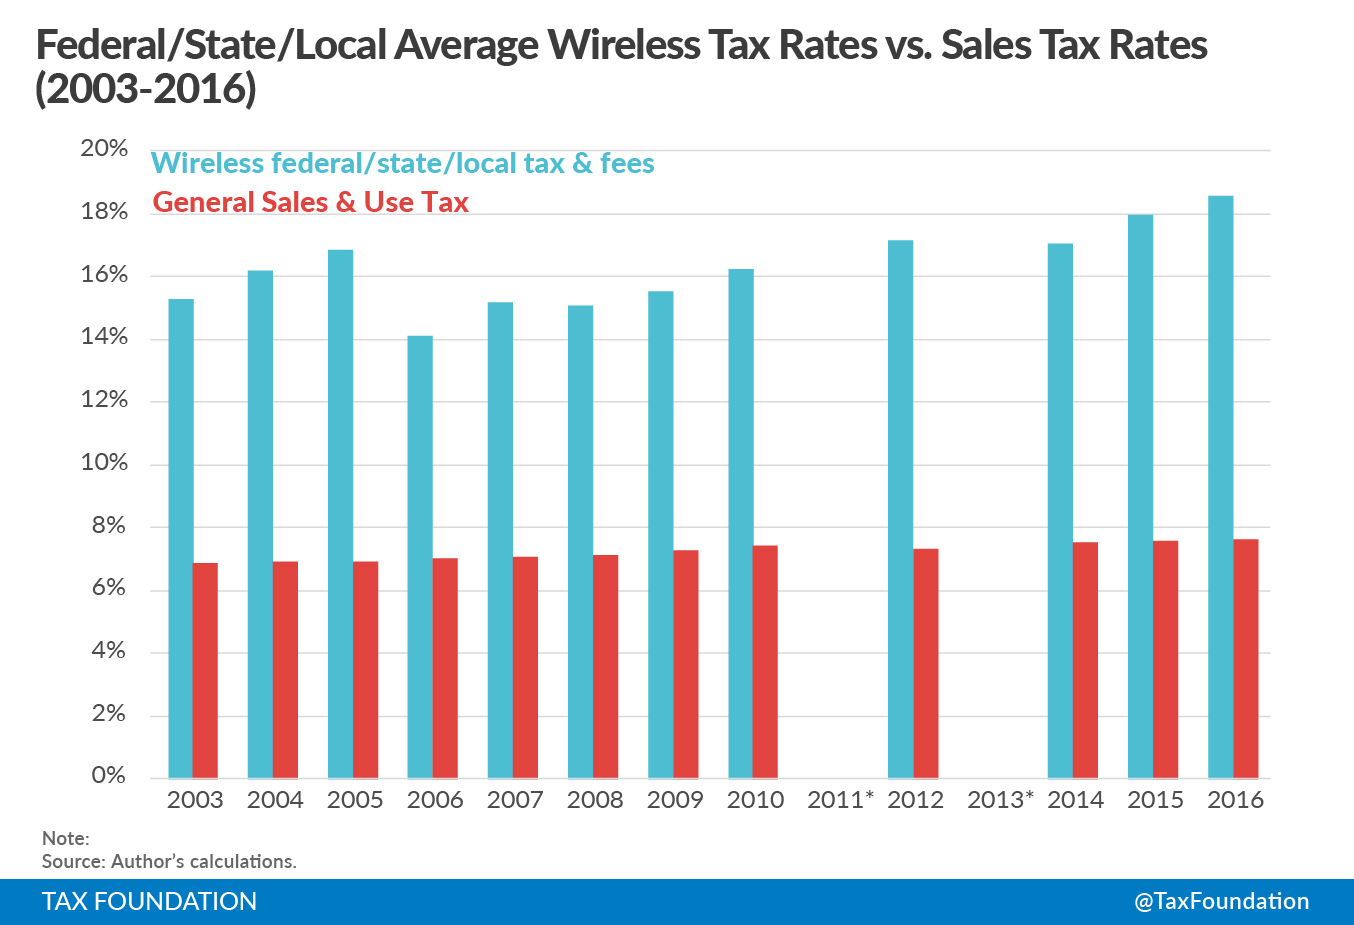
Table 1 shows the detail behind the trends highlighted in Figure 1, including state-local average rates as well as federal impositions. Between 2003 and 2016, state and local taxes, fees, and surcharges on wireless service increased by 1.7 percentage points – from 10.20 percent to 11.93 percent – while average state and local sales tax rates increased by just over seven-tenths of a percentage point– from 6.87 percent to 7.61 percent. Federal taxes and Universal Service Fee (USF) charges increased from 5.07 percent to 6.64 percent.
| 1/1/2003 | 4/1/2004 | 7/1/2005 | 7/1/2006 | 7/1/2007 | 7/1/2008 | 7/1/2009 | 7/1/2010 | 7/1/2012 | 7/1/2014 | 7/1/2015 | 7/1/2016 | ||||||||||||||||||||||||||||||||||||||||||||||||||||||||||||||||||||||||||||||||||||||||
|---|---|---|---|---|---|---|---|---|---|---|---|---|---|---|---|---|---|---|---|---|---|---|---|---|---|---|---|---|---|---|---|---|---|---|---|---|---|---|---|---|---|---|---|---|---|---|---|---|---|---|---|---|---|---|---|---|---|---|---|---|---|---|---|---|---|---|---|---|---|---|---|---|---|---|---|---|---|---|---|---|---|---|---|---|---|---|---|---|---|---|---|---|---|---|---|---|---|---|---|
| Source: Methodology derived from Committee on State Taxation, “50-State Study and Report on Telecommunications Taxation,” May 2005. Updated July 2016 from state statutes, FCC data, and local ordinances by Scott Mackey, KSE Partners LLP, Montpelier, VT | |||||||||||||||||||||||||||||||||||||||||||||||||||||||||||||||||||||||||||||||||||||||||||||||||||
| Note: Federal includes 3% federal excise tax (until 5/2006) and federal universal service fund charge, which is set by the FCC and varies quarterly: Federal USF 7/1/2016 — 37.1% x 17.9% = 6.64% | |||||||||||||||||||||||||||||||||||||||||||||||||||||||||||||||||||||||||||||||||||||||||||||||||||
| Wireless -state & local tax & fee | 10.20% | 10.74% | 10.94% | 11.14% | 11.00% | 10.86% | 10.74% | 11.21% | 11.36% | 11.23% | 11.50% | 11.93% | |||||||||||||||||||||||||||||||||||||||||||||||||||||||||||||||||||||||||||||||||||||||
| Wireless – federal tax & fee | 5.07% | 5.48% | 5.91% | 2.99% | 4.19% | 4.23% | 4.79% | 5.05% | 5.82% | 5.82% | 6.46% | 6.64% | |||||||||||||||||||||||||||||||||||||||||||||||||||||||||||||||||||||||||||||||||||||||
| Wireless federal/state/local tax & fee | 15.27% | 16.22% | 16.85% | 14.13% | 15.19% | 15.09% | 15.53% | 16.26% | 17.18% | 17.05% | 17.96% | 18.57% | |||||||||||||||||||||||||||||||||||||||||||||||||||||||||||||||||||||||||||||||||||||||
| General Sales/Use Tax | 6.87% | 6.93% | 6.94% | 7.04% | 7.07% | 7.11% | 7.26% | 7.42% | 7.33% | 7.51% | 7.57% | 7.61% | |||||||||||||||||||||||||||||||||||||||||||||||||||||||||||||||||||||||||||||||||||||||
| Disparity — Wireless Tax Over General Sales Tax | 3.33% | 3.81% | 4.00% | 4.10% | 3.93% | 3.75% | 3.48% | 3.79% | 4.03% | 3.72% | 3.93% | 4.32% | |||||||||||||||||||||||||||||||||||||||||||||||||||||||||||||||||||||||||||||||||||||||
Wireless industry competition has led to significant reductions in average monthly bills since 2008, a trend which continued in 2016 with the average monthly bill dropping from $46.44 per month in 2015 to $44.65 in 2016. Unfortunately, consumers are not enjoying the full benefit of these price reductions because of the growing tax and fee burden on wireless service. Since 2008, average monthly bills have dropped from just under $50 per month to $44.65 per month – an 11% reduction – while taxes and fees have increased from 15.1% to 18.6% – a 23% increase.[2] Taxes are growing at a rate twice as fast as average wireless prices have been falling.
The causes of the growth in the wireless tax burden are markedly different depending upon the time period considered. State and local impositions grew rapidly between 2003 and 2006, leveled off between 2007 and 2009, and increased again after 2010. On the other hand, federal impositions dropped dramatically in 2006 when the Internal Revenue Service concluded that the 3 percent federal excise taxAn excise tax is a tax imposed on a specific good or activity. Excise taxes are commonly levied on cigarettes, alcoholic beverages, soda, gasoline, insurance premiums, amusement activities, and betting, and typically make up a relatively small and volatile portion of state and local and, to a lesser extent, federal tax collections. no longer applied to wireless service. However, the elimination of the federal excise tax was offset by rapid increases in the federal USF, which has more than doubled from 2.99% to its current level of 6.64% in 10 years.
What is the Federal Universal Service Fund?
The federal USF (FUSF) is administered by the Federal Communications Commission (FCC) under open-ended authority from Congress. The program subsidizes telecommunications services for schools, libraries, hospitals, low-income people, and rural telephone companies operating in high cost areas. The FCC has authority to set spending for these programs outside of the normal congressional appropriations process. After deciding what to spend on the various programs, the FCC sets the quarterly “contribution factor” or surcharge rate that telecommunications providers must remit to the USF to generate sufficient revenues to fund the expenditure commitments. Providers are permitted to surcharge these “contributions” on the phone bills.
FUSF surcharges apply only to interstate telecommunications services. They currently do not apply to Internet Access service, information services, and intrastate telecommunications services.
Wireless carriers generally sell plans that include either unlimited voice minutes or a fixed number of voice minutes for a set amount. Since these plans include both interstate calls (subject to the FUSF) and intrastate calls (not subject to FUSF), the FCC allows providers to allocate the fixed monthly plans to interstate and intrastate calls by one of two methods. Carriers may use traffic studies to show the actual split between interstate and interstate calls for all of its subscribers and apply the FUSF to the aggregated interstate portion of subscriber calls.
Alternatively, carriers may use a single uniform national “safe harbor” percentage to its fixed monthly plans. The FCC currently sets this safe harbor at 37.1% of the fixed monthly charge. For example, when determining the FUSF, a customer with a $50 monthly plan is deemed to include $18.55 in interstate calls and $31.45 in intrastate calls. If a carrier elects to use the safe harbor, the FUSF rate would be applied to $18.55 of the bill each month.
The FUSF rate (euphemistically called the “contribution factor”) is set by the FCC each quarter. For the period beginning July 1, 2016, the contribution factor is 17.9%. Thus, the FUSF rate is 6.46% (17.9% times 62.9%).[3] Figure 3 below highlights the significant growth in the FCC contribution rate since 2003.

Despite the growing burden on wireless consumers, Congress has not acted to limit the growth of the programs funded through the FSUF.
States also have the authority to supplement the programs funded through the FUSF with their own programs funded through state universal services funds. The state programs are funded to surcharges applied to the intrastate portion of telephone charges. Like the FUSF, state universal service fund charges do not apply to Internet access. State USF charges are a key factor in the high wireless tax burden in states like California, Kansas, and Nebraska. As shown in Appendix A, 20 states impose their own USF charges.
Table 2 provides a snapshot of wireless tax, fee, and surcharge burdens by states as of July 2016. Column 1 shows the state and local tax burden in each state, while column 3 shows the total tax, fee, and surcharge burden including the FUSF surcharge. Washington has now edged out Nebraska as the state with the highest average wireless consumer burden in the country, with a combined rate of 25.42 percent. Nebraska is not far behind with a combined burden of 25.31 percent.
| Rank | State | 2016 Wireless State-Local Rate | 2016 Federal USF Rate | 2016 Combined Federal/State/Local Rate | |||||||||||||||||||||||||||||||||||||||||||||||||||||||||||||||||||||||||||||||||||||||||||||||
|---|---|---|---|---|---|---|---|---|---|---|---|---|---|---|---|---|---|---|---|---|---|---|---|---|---|---|---|---|---|---|---|---|---|---|---|---|---|---|---|---|---|---|---|---|---|---|---|---|---|---|---|---|---|---|---|---|---|---|---|---|---|---|---|---|---|---|---|---|---|---|---|---|---|---|---|---|---|---|---|---|---|---|---|---|---|---|---|---|---|---|---|---|---|---|---|---|---|---|---|
| Source: Methodology from COST, “50-State Study and Report on Telecommunications Taxation,” May 2005. Updated July 2016 using state statutes, FCC data, and local ordinances. | |||||||||||||||||||||||||||||||||||||||||||||||||||||||||||||||||||||||||||||||||||||||||||||||||||
| 1 | Washington | 18.78% | 6.64% | 25.42% | |||||||||||||||||||||||||||||||||||||||||||||||||||||||||||||||||||||||||||||||||||||||||||||||
| 2 | Nebraska | 18.67% | 6.64% | 25.31% | |||||||||||||||||||||||||||||||||||||||||||||||||||||||||||||||||||||||||||||||||||||||||||||||
| 3 | New York | 18.04% | 6.64% | 24.68% | |||||||||||||||||||||||||||||||||||||||||||||||||||||||||||||||||||||||||||||||||||||||||||||||
| 4 | Illinois | 17.84% | 6.64% | 24.48% | |||||||||||||||||||||||||||||||||||||||||||||||||||||||||||||||||||||||||||||||||||||||||||||||
| 5 | Pennsylvania | 15.70% | 6.64% | 22.34% | |||||||||||||||||||||||||||||||||||||||||||||||||||||||||||||||||||||||||||||||||||||||||||||||
| 6 | Rhode Island | 14.82% | 6.64% | 21.46% | |||||||||||||||||||||||||||||||||||||||||||||||||||||||||||||||||||||||||||||||||||||||||||||||
| 7 | Missouri | 14.79% | 6.64% | 21.43% | |||||||||||||||||||||||||||||||||||||||||||||||||||||||||||||||||||||||||||||||||||||||||||||||
| 8 | Florida | 14.70% | 6.64% | 21.34% | |||||||||||||||||||||||||||||||||||||||||||||||||||||||||||||||||||||||||||||||||||||||||||||||
| 9 | Arkansas | 14.67% | 6.64% | 21.31% | |||||||||||||||||||||||||||||||||||||||||||||||||||||||||||||||||||||||||||||||||||||||||||||||
| 10 | Kansas | 13.78% | 6.64% | 20.42% | |||||||||||||||||||||||||||||||||||||||||||||||||||||||||||||||||||||||||||||||||||||||||||||||
| 11 | South Dakota | 13.72% | 6.64% | 20.36% | |||||||||||||||||||||||||||||||||||||||||||||||||||||||||||||||||||||||||||||||||||||||||||||||
| 12 | California | 13.55% | 6.64% | 20.19% | |||||||||||||||||||||||||||||||||||||||||||||||||||||||||||||||||||||||||||||||||||||||||||||||
| 13 | Alaska | 13.54% | 6.64% | 20.18% | |||||||||||||||||||||||||||||||||||||||||||||||||||||||||||||||||||||||||||||||||||||||||||||||
| 14 | Puerto Rico | 13.49% | 6.64% | 20.13% | |||||||||||||||||||||||||||||||||||||||||||||||||||||||||||||||||||||||||||||||||||||||||||||||
| 15 | Maryland | 12.83% | 6.64% | 19.47% | |||||||||||||||||||||||||||||||||||||||||||||||||||||||||||||||||||||||||||||||||||||||||||||||
| 16 | Utah | 12.73% | 6.64% | 19.37% | |||||||||||||||||||||||||||||||||||||||||||||||||||||||||||||||||||||||||||||||||||||||||||||||
| 17 | North Dakota | 12.39% | 6.64% | 19.03% | |||||||||||||||||||||||||||||||||||||||||||||||||||||||||||||||||||||||||||||||||||||||||||||||
| 18 | Arizona | 12.25% | 6.64% | 18.89% | |||||||||||||||||||||||||||||||||||||||||||||||||||||||||||||||||||||||||||||||||||||||||||||||
| 19 | Tennessee | 12.10% | 6.64% | 18.74% | |||||||||||||||||||||||||||||||||||||||||||||||||||||||||||||||||||||||||||||||||||||||||||||||
| 20 | DC | 11.70% | 6.64% | 18.34% | |||||||||||||||||||||||||||||||||||||||||||||||||||||||||||||||||||||||||||||||||||||||||||||||
| 21 | Texas | 11.58% | 6.64% | 18.22% | |||||||||||||||||||||||||||||||||||||||||||||||||||||||||||||||||||||||||||||||||||||||||||||||
| 22 | New Mexico | 11.33% | 6.64% | 17.97% | |||||||||||||||||||||||||||||||||||||||||||||||||||||||||||||||||||||||||||||||||||||||||||||||
| 23 | Indiana | 11.22% | 6.64% | 17.86% | |||||||||||||||||||||||||||||||||||||||||||||||||||||||||||||||||||||||||||||||||||||||||||||||
| 24 | Oklahoma | 10.92% | 6.64% | 17.56% | |||||||||||||||||||||||||||||||||||||||||||||||||||||||||||||||||||||||||||||||||||||||||||||||
| 25 | Colorado | 10.84% | 6.64% | 17.48% | |||||||||||||||||||||||||||||||||||||||||||||||||||||||||||||||||||||||||||||||||||||||||||||||
| 26 | Kentucky | 10.77% | 6.64% | 17.41% | |||||||||||||||||||||||||||||||||||||||||||||||||||||||||||||||||||||||||||||||||||||||||||||||
| 27 | South Carolina | 10.64% | 6.64% | 17.28% | |||||||||||||||||||||||||||||||||||||||||||||||||||||||||||||||||||||||||||||||||||||||||||||||
| 28 | Minnesota | 9.98% | 6.64% | 16.62% | |||||||||||||||||||||||||||||||||||||||||||||||||||||||||||||||||||||||||||||||||||||||||||||||
| 29 | Alabama | 9.92% | 6.64% | 16.56% | |||||||||||||||||||||||||||||||||||||||||||||||||||||||||||||||||||||||||||||||||||||||||||||||
| 30 | Mississippi | 9.24% | 6.64% | 15.88% | |||||||||||||||||||||||||||||||||||||||||||||||||||||||||||||||||||||||||||||||||||||||||||||||
| 31 | Georgia | 9.63% | 6.64% | 16.27% | |||||||||||||||||||||||||||||||||||||||||||||||||||||||||||||||||||||||||||||||||||||||||||||||
| 32 | New Jersey | 9.02% | 6.64% | 15.66% | |||||||||||||||||||||||||||||||||||||||||||||||||||||||||||||||||||||||||||||||||||||||||||||||
| 33 | Iowa | 8.81% | 6.64% | 15.45% | |||||||||||||||||||||||||||||||||||||||||||||||||||||||||||||||||||||||||||||||||||||||||||||||
| 34 | Maine | 8.71% | 6.64% | 15.35% | |||||||||||||||||||||||||||||||||||||||||||||||||||||||||||||||||||||||||||||||||||||||||||||||
| 35 | New Hampshire | 8.68% | 6.64% | 15.32% | |||||||||||||||||||||||||||||||||||||||||||||||||||||||||||||||||||||||||||||||||||||||||||||||
| 36 | Wisconsin | 8.61% | 6.64% | 15.25% | |||||||||||||||||||||||||||||||||||||||||||||||||||||||||||||||||||||||||||||||||||||||||||||||
| 37 | North Carolina | 8.57% | 6.64% | 15.21% | |||||||||||||||||||||||||||||||||||||||||||||||||||||||||||||||||||||||||||||||||||||||||||||||
| 38 | Vermont | 8.50% | 6.64% | 15.14% | |||||||||||||||||||||||||||||||||||||||||||||||||||||||||||||||||||||||||||||||||||||||||||||||
| 39 | Massachusetts | 8.49% | 6.64% | 15.13% | |||||||||||||||||||||||||||||||||||||||||||||||||||||||||||||||||||||||||||||||||||||||||||||||
| 40 | Louisiana | 8.79% | 6.64% | 15.43% | |||||||||||||||||||||||||||||||||||||||||||||||||||||||||||||||||||||||||||||||||||||||||||||||
| 41 | Ohio | 8.44% | 6.64% | 15.08% | |||||||||||||||||||||||||||||||||||||||||||||||||||||||||||||||||||||||||||||||||||||||||||||||
| 42 | Wyoming | 8.18% | 6.64% | 14.82% | |||||||||||||||||||||||||||||||||||||||||||||||||||||||||||||||||||||||||||||||||||||||||||||||
| 43 | Michigan | 7.98% | 6.64% | 14.62% | |||||||||||||||||||||||||||||||||||||||||||||||||||||||||||||||||||||||||||||||||||||||||||||||
| 44 | Hawaii | 7.68% | 6.64% | 14.32% | |||||||||||||||||||||||||||||||||||||||||||||||||||||||||||||||||||||||||||||||||||||||||||||||
| 45 | Connecticut | 7.49% | 6.64% | 14.13% | |||||||||||||||||||||||||||||||||||||||||||||||||||||||||||||||||||||||||||||||||||||||||||||||
| 46 | West Virginia | 6.72% | 6.64% | 13.36% | |||||||||||||||||||||||||||||||||||||||||||||||||||||||||||||||||||||||||||||||||||||||||||||||
| 47 | Virginia | 6.68% | 6.64% | 13.32% | |||||||||||||||||||||||||||||||||||||||||||||||||||||||||||||||||||||||||||||||||||||||||||||||
| 48 | Delaware | 6.34% | 6.64% | 12.98% | |||||||||||||||||||||||||||||||||||||||||||||||||||||||||||||||||||||||||||||||||||||||||||||||
| 49 | Montana | 6.21% | 6.64% | 12.85% | |||||||||||||||||||||||||||||||||||||||||||||||||||||||||||||||||||||||||||||||||||||||||||||||
| 50 | Idaho | 2.26% | 6.64% | 8.90% | |||||||||||||||||||||||||||||||||||||||||||||||||||||||||||||||||||||||||||||||||||||||||||||||
| 51 | Nevada | 2.09% | 6.64% | 8.73% | |||||||||||||||||||||||||||||||||||||||||||||||||||||||||||||||||||||||||||||||||||||||||||||||
| 52 | Oregon | 1.84% | 6.64% | 8.48% | |||||||||||||||||||||||||||||||||||||||||||||||||||||||||||||||||||||||||||||||||||||||||||||||
| Weighted Avg. | 11.93% | 6.64% | 18.57% | ||||||||||||||||||||||||||||||||||||||||||||||||||||||||||||||||||||||||||||||||||||||||||||||||
| Simple Avg. | 10.70% | 6.64% | 17.34% | ||||||||||||||||||||||||||||||||||||||||||||||||||||||||||||||||||||||||||||||||||||||||||||||||
Table 2 shows the states by average state and local rates, without including federal impositions. Consumers in five states pay rates in excess of 15 percent, and in another 20 states plus the District of Columbia and Puerto Rico the rate is between 10
percent and 15 percent. Of the remaining 25 states with rates below 10 percent, only three – Idaho, Nevada, and Oregon – have rates below 5 percent. Oregon consumers continue to enjoy the lowest combined state and local rates in the country, at just 1.8
percent.
One of the longstanding arguments for reform of wireless taxation is the disparity in the tax burdens on wireless services as compared to the tax burdens on other goods and services subject to state sales and use taxes. Table 3 ranks the states by measuring the disparity in state and local tax rates between the wireless tax rate and the general sales and use rate. Nebraska and Alaska are the only states that have a disparity of greater than 10 percentage points between the wireless rate and the general sales taxA sales tax is levied on retail sales of goods and services and, ideally, should apply to all final consumption with few exemptions. Many governments exempt goods like groceries; base broadening, such as including groceries, could keep rates lower. A sales tax should exempt business-to-business transactions which, when taxed, cause tax pyramiding. rate. Other states with large disparities include Washington, New York, Pennsylvania, and Illinois. New Hampshire ranks sixth in the disparity between wireless taxes and sales taxes despite having a relatively low rate on wireless service, because the state does not have a sales tax but imposes a 7 percent communications tax and a $.75 monthly 911 fee on wireless service. Two other states that impose taxes on wireless but do not have sales taxes – Delaware and Montana – also rank relatively high on this disparity scale despite their relatively low rates on wireless service.
Five states have lower state and local rates on wireless service than the general sales tax rate: Alabama, West Virginia, Louisiana, Idaho, and Nevada.
Wireless consumers pay about $5.2 billion annually in excessive state and local taxes and fees, defined as taxes and fees in excess of the normal state and local sales taxes imposed on the purchase of other goods and services. This total includes about $2.5 billion in 911 fees levied by state and local governments that, in most cases, pay for maintaining the 911 system. Unfortunately, according to the FCC, some states routinely divert 911 fees to other uses. [4] Wireless consumers also pay an additional $2.6 billion in state and local wireless taxes that do not apply to other goods and services. Finally, as discussed in the previous section, wireless consumers pay about $5.1 billion in FUSF surcharges.[5]
| Rank | State | State-Local Sales Tax | State-Local Wireless Tax | Wireless Over/Under Sales Tax | Disparity Multiple | ||||||||||||||||||||||||||||||||||||||||||||||||||||||||||||||||||||||||||||||||||||||||||||||
|---|---|---|---|---|---|---|---|---|---|---|---|---|---|---|---|---|---|---|---|---|---|---|---|---|---|---|---|---|---|---|---|---|---|---|---|---|---|---|---|---|---|---|---|---|---|---|---|---|---|---|---|---|---|---|---|---|---|---|---|---|---|---|---|---|---|---|---|---|---|---|---|---|---|---|---|---|---|---|---|---|---|---|---|---|---|---|---|---|---|---|---|---|---|---|---|---|---|---|---|
| Source: Methodology from COST, “50-State Study and Report on Telecommunications Taxation,” | |||||||||||||||||||||||||||||||||||||||||||||||||||||||||||||||||||||||||||||||||||||||||||||||||||
| May 2005. Updated July 2016 using state statutes, FCC data, and local ordinances. | |||||||||||||||||||||||||||||||||||||||||||||||||||||||||||||||||||||||||||||||||||||||||||||||||||
| 1 | Nebraska | 7.13% | 18.67% | 11.54% | 2.62 | ||||||||||||||||||||||||||||||||||||||||||||||||||||||||||||||||||||||||||||||||||||||||||||||
| 2 | Alaska | 2.50% | 13.54% | 11.04% | 5.42 | ||||||||||||||||||||||||||||||||||||||||||||||||||||||||||||||||||||||||||||||||||||||||||||||
| 3 | Washington | 9.15% | 18.78% | 9.63% | 2.05 | ||||||||||||||||||||||||||||||||||||||||||||||||||||||||||||||||||||||||||||||||||||||||||||||
| 4 | New York | 8.44% | 18.04% | 9.60% | 2.14 | ||||||||||||||||||||||||||||||||||||||||||||||||||||||||||||||||||||||||||||||||||||||||||||||
| 5 | Pennsylvania | 7.00% | 15.70% | 8.70% | 2.24 | ||||||||||||||||||||||||||||||||||||||||||||||||||||||||||||||||||||||||||||||||||||||||||||||
| 6 | New Hampshire | 0.00% | 8.68% | 8.68% | NA | ||||||||||||||||||||||||||||||||||||||||||||||||||||||||||||||||||||||||||||||||||||||||||||||
| 7 | Illinois | 9.38% | 17.84% | 8.46% | 1.90 | ||||||||||||||||||||||||||||||||||||||||||||||||||||||||||||||||||||||||||||||||||||||||||||||
| 8 | Rhode Island | 7.00% | 14.82% | 7.82% | 2.12 | ||||||||||||||||||||||||||||||||||||||||||||||||||||||||||||||||||||||||||||||||||||||||||||||
| 9 | Florida | 7.25% | 14.70% | 7.45% | 2.03 | ||||||||||||||||||||||||||||||||||||||||||||||||||||||||||||||||||||||||||||||||||||||||||||||
| 10 | South Dakota | 6.50% | 13.72% | 7.22% | 2.11 | ||||||||||||||||||||||||||||||||||||||||||||||||||||||||||||||||||||||||||||||||||||||||||||||
| 11 | Maryland | 6.00% | 12.83% | 6.83% | 2.14 | ||||||||||||||||||||||||||||||||||||||||||||||||||||||||||||||||||||||||||||||||||||||||||||||
| 12 | Missouri | 8.29% | 14.79% | 6.50% | 1.78 | ||||||||||||||||||||||||||||||||||||||||||||||||||||||||||||||||||||||||||||||||||||||||||||||
| 13 | Delaware | 0.00% | 6.34% | 6.34% | NA | ||||||||||||||||||||||||||||||||||||||||||||||||||||||||||||||||||||||||||||||||||||||||||||||
| 14 | Montana | 0.00% | 6.21% | 6.21% | NA | ||||||||||||||||||||||||||||||||||||||||||||||||||||||||||||||||||||||||||||||||||||||||||||||
| 15 | DC | 5.75% | 11.70% | 5.95% | 2.03 | ||||||||||||||||||||||||||||||||||||||||||||||||||||||||||||||||||||||||||||||||||||||||||||||
| 16 | Utah | 6.85% | 12.73% | 5.88% | 1.86 | ||||||||||||||||||||||||||||||||||||||||||||||||||||||||||||||||||||||||||||||||||||||||||||||
| 17 | Kansas | 8.33% | 13.78% | 5.45% | 1.65 | ||||||||||||||||||||||||||||||||||||||||||||||||||||||||||||||||||||||||||||||||||||||||||||||
| 18 | North Dakota | 7.00% | 12.39% | 5.39% | 1.77 | ||||||||||||||||||||||||||||||||||||||||||||||||||||||||||||||||||||||||||||||||||||||||||||||
| 19 | Arkansas | 9.38% | 14.67% | 5.30% | 1.56 | ||||||||||||||||||||||||||||||||||||||||||||||||||||||||||||||||||||||||||||||||||||||||||||||
| 20 | California | 8.75% | 13.55% | 4.80% | 1.55 | ||||||||||||||||||||||||||||||||||||||||||||||||||||||||||||||||||||||||||||||||||||||||||||||
| 21 | Kentucky | 6.00% | 10.77% | 4.77% | 1.80 | ||||||||||||||||||||||||||||||||||||||||||||||||||||||||||||||||||||||||||||||||||||||||||||||
| 22 | Indiana | 7.00% | 11.22% | 4.22% | 1.60 | ||||||||||||||||||||||||||||||||||||||||||||||||||||||||||||||||||||||||||||||||||||||||||||||
| 23 | Arizona | 8.35% | 12.25% | 3.90% | 1.47 | ||||||||||||||||||||||||||||||||||||||||||||||||||||||||||||||||||||||||||||||||||||||||||||||
| 24 | Hawaii | 4.00% | 7.68% | 3.68% | 1.92 | ||||||||||||||||||||||||||||||||||||||||||||||||||||||||||||||||||||||||||||||||||||||||||||||
| 25 | New Mexico | 7.83% | 11.33% | 3.50% | 1.45 | ||||||||||||||||||||||||||||||||||||||||||||||||||||||||||||||||||||||||||||||||||||||||||||||
| 26 | Texas | 8.25% | 11.58% | 3.33% | 1.40 | ||||||||||||||||||||||||||||||||||||||||||||||||||||||||||||||||||||||||||||||||||||||||||||||
| 27 | Colorado | 7.64% | 10.84% | 3.20% | 1.42 | ||||||||||||||||||||||||||||||||||||||||||||||||||||||||||||||||||||||||||||||||||||||||||||||
| 28 | Wisconsin | 5.55% | 8.61% | 3.06% | 1.55 | ||||||||||||||||||||||||||||||||||||||||||||||||||||||||||||||||||||||||||||||||||||||||||||||
| 29 | Tennessee | 9.25% | 12.10% | 2.85% | 1.31 | ||||||||||||||||||||||||||||||||||||||||||||||||||||||||||||||||||||||||||||||||||||||||||||||
| 30 | Maine | 6.00% | 8.71% | 2.71% | 1.45 | ||||||||||||||||||||||||||||||||||||||||||||||||||||||||||||||||||||||||||||||||||||||||||||||
| 31 | Wyoming | 5.50% | 8.18% | 2.68% | 1.49 | ||||||||||||||||||||||||||||||||||||||||||||||||||||||||||||||||||||||||||||||||||||||||||||||
| 32 | Oklahoma | 8.45% | 10.92% | 2.47% | 1.29 | ||||||||||||||||||||||||||||||||||||||||||||||||||||||||||||||||||||||||||||||||||||||||||||||
| 33 | South Carolina | 8.25% | 10.64% | 2.39% | 1.29 | ||||||||||||||||||||||||||||||||||||||||||||||||||||||||||||||||||||||||||||||||||||||||||||||
| 34 | Iowa | 6.50% | 8.81% | 2.31% | 1.36 | ||||||||||||||||||||||||||||||||||||||||||||||||||||||||||||||||||||||||||||||||||||||||||||||
| 35 | Minnesota | 7.70% | 9.98% | 2.28% | 1.30 | ||||||||||||||||||||||||||||||||||||||||||||||||||||||||||||||||||||||||||||||||||||||||||||||
| 36 | Massachusetts | 6.25% | 8.49% | 2.24% | 1.36 | ||||||||||||||||||||||||||||||||||||||||||||||||||||||||||||||||||||||||||||||||||||||||||||||
| 37 | New Jersey | 7.00% | 9.02% | 2.02% | 1.29 | ||||||||||||||||||||||||||||||||||||||||||||||||||||||||||||||||||||||||||||||||||||||||||||||
| 38 | Vermont | 6.50% | 8.50% | 2.00% | 1.31 | ||||||||||||||||||||||||||||||||||||||||||||||||||||||||||||||||||||||||||||||||||||||||||||||
| 39 | Puerto Rico | 11.50% | 13.49% | 1.99% | 1.17 | ||||||||||||||||||||||||||||||||||||||||||||||||||||||||||||||||||||||||||||||||||||||||||||||
| 40 | Michigan | 6.00% | 7.98% | 1.98% | 1.33 | ||||||||||||||||||||||||||||||||||||||||||||||||||||||||||||||||||||||||||||||||||||||||||||||
| 41 | Oregon | 0.00% | 1.84% | 1.84% | NA | ||||||||||||||||||||||||||||||||||||||||||||||||||||||||||||||||||||||||||||||||||||||||||||||
| 42 | Mississippi | 7.50% | 9.24% | 1.74% | 1.23 | ||||||||||||||||||||||||||||||||||||||||||||||||||||||||||||||||||||||||||||||||||||||||||||||
| 43 | Georgia | 8.00% | 9.63% | 1.63% | 1.20 | ||||||||||||||||||||||||||||||||||||||||||||||||||||||||||||||||||||||||||||||||||||||||||||||
| 44 | North Carolina | 7.00% | 8.57% | 1.57% | 1.22 | ||||||||||||||||||||||||||||||||||||||||||||||||||||||||||||||||||||||||||||||||||||||||||||||
| 45 | Connecticut | 6.35% | 7.49% | 1.14% | 1.18 | ||||||||||||||||||||||||||||||||||||||||||||||||||||||||||||||||||||||||||||||||||||||||||||||
| 46 | Virginia | 5.65% | 6.68% | 1.03% | 1.18 | ||||||||||||||||||||||||||||||||||||||||||||||||||||||||||||||||||||||||||||||||||||||||||||||
| 47 | Ohio | 7.75% | 8.44% | 0.69% | 1.09 | ||||||||||||||||||||||||||||||||||||||||||||||||||||||||||||||||||||||||||||||||||||||||||||||
| 48 | Alabama | 10.00% | 9.92% | -0.08% | 0.99 | ||||||||||||||||||||||||||||||||||||||||||||||||||||||||||||||||||||||||||||||||||||||||||||||
| 49 | West Virginia | 7.00% | 6.72% | -0.28% | 0.96 | ||||||||||||||||||||||||||||||||||||||||||||||||||||||||||||||||||||||||||||||||||||||||||||||
| 50 | Louisiana | 10.00% | 8.48% | -1.52% | 0.85 | ||||||||||||||||||||||||||||||||||||||||||||||||||||||||||||||||||||||||||||||||||||||||||||||
| 51 | Idaho | 6.00% | 2.26% | -3.74% | 0.38 | ||||||||||||||||||||||||||||||||||||||||||||||||||||||||||||||||||||||||||||||||||||||||||||||
| 52 | Nevada | 7.94% | 2.09% | -5.85% | 0.26 | ||||||||||||||||||||||||||||||||||||||||||||||||||||||||||||||||||||||||||||||||||||||||||||||
| US Weighted Average | 7.61% | 11.93% | 4.32% | 1.57 | |||||||||||||||||||||||||||||||||||||||||||||||||||||||||||||||||||||||||||||||||||||||||||||||
Appendix A provides a detailed breakdown of the types of taxes, fees, and surcharges imposed in each state and their relative rates. To facilitate interstate comparisons, local rates imposed in the most populated city and the capital city of each state are averaged into a single local rate. In states or localities where taxes, fees, or surcharges are imposed on a flat per-line basis – for example, $1.00 per month per line – the imposition is converted into a percentage by dividing the flat amount by the industry’s average revenue per line of $44.65 per month.
Trends in Wireless Taxes and Fees
911 Fees
Most states impose 911 fees to fund capital expenses for the 911 system, and in some cases the fees fund 911 operations as well. Wireless 911 fees vary greatly by state, from a low of zero in Missouri to a high of $3.00 per line per month in West Virginia. While most 911 fees are imposed statewide at a uniform rate, 15 states allow local governments to impose 911 fees.
Five states increased 911 fees between 2015 and 2016. The largest increase was in Pennsylvania, which hiked the fee from $1.00 per line per month to $1.65 per line per month in August 2015. Illinois, Kansas, Minnesota, and New Hampshire also saw modest increases in 911 fees. Massachusetts lowered the fee from $1.25 per month to $1.00 per month. This 25-cent monthly reduction followed a 50-cent increase in 2014.
State Universal Service Funds
Some states have their own USF that provide subsidies for many of the same purposes as the FUSF. State USF surcharges are imposed on revenues from intrastate telecommunications services, while the FUSF applies to revenues from interstate services. In states like Alaska, Kansas, and Nebraska, state USF surcharge rates add significantly to the overall burden on wireless consumers.
Most state laws allow regulators to increase or decrease USF rates based on program needs and market factors. Eight states increased the rates of their state USF between 2015 and 2016, with most of the increases being relatively small. One exception was California, where the Public Utility Commission hiked the surcharge used to fund the state “lifeline” program
from 2.5% of intrastate charges to 5.5% of intrastate charges. This increase will mean that more than 35 million California wireless consumers will pay an average of $10 more per year on their phone bills. Alaska increased its USF rate, which was already the highest in the country, for the second year in a row, from 10.4% to 11.5% of intrastate charges. Other states increasing their USF rates were Arkansas, Indiana, Kansas, Kentucky, Maine, and Wyoming. Maryland was the only state that reduced the state USF rate.
State Level Wireless Taxes
In addition to 911 fees and state USF charges, 14 states impose taxes on wireless service at the state level that are imposed either in addition to sales taxes or in lieu of sales taxes but at a higher rate than the state sales tax. Table 4 below shows these states.
| State Gross Receipts Tax in Addition to Sales Tax | Higher State Tax Rate in Lieu of Sales Tax | Wireless Tax but No State Sales Tax |
| Indiana | District of Columbia | Delaware |
| Kentucky | Florida | Montana |
| New York | Illinois | New Hampshire |
| North Dakota | Maine | |
| Pennsylvania | ||
| Rhode Island | ||
| South Dakota |
Maine increased its “service provider tax,” which applies to telecommunications and a few other services, from 5 percent to 6 percent. The general sales tax in Maine remains at 5.5 percent. State taxes on wireless also increased in Louisiana and South Dakota when those states increased their general sales tax rates.
Local Wireless Taxes
Some local governments also impose discriminatory taxes on wireless consumers. Many of these are legacy taxes established during the regulated telephone monopoly era that existed prior to the 1980s. Local governments in some states have had longstanding authority to impose “right-of-way fees” on telephone companies for placing poles, wires, and other landline infrastructure on public property. In other states, local governments had the authority to impose “franchise fees” on telephone companies in exchange for an exclusive franchise agreement to provide service within that municipality.
In the late 1990s and early 2000s, when wireless service began to displace landline service, some localities sought to extend these legacy impositions to wireless services and providers, even though wireless providers did not receive the same benefits for which the fees were established. A wireless provider does not receive the ability to access the public rights of way for infrastructure placement. Instead, it must negotiate a rental agreement for any use of public property similar to the agreements it negotiates for use of private property. In addition, Congress determined that wireless service should develop competitively in the United States, eliminating the need for exclusive franchise agreements with local governments.
Local governments in 12 states currently impose some type of local tax or fee on wireless consumers. In most of these states, the local tax or fee is in addition to a state tax. California is the exception – wireless service is not subject to state and local sales taxes but is subject to local Utility User Taxes. Table 5 provides a breakdown of these local taxes:
| Privilege, License or User Taxes | State-Authorized Telecom Taxes | School District and Other Special District Taxes | |||||||||||||||||||||||||||||||||||||||||||||||||||||||||||||||||||||||||||||||||||||||||||||||||
| Note: Excludes local general sales taxes. | |||||||||||||||||||||||||||||||||||||||||||||||||||||||||||||||||||||||||||||||||||||||||||||||||||
| Arizona | Florida | Kentucky | |||||||||||||||||||||||||||||||||||||||||||||||||||||||||||||||||||||||||||||||||||||||||||||||||
| California | Illinois | New York | |||||||||||||||||||||||||||||||||||||||||||||||||||||||||||||||||||||||||||||||||||||||||||||||||
| Maryland | Maryland | ||||||||||||||||||||||||||||||||||||||||||||||||||||||||||||||||||||||||||||||||||||||||||||||||||
| Missouri | New York | ||||||||||||||||||||||||||||||||||||||||||||||||||||||||||||||||||||||||||||||||||||||||||||||||||
| Nebraska | Utah | ||||||||||||||||||||||||||||||||||||||||||||||||||||||||||||||||||||||||||||||||||||||||||||||||||
| Nevada | |||||||||||||||||||||||||||||||||||||||||||||||||||||||||||||||||||||||||||||||||||||||||||||||||||
| South Carolina | |||||||||||||||||||||||||||||||||||||||||||||||||||||||||||||||||||||||||||||||||||||||||||||||||||
| Washington | |||||||||||||||||||||||||||||||||||||||||||||||||||||||||||||||||||||||||||||||||||||||||||||||||||
Local government taxes have a significant impact on the overall tax burden on wireless consumers in many of the states that have high wireless taxes and fees. In all five states shown in Table 2 with the highest wireless tax rank, local taxes play a prominent role. Washington allows municipal governments to impose “utility franchise taxes” with rates as high as 9 percent. Nebraska allows local business license taxes with rates as high as 6.25 percent. New York allows New York City, other selected cities, school districts, and certain transit districts to levy various wireless taxes in addition to county 911 fees. Finally, Florida and Illinois have special state communications taxes with a local add-on that result in rates typically two times higher than the sales tax.
Tucson, Arizona, was the only locality covered by the study that increased a discriminatory wireless tax in 2016, increasing the rate from 6% to 6.5% percent. In addition, local sales taxes paid by wireless consumers were increased in Lincoln, Nebraska; Albuquerque, New Mexico; and Provo, Utah.
Excessive per-line taxes impose a disproportionate burden on low-income individuals and families in particular. Most wireless providers have structured multi-line or “family share” plans that charge as little as $5 or $10 for additional lines added to the primary consumer’s account. In Chicago and Baltimore, for example, the tax on the additional line could be nearly as expensive as the line itself.
Table 6 illustrates the impact of taxes and fees on consumers in selected large cities around the country. Wireless service is increasingly becoming the sole means of communication and connectivity for many Americans, particularly those struggling to overcome poverty. At the end of 2015, more than 64% of all poor adults had only wireless service, and nearly 48% of all adults were wireless only.[6] Excessive taxes and fees, especially the regressive per line taxes like those imposed in Chicago ($3.90 per line per month) and Baltimore ($4.00 per line per month), impose a disproportionate burden on low-income consumers.
| Federal, State, and Local | |||||||||||||||||||||||||||||||||||||||||||||||||||||||||||||||||||||||||||||||||||||||||||||||||||
| City | Tax on 4 line plan @ $100 per month | Tax Rate | |||||||||||||||||||||||||||||||||||||||||||||||||||||||||||||||||||||||||||||||||||||||||||||||||
| Chicago, IL | $36.24 | 36.24% | |||||||||||||||||||||||||||||||||||||||||||||||||||||||||||||||||||||||||||||||||||||||||||||||||
| Baltimore, MD | $29.84 | 29.84% | |||||||||||||||||||||||||||||||||||||||||||||||||||||||||||||||||||||||||||||||||||||||||||||||||
| New York, NY | $27.11 | 27.11% | |||||||||||||||||||||||||||||||||||||||||||||||||||||||||||||||||||||||||||||||||||||||||||||||||
| Philadelphia, PA | $26.24 | 26.24% | |||||||||||||||||||||||||||||||||||||||||||||||||||||||||||||||||||||||||||||||||||||||||||||||||
| Omaha, NE | $26.06 | 26.06% | |||||||||||||||||||||||||||||||||||||||||||||||||||||||||||||||||||||||||||||||||||||||||||||||||
| Seattle, WA | $25.94 | 25.94% | |||||||||||||||||||||||||||||||||||||||||||||||||||||||||||||||||||||||||||||||||||||||||||||||||
| Providence, RI | $23.68 | 23.68% | |||||||||||||||||||||||||||||||||||||||||||||||||||||||||||||||||||||||||||||||||||||||||||||||||
| Tallahassee, FL | $22.58 | 22.58% | |||||||||||||||||||||||||||||||||||||||||||||||||||||||||||||||||||||||||||||||||||||||||||||||||
| Kansas City, MO | $21.49 | 21.49% | |||||||||||||||||||||||||||||||||||||||||||||||||||||||||||||||||||||||||||||||||||||||||||||||||
| Los Angeles, CA | $21.19 | 21.19% | |||||||||||||||||||||||||||||||||||||||||||||||||||||||||||||||||||||||||||||||||||||||||||||||||
The Impact of Burdensome and Discriminatory Wireless Taxes
The rising popularity of wireless service, and the explosive growth in the number of wireless subscribers, has led some to question whether wireless taxes matter to wireless consumers and the wireless industry. However, there are two compelling reasons why policymakers should be cautious about expanding wireless taxes, fees and surcharges. First, as discussed above, wireless taxes and fees are regressive and have a disproportionate impact on poorer citizens. Excessive taxes and fees may reduce low-income consumer access to wireless service at a time when such access is critical to economic success. Second, discriminatory taxes may slow investment in wireless infrastructure. Ample evidence exists that investments in wireless networks provide economic benefits to the broader economy because so many sectors – transportation, health care, energy, education, even government – use wireless networks to boost productivity and efficiency.
Consumer demand for wireless service is sensitive to price. According to the most recent study on the “price elasticity of demand” for wireless service, each 1 percent increase in the price of wireless service reduces consumer demand for wireless service by about 1.2%.[7] Using this estimate, the ten percentage-point disparity between rates on wireless service and other taxable goods and services would suppress demand for wireless service by almost 12% below what it would be if the tax and fee burden on wireless was equivalent to that imposed on other taxable goods and services. The reduced demand impacts network investment because subscriber revenues ultimately determine how much carriers can afford to invest in network modernization.
Network investment is important not only to consumers and businesses that use these networks, but to the entire American economy. A report by the International Chamber of Commerce (ICC) in Paris surveyed the evidence not only from the United States and Europe but from the developing world as well.[8] Economists who have examined the link between investments in communications and information technology infrastructure and economic growth have consistently found a strong link. Simply put, wireless infrastructure investment enables an entire entrepreneurial culture to focus on creating applications and devices to make businesses more productive and to improve the lives of consumers. These tools in turn make businesses more productive and profitable so that they can create new jobs that generate economic activity and tax revenues for governments.
While most infrastructure investments create these types of multiplier effects, the multiplier effects for telecommunications infrastructure are higher than other industries because communications and information technology are so deeply embedded in business processes. These infrastructure investments also benefit the government and nonprofit sectors in ways that do not necessarily show up directly in economic statistics but nonetheless make these sectors more efficient and enable them to lower the cost of providing government services.
As noted in the ICC report, “Remedying the discriminatory tax treatment of telecom goods and services may reduce tax receipts in the short-term, but the longer-term increase in the use of advanced capability devices, service demand, and network deployment resulting from these tax reductions is likely to counteract this loss of revenue over time.”[9] Policymakers need to weigh the tradeoffs between the short-term revenue benefits of excessive wireless taxes versus the long-term economic impact on the state from reduced infrastructure investment.
Conclusion
Wireless consumers continue to be burdened with excessive taxes, fees, and surcharges in many states and localities across the United States. With state and local governments continuing to face revenue challenges, the wireless industry and its customerscontinue to be at risk as an attractive target for raising new revenues. Excessive taxes on wireless consumers disproportionately impact poorer families and may have ramifications for long-term state economic development and growth. Higher taxes on wireless service, coupled with increased taxes on wireless investments, may lead to slower deployment of wireless network infrastructure, including fourth generation (4G) and fifth generation (5G) wireless broadband technologies – a key element to the future success of Smart Cities.
States should study their existing communications tax structure and consider policies that transition their tax systems from narrowly-based wireless taxes and toward broad-based tax sources that do not distort consumer purchasing decisions and do not slow investment in critical infrastructure like wireless broadband. Florida took a step in the right direction by reducing the Communications Services Tax in 2015, but wireless tax rates there are still well above the sales tax. Reform of communications taxes in states with excessive tax rates would position those states to attract additional wireless infrastructure investments that generate economic growth through the new jobs and revenue growth they produce while helping provide relief to wireless users.
| State | Type of Tax | Rate | Comments | ||||||||||||||||||||||||||||||||||||||||||||||||||||||||||||||||||||||||||||||||||||||||||||||||
| Sources: Methodology: Committee on State Taxation, 50-State Study and Report on Telecommunications Taxation, May 2005. Updated July 2016 by Scott Mackey, KSE Partners LLP, using state statutes and regulations. | |||||||||||||||||||||||||||||||||||||||||||||||||||||||||||||||||||||||||||||||||||||||||||||||||||
| Note: Average Revenue Per Unit (ARPU): $44.65 per Cellular Telephone and Internet Association, July 2016. | |||||||||||||||||||||||||||||||||||||||||||||||||||||||||||||||||||||||||||||||||||||||||||||||||||
| Alabama | |||||||||||||||||||||||||||||||||||||||||||||||||||||||||||||||||||||||||||||||||||||||||||||||||||
| AL Cell Service Tax | 6.00% | Access, interstate and intrastate | |||||||||||||||||||||||||||||||||||||||||||||||||||||||||||||||||||||||||||||||||||||||||||||||||
| E911 | 3.92% | $1.75 per month | |||||||||||||||||||||||||||||||||||||||||||||||||||||||||||||||||||||||||||||||||||||||||||||||||
| TOTAL TRANSACTION TAX | 9.92% | ||||||||||||||||||||||||||||||||||||||||||||||||||||||||||||||||||||||||||||||||||||||||||||||||||
| Alaska | |||||||||||||||||||||||||||||||||||||||||||||||||||||||||||||||||||||||||||||||||||||||||||||||||||
| Local Sales Tax | 2.50% | Avg. of Juneau (5%) & Anchorage (0%) | |||||||||||||||||||||||||||||||||||||||||||||||||||||||||||||||||||||||||||||||||||||||||||||||||
| Local E911 | 3.81% | Anchorage – $1.50; Juneau – $1.90 | |||||||||||||||||||||||||||||||||||||||||||||||||||||||||||||||||||||||||||||||||||||||||||||||||
| State USF | 7.23% | 11.5% times FCC safe harbor | |||||||||||||||||||||||||||||||||||||||||||||||||||||||||||||||||||||||||||||||||||||||||||||||||
| TOTAL TRANSACTION TAX | 13.54% | ||||||||||||||||||||||||||||||||||||||||||||||||||||||||||||||||||||||||||||||||||||||||||||||||||
| Arizona | |||||||||||||||||||||||||||||||||||||||||||||||||||||||||||||||||||||||||||||||||||||||||||||||||||
| State sales (transaction priv.) | 5.60% | intrastate telecommunications service | |||||||||||||||||||||||||||||||||||||||||||||||||||||||||||||||||||||||||||||||||||||||||||||||||
| County sales (transaction priv.) | 0.60% | Phoenix (Maricopa) = 0.7%; Tucson (Pima) = 0.5% | |||||||||||||||||||||||||||||||||||||||||||||||||||||||||||||||||||||||||||||||||||||||||||||||||
| City telecommunications | 5.60% | Avg. Phoenix (4.7%) & Tucson (6.5%) | |||||||||||||||||||||||||||||||||||||||||||||||||||||||||||||||||||||||||||||||||||||||||||||||||
| 911 | 0.45% | $.20 per month | |||||||||||||||||||||||||||||||||||||||||||||||||||||||||||||||||||||||||||||||||||||||||||||||||
| TOTAL TRANSACTION TAX | 12.25% | ||||||||||||||||||||||||||||||||||||||||||||||||||||||||||||||||||||||||||||||||||||||||||||||||||
| Arkansas | |||||||||||||||||||||||||||||||||||||||||||||||||||||||||||||||||||||||||||||||||||||||||||||||||||
| State sales tax | 6.50% | ||||||||||||||||||||||||||||||||||||||||||||||||||||||||||||||||||||||||||||||||||||||||||||||||||
| Local sales taxes | 2.88% | Avg. Little Rock (2.5%) & Fayetteville (3.25%) | |||||||||||||||||||||||||||||||||||||||||||||||||||||||||||||||||||||||||||||||||||||||||||||||||
| State High Cost Fund | 3.77% | 5.5% times FCC safe harbor | |||||||||||||||||||||||||||||||||||||||||||||||||||||||||||||||||||||||||||||||||||||||||||||||||
| Wireless 911 | 1.46% | $.65 / month statewide. | |||||||||||||||||||||||||||||||||||||||||||||||||||||||||||||||||||||||||||||||||||||||||||||||||
| TRS service & TRS equipment | 0.07% | $.04 per line per month | |||||||||||||||||||||||||||||||||||||||||||||||||||||||||||||||||||||||||||||||||||||||||||||||||
| TOTAL TRANSACTION TAX | 14.67% | ||||||||||||||||||||||||||||||||||||||||||||||||||||||||||||||||||||||||||||||||||||||||||||||||||
| California | |||||||||||||||||||||||||||||||||||||||||||||||||||||||||||||||||||||||||||||||||||||||||||||||||||
| Local Utility User Tax | 8.00% | Avg. of LA (9%) and Sacramento (7%) | |||||||||||||||||||||||||||||||||||||||||||||||||||||||||||||||||||||||||||||||||||||||||||||||||
| State 911 | 0.47% | 0.75% times FCC safe harbor | |||||||||||||||||||||||||||||||||||||||||||||||||||||||||||||||||||||||||||||||||||||||||||||||||
| PUC fee | 0.11% | 0.18% times FCC safe harbor | |||||||||||||||||||||||||||||||||||||||||||||||||||||||||||||||||||||||||||||||||||||||||||||||||
| ULTS (lifeline) | 3.46% | 5.5% times FCC safe harbor | |||||||||||||||||||||||||||||||||||||||||||||||||||||||||||||||||||||||||||||||||||||||||||||||||
| Deaf/CRS | 0.31% | 0.5% times FCC safe harbor | |||||||||||||||||||||||||||||||||||||||||||||||||||||||||||||||||||||||||||||||||||||||||||||||||
| High Cost Funds A & B | 0.22% | 0.35% times FCC safe harbor | |||||||||||||||||||||||||||||||||||||||||||||||||||||||||||||||||||||||||||||||||||||||||||||||||
| Teleconnect Fund | 0.68% | 1.08% times FCC safe harbor | |||||||||||||||||||||||||||||||||||||||||||||||||||||||||||||||||||||||||||||||||||||||||||||||||
| CASF – advanced services fund | 0.29% | 0.464% times FCC safe harbor | |||||||||||||||||||||||||||||||||||||||||||||||||||||||||||||||||||||||||||||||||||||||||||||||||
| TOTAL TRANSACTION TAX | 13.55% | ||||||||||||||||||||||||||||||||||||||||||||||||||||||||||||||||||||||||||||||||||||||||||||||||||
| Colorado | |||||||||||||||||||||||||||||||||||||||||||||||||||||||||||||||||||||||||||||||||||||||||||||||||||
| State Sales Tax | 2.90% | access and intrastate | |||||||||||||||||||||||||||||||||||||||||||||||||||||||||||||||||||||||||||||||||||||||||||||||||
| Local Sales Tax — City/County | 4.74% | Avg. of Denver (4.75%) & Colorado Springs (4.73%) | |||||||||||||||||||||||||||||||||||||||||||||||||||||||||||||||||||||||||||||||||||||||||||||||||
| 911 | 1.57% | Denver ($.70) / Colorado Springs ($.70) | |||||||||||||||||||||||||||||||||||||||||||||||||||||||||||||||||||||||||||||||||||||||||||||||||
| USF | 1.64% | 2.6% times FCC safe harbor | |||||||||||||||||||||||||||||||||||||||||||||||||||||||||||||||||||||||||||||||||||||||||||||||||
| TOTAL TRANSACTION TAX | 10.84% | ||||||||||||||||||||||||||||||||||||||||||||||||||||||||||||||||||||||||||||||||||||||||||||||||||
| Connecticut | |||||||||||||||||||||||||||||||||||||||||||||||||||||||||||||||||||||||||||||||||||||||||||||||||||
| State sales tax | 6.35% | Access, interstate and intrastate | |||||||||||||||||||||||||||||||||||||||||||||||||||||||||||||||||||||||||||||||||||||||||||||||||
| 911 | 1.14% | $.51 per line | |||||||||||||||||||||||||||||||||||||||||||||||||||||||||||||||||||||||||||||||||||||||||||||||||
| TOTAL TRANSACTION TAX | 7.49% | ||||||||||||||||||||||||||||||||||||||||||||||||||||||||||||||||||||||||||||||||||||||||||||||||||
| Delaware | |||||||||||||||||||||||||||||||||||||||||||||||||||||||||||||||||||||||||||||||||||||||||||||||||||
| Public Utility Gross Receipts Tax | 5.00% | Access and intrastate | |||||||||||||||||||||||||||||||||||||||||||||||||||||||||||||||||||||||||||||||||||||||||||||||||
| Local 911 tax | 1.34% | $.60 / month | |||||||||||||||||||||||||||||||||||||||||||||||||||||||||||||||||||||||||||||||||||||||||||||||||
| TOTAL TRANSACTION TAX | 6.34% | ||||||||||||||||||||||||||||||||||||||||||||||||||||||||||||||||||||||||||||||||||||||||||||||||||
| District of Columbia | |||||||||||||||||||||||||||||||||||||||||||||||||||||||||||||||||||||||||||||||||||||||||||||||||||
| Telecommunication Privilege Tax | 10.00% | Monthly gross charge; | |||||||||||||||||||||||||||||||||||||||||||||||||||||||||||||||||||||||||||||||||||||||||||||||||
| 911 | 1.70% | $0.76 per month | |||||||||||||||||||||||||||||||||||||||||||||||||||||||||||||||||||||||||||||||||||||||||||||||||
| TOTAL TRANSACTION TAX | 11.70% | ||||||||||||||||||||||||||||||||||||||||||||||||||||||||||||||||||||||||||||||||||||||||||||||||||
| Florida | |||||||||||||||||||||||||||||||||||||||||||||||||||||||||||||||||||||||||||||||||||||||||||||||||||
| State Communications services | 7.44% | Access, interstate and intrastate | |||||||||||||||||||||||||||||||||||||||||||||||||||||||||||||||||||||||||||||||||||||||||||||||||
| Local Communications services | 6.36% | Jacksonville 5.82%; Tallahassee 6.9% | |||||||||||||||||||||||||||||||||||||||||||||||||||||||||||||||||||||||||||||||||||||||||||||||||
| 911 | 0.90% | $.40/month statewide | |||||||||||||||||||||||||||||||||||||||||||||||||||||||||||||||||||||||||||||||||||||||||||||||||
| TOTAL TRANSACTION TAX | 14.70% | ||||||||||||||||||||||||||||||||||||||||||||||||||||||||||||||||||||||||||||||||||||||||||||||||||
| Georgia | |||||||||||||||||||||||||||||||||||||||||||||||||||||||||||||||||||||||||||||||||||||||||||||||||||
| State sales tax | 3.14% | 4% of “access charge” — assume $35 | |||||||||||||||||||||||||||||||||||||||||||||||||||||||||||||||||||||||||||||||||||||||||||||||||
| Local sales tax | 3.14% | Avg. rate Atlanta (4%) & Augusta (4%) | |||||||||||||||||||||||||||||||||||||||||||||||||||||||||||||||||||||||||||||||||||||||||||||||||
| Local 911 | 3.36% | Altanta — $1.50/line; Augusta — $1.50/line | |||||||||||||||||||||||||||||||||||||||||||||||||||||||||||||||||||||||||||||||||||||||||||||||||
| TOTAL TRANSACTION TAX | 9.63% | ||||||||||||||||||||||||||||||||||||||||||||||||||||||||||||||||||||||||||||||||||||||||||||||||||
| Hawaii | |||||||||||||||||||||||||||||||||||||||||||||||||||||||||||||||||||||||||||||||||||||||||||||||||||
| Public service company tax | 4.00% | ||||||||||||||||||||||||||||||||||||||||||||||||||||||||||||||||||||||||||||||||||||||||||||||||||
| Additional county tax | 1.89% | ||||||||||||||||||||||||||||||||||||||||||||||||||||||||||||||||||||||||||||||||||||||||||||||||||
| PUC Fee | 0.31% | 0.5% of intrastate charges | |||||||||||||||||||||||||||||||||||||||||||||||||||||||||||||||||||||||||||||||||||||||||||||||||
| Wireless 911 fee | 1.48% | $.66 per month | |||||||||||||||||||||||||||||||||||||||||||||||||||||||||||||||||||||||||||||||||||||||||||||||||
| TOTAL TRANSACTION TAX | 7.68% | ||||||||||||||||||||||||||||||||||||||||||||||||||||||||||||||||||||||||||||||||||||||||||||||||||
| Idaho | |||||||||||||||||||||||||||||||||||||||||||||||||||||||||||||||||||||||||||||||||||||||||||||||||||
| Telephone service assistance program | 0.02% | Set annually by PUC — currently $.01/mo | |||||||||||||||||||||||||||||||||||||||||||||||||||||||||||||||||||||||||||||||||||||||||||||||||
| Statewide wireless 911 | 2.24% | Boise = $1.00 per month | |||||||||||||||||||||||||||||||||||||||||||||||||||||||||||||||||||||||||||||||||||||||||||||||||
| TOTAL TRANSACTION TAX | 2.26% | ||||||||||||||||||||||||||||||||||||||||||||||||||||||||||||||||||||||||||||||||||||||||||||||||||
| Illinois | |||||||||||||||||||||||||||||||||||||||||||||||||||||||||||||||||||||||||||||||||||||||||||||||||||
| State telecom excise tax | 7.00% | Access, interstate and intrastate | |||||||||||||||||||||||||||||||||||||||||||||||||||||||||||||||||||||||||||||||||||||||||||||||||
| Simplified municipal tax | 5.50% | Avg. of Chicago (7%) & Springfield (4%) | |||||||||||||||||||||||||||||||||||||||||||||||||||||||||||||||||||||||||||||||||||||||||||||||||
| Wireless 911 | 5.34% | Chicago $3.90/mo.; others $.73/mo | |||||||||||||||||||||||||||||||||||||||||||||||||||||||||||||||||||||||||||||||||||||||||||||||||
| TOTAL TRANSACTION TAX | 17.84% | ||||||||||||||||||||||||||||||||||||||||||||||||||||||||||||||||||||||||||||||||||||||||||||||||||
| Indiana | |||||||||||||||||||||||||||||||||||||||||||||||||||||||||||||||||||||||||||||||||||||||||||||||||||
| State sales tax | 7.00% | Access and intrastate | |||||||||||||||||||||||||||||||||||||||||||||||||||||||||||||||||||||||||||||||||||||||||||||||||
| Utility receipts tax | 1.40% | Same base as sales tax | |||||||||||||||||||||||||||||||||||||||||||||||||||||||||||||||||||||||||||||||||||||||||||||||||
| Wireless 911 | 2.24% | $1.00 pre month | |||||||||||||||||||||||||||||||||||||||||||||||||||||||||||||||||||||||||||||||||||||||||||||||||
| State USF | 0.46% | .73% x FCC safe harbor | |||||||||||||||||||||||||||||||||||||||||||||||||||||||||||||||||||||||||||||||||||||||||||||||||
| PUC fee | 0.12% | Statutory max 0.15% | |||||||||||||||||||||||||||||||||||||||||||||||||||||||||||||||||||||||||||||||||||||||||||||||||
| TOTAL TRANSACTION TAX | 11.22% | ||||||||||||||||||||||||||||||||||||||||||||||||||||||||||||||||||||||||||||||||||||||||||||||||||
| Iowa | |||||||||||||||||||||||||||||||||||||||||||||||||||||||||||||||||||||||||||||||||||||||||||||||||||
| State sales tax | 6.00% | ||||||||||||||||||||||||||||||||||||||||||||||||||||||||||||||||||||||||||||||||||||||||||||||||||
| Local option sales taxes | 0.50% | Avg. of Cedar Rapids (1%) & Des Moines (0%) | |||||||||||||||||||||||||||||||||||||||||||||||||||||||||||||||||||||||||||||||||||||||||||||||||
| Wireless 911 | 2.24% | $1.00 per month | |||||||||||||||||||||||||||||||||||||||||||||||||||||||||||||||||||||||||||||||||||||||||||||||||
| Dual Party Relay Service fee | 0.07% | $0.03 per month | |||||||||||||||||||||||||||||||||||||||||||||||||||||||||||||||||||||||||||||||||||||||||||||||||
| TOTAL TRANSACTION TAX | 8.81% | ||||||||||||||||||||||||||||||||||||||||||||||||||||||||||||||||||||||||||||||||||||||||||||||||||
| Kansas | |||||||||||||||||||||||||||||||||||||||||||||||||||||||||||||||||||||||||||||||||||||||||||||||||||
| State sales tax | 6.50% | intrastate & interstate | |||||||||||||||||||||||||||||||||||||||||||||||||||||||||||||||||||||||||||||||||||||||||||||||||
| Local option sales taxes | 1.83% | Avg. of Wichita (1.0%) & Topeka (2.65%) | |||||||||||||||||||||||||||||||||||||||||||||||||||||||||||||||||||||||||||||||||||||||||||||||||
| USF | 4.11% | 6.53% x FCC safe harbor | |||||||||||||||||||||||||||||||||||||||||||||||||||||||||||||||||||||||||||||||||||||||||||||||||
| Wireless 911 | 1.34% | $.60 per month per line | |||||||||||||||||||||||||||||||||||||||||||||||||||||||||||||||||||||||||||||||||||||||||||||||||
| TOTAL TRANSACTION TAX | 13.78% | ||||||||||||||||||||||||||||||||||||||||||||||||||||||||||||||||||||||||||||||||||||||||||||||||||
| Kentucky | |||||||||||||||||||||||||||||||||||||||||||||||||||||||||||||||||||||||||||||||||||||||||||||||||||
| State sales tax | 6.00% | Access, interstate and intrastate | |||||||||||||||||||||||||||||||||||||||||||||||||||||||||||||||||||||||||||||||||||||||||||||||||
| School utility gross receipts | 1.50% | Avg Frankfort (3%) and Lousiville (0%) | |||||||||||||||||||||||||||||||||||||||||||||||||||||||||||||||||||||||||||||||||||||||||||||||||
| Kentucky USF | 0.31% | $.08 per month | |||||||||||||||||||||||||||||||||||||||||||||||||||||||||||||||||||||||||||||||||||||||||||||||||
| Kentucky TAP & TRS | 0.09% | $.04 per month | |||||||||||||||||||||||||||||||||||||||||||||||||||||||||||||||||||||||||||||||||||||||||||||||||
| Wireless 911 | 1.57% | $.70 / month | |||||||||||||||||||||||||||||||||||||||||||||||||||||||||||||||||||||||||||||||||||||||||||||||||
| Communications gross receipts tax | 1.30% | Access, interstate and intrastate | |||||||||||||||||||||||||||||||||||||||||||||||||||||||||||||||||||||||||||||||||||||||||||||||||
| TOTAL TRANSACTION TAX | 10.77% | ||||||||||||||||||||||||||||||||||||||||||||||||||||||||||||||||||||||||||||||||||||||||||||||||||
| Louisiana | |||||||||||||||||||||||||||||||||||||||||||||||||||||||||||||||||||||||||||||||||||||||||||||||||||
| State sales tax | 4.00% | Intrastate rate | |||||||||||||||||||||||||||||||||||||||||||||||||||||||||||||||||||||||||||||||||||||||||||||||||
| Wireless 911 | 1.90% | New Orleans $0.85/mo.; Baton Rouge $.85/mo. | |||||||||||||||||||||||||||||||||||||||||||||||||||||||||||||||||||||||||||||||||||||||||||||||||
| State USF | 2.89% | May vary by carrier | |||||||||||||||||||||||||||||||||||||||||||||||||||||||||||||||||||||||||||||||||||||||||||||||||
| TOTAL TRANSACTION TAX | 8.79% | ||||||||||||||||||||||||||||||||||||||||||||||||||||||||||||||||||||||||||||||||||||||||||||||||||
| Maine | |||||||||||||||||||||||||||||||||||||||||||||||||||||||||||||||||||||||||||||||||||||||||||||||||||
| State service provider tax | 6.00% | intrastate | |||||||||||||||||||||||||||||||||||||||||||||||||||||||||||||||||||||||||||||||||||||||||||||||||
| 911 fee | 1.01% | $.45 per month | |||||||||||||||||||||||||||||||||||||||||||||||||||||||||||||||||||||||||||||||||||||||||||||||||
| Maine USF | 1.26% | 2.0% times FCC safe harbor | |||||||||||||||||||||||||||||||||||||||||||||||||||||||||||||||||||||||||||||||||||||||||||||||||
| MTEAF | 0.44% | 0.7% times FCC safe harbor | |||||||||||||||||||||||||||||||||||||||||||||||||||||||||||||||||||||||||||||||||||||||||||||||||
| TOTAL TRANSACTION TAX | 8.71% | ||||||||||||||||||||||||||||||||||||||||||||||||||||||||||||||||||||||||||||||||||||||||||||||||||
| Maryland | |||||||||||||||||||||||||||||||||||||||||||||||||||||||||||||||||||||||||||||||||||||||||||||||||||
| State sales tax | 6.00% | ||||||||||||||||||||||||||||||||||||||||||||||||||||||||||||||||||||||||||||||||||||||||||||||||||
| Local telecom excise | 4.48% | $4.00 per month in Baltimore; no tax in Annapolis | |||||||||||||||||||||||||||||||||||||||||||||||||||||||||||||||||||||||||||||||||||||||||||||||||
| State 911 | 0.56% | $.25 per month | |||||||||||||||||||||||||||||||||||||||||||||||||||||||||||||||||||||||||||||||||||||||||||||||||
| County 911 | 1.68% | $.75 per month in all counties | |||||||||||||||||||||||||||||||||||||||||||||||||||||||||||||||||||||||||||||||||||||||||||||||||
| State USF | 0.11% | $0.05 per month | |||||||||||||||||||||||||||||||||||||||||||||||||||||||||||||||||||||||||||||||||||||||||||||||||
| TOTAL TRANSACTION TAX | 12.83% | ||||||||||||||||||||||||||||||||||||||||||||||||||||||||||||||||||||||||||||||||||||||||||||||||||
| Massachusetts | |||||||||||||||||||||||||||||||||||||||||||||||||||||||||||||||||||||||||||||||||||||||||||||||||||
| State sales tax | 6.25% | interstate and intrastate | |||||||||||||||||||||||||||||||||||||||||||||||||||||||||||||||||||||||||||||||||||||||||||||||||
| Wireless 911 | 2.24% | $1.00 per month | |||||||||||||||||||||||||||||||||||||||||||||||||||||||||||||||||||||||||||||||||||||||||||||||||
| TOTAL TRANSACTION TAX | 8.49% | ||||||||||||||||||||||||||||||||||||||||||||||||||||||||||||||||||||||||||||||||||||||||||||||||||
| Michigan | |||||||||||||||||||||||||||||||||||||||||||||||||||||||||||||||||||||||||||||||||||||||||||||||||||
| State sales tax | 6.00% | interstate and intrastate | |||||||||||||||||||||||||||||||||||||||||||||||||||||||||||||||||||||||||||||||||||||||||||||||||
| State wireless 911 | 0.43% | $.19 per month | |||||||||||||||||||||||||||||||||||||||||||||||||||||||||||||||||||||||||||||||||||||||||||||||||
| County wireless 911 | 0.94% | Detroit $.42; Lansing $.42 | |||||||||||||||||||||||||||||||||||||||||||||||||||||||||||||||||||||||||||||||||||||||||||||||||
| Intrastate toll assessment | 0.62% | .98% of intrastate charges | |||||||||||||||||||||||||||||||||||||||||||||||||||||||||||||||||||||||||||||||||||||||||||||||||
| TOTAL TRANSACTION TAX | 7.98% | ||||||||||||||||||||||||||||||||||||||||||||||||||||||||||||||||||||||||||||||||||||||||||||||||||
| Minnesota | |||||||||||||||||||||||||||||||||||||||||||||||||||||||||||||||||||||||||||||||||||||||||||||||||||
| State sales tax | 6.88% | Interstate and intrastate | |||||||||||||||||||||||||||||||||||||||||||||||||||||||||||||||||||||||||||||||||||||||||||||||||
| Local sales tax | 0.83% | Minneapolis (0.9%) and St. Paul (0.75%) | |||||||||||||||||||||||||||||||||||||||||||||||||||||||||||||||||||||||||||||||||||||||||||||||||
| 911 | 2.13% | $.95 per month | |||||||||||||||||||||||||||||||||||||||||||||||||||||||||||||||||||||||||||||||||||||||||||||||||
| Telecom access MN fund | 0.16% | Reduced from 8 cents to 7 cents per month 1/1/16 | |||||||||||||||||||||||||||||||||||||||||||||||||||||||||||||||||||||||||||||||||||||||||||||||||
| TOTAL TRANSACTION TAX | 9.98% | ||||||||||||||||||||||||||||||||||||||||||||||||||||||||||||||||||||||||||||||||||||||||||||||||||
| Mississippi | |||||||||||||||||||||||||||||||||||||||||||||||||||||||||||||||||||||||||||||||||||||||||||||||||||
| State sales tax | 7.00% | Access, interstate and intrastate | |||||||||||||||||||||||||||||||||||||||||||||||||||||||||||||||||||||||||||||||||||||||||||||||||
| Wireless 911 | 2.24% | $1.00 per month per line | |||||||||||||||||||||||||||||||||||||||||||||||||||||||||||||||||||||||||||||||||||||||||||||||||
| TOTAL TRANSACTION TAX | 9.24% | ||||||||||||||||||||||||||||||||||||||||||||||||||||||||||||||||||||||||||||||||||||||||||||||||||
| Missouri | |||||||||||||||||||||||||||||||||||||||||||||||||||||||||||||||||||||||||||||||||||||||||||||||||||
| State sales tax | 4.23% | Access and intrastate | |||||||||||||||||||||||||||||||||||||||||||||||||||||||||||||||||||||||||||||||||||||||||||||||||
| Local sales taxes | 4.06% | Avg. Jefferson City (3.5%) & Kansas City (4.625%) | |||||||||||||||||||||||||||||||||||||||||||||||||||||||||||||||||||||||||||||||||||||||||||||||||
| Local business license tax | 6.50% | Jefferson City (7%); Kansas City (6% residential) | |||||||||||||||||||||||||||||||||||||||||||||||||||||||||||||||||||||||||||||||||||||||||||||||||
| TOTAL TRANSACTION TAX | 14.79% | ||||||||||||||||||||||||||||||||||||||||||||||||||||||||||||||||||||||||||||||||||||||||||||||||||
| Montana | |||||||||||||||||||||||||||||||||||||||||||||||||||||||||||||||||||||||||||||||||||||||||||||||||||
| Telecom excise tax | 3.75% | Access, interstate and intrastate | |||||||||||||||||||||||||||||||||||||||||||||||||||||||||||||||||||||||||||||||||||||||||||||||||
| 911 & E911 tax | 2.24% | $1.00 per number per month | |||||||||||||||||||||||||||||||||||||||||||||||||||||||||||||||||||||||||||||||||||||||||||||||||
| TDD tax | 0.22% | $.10 per number per month | |||||||||||||||||||||||||||||||||||||||||||||||||||||||||||||||||||||||||||||||||||||||||||||||||
| TOTAL TRANSACTION TAX | 6.21% | ||||||||||||||||||||||||||||||||||||||||||||||||||||||||||||||||||||||||||||||||||||||||||||||||||
| Nebraska | |||||||||||||||||||||||||||||||||||||||||||||||||||||||||||||||||||||||||||||||||||||||||||||||||||
| State sales tax | 5.50% | Access & intrastate | |||||||||||||||||||||||||||||||||||||||||||||||||||||||||||||||||||||||||||||||||||||||||||||||||
| Local sales tax | 1.63% | Lincoln (1.75%) and Omaha (1.5%) | |||||||||||||||||||||||||||||||||||||||||||||||||||||||||||||||||||||||||||||||||||||||||||||||||
| City business and occupation tax | 6.13% | Avg. of Omaha (6.25%) & Lincoln (6.0%) | |||||||||||||||||||||||||||||||||||||||||||||||||||||||||||||||||||||||||||||||||||||||||||||||||
| State USF | 4.37% | 6.95% times FCC safe harbor | |||||||||||||||||||||||||||||||||||||||||||||||||||||||||||||||||||||||||||||||||||||||||||||||||
| Wireless 911 | 1.01% | $.45 per month | |||||||||||||||||||||||||||||||||||||||||||||||||||||||||||||||||||||||||||||||||||||||||||||||||
| TRS | 0.04% | $.02 per month | |||||||||||||||||||||||||||||||||||||||||||||||||||||||||||||||||||||||||||||||||||||||||||||||||
| TOTAL TRANSACTION TAX | 18.67% | ||||||||||||||||||||||||||||||||||||||||||||||||||||||||||||||||||||||||||||||||||||||||||||||||||
| Nevada | |||||||||||||||||||||||||||||||||||||||||||||||||||||||||||||||||||||||||||||||||||||||||||||||||||
| Local franchise / gross receipts | 1.68% | 5% of first $15 intrastate revenues | |||||||||||||||||||||||||||||||||||||||||||||||||||||||||||||||||||||||||||||||||||||||||||||||||
| Local 911 tax | 0.28% | Washoe County = $.25 / month; Clark County no fee | |||||||||||||||||||||||||||||||||||||||||||||||||||||||||||||||||||||||||||||||||||||||||||||||||
| State deaf relay charge | 0.07% | $.03 per month | |||||||||||||||||||||||||||||||||||||||||||||||||||||||||||||||||||||||||||||||||||||||||||||||||
| Nevada USF | 0.06% | 0.01% times FCC safe harbor | |||||||||||||||||||||||||||||||||||||||||||||||||||||||||||||||||||||||||||||||||||||||||||||||||
| TOTAL TRANSACTION TAX | 2.09% | ||||||||||||||||||||||||||||||||||||||||||||||||||||||||||||||||||||||||||||||||||||||||||||||||||
| New Hampshire | |||||||||||||||||||||||||||||||||||||||||||||||||||||||||||||||||||||||||||||||||||||||||||||||||||
| Communication services tax | 7.00% | Access, interstate and intrastate | |||||||||||||||||||||||||||||||||||||||||||||||||||||||||||||||||||||||||||||||||||||||||||||||||
| 911 tax | 1.68% | $.57 per month | |||||||||||||||||||||||||||||||||||||||||||||||||||||||||||||||||||||||||||||||||||||||||||||||||
| TOTAL TRANSACTION TAX | 8.68% | ||||||||||||||||||||||||||||||||||||||||||||||||||||||||||||||||||||||||||||||||||||||||||||||||||
| New Jersey | |||||||||||||||||||||||||||||||||||||||||||||||||||||||||||||||||||||||||||||||||||||||||||||||||||
| State sales tax | 7.00% | ||||||||||||||||||||||||||||||||||||||||||||||||||||||||||||||||||||||||||||||||||||||||||||||||||
| Wireless 911 | 2.02% | $.90 per month | |||||||||||||||||||||||||||||||||||||||||||||||||||||||||||||||||||||||||||||||||||||||||||||||||
| TOTAL TRANSACTION TAX | 9.02% | ||||||||||||||||||||||||||||||||||||||||||||||||||||||||||||||||||||||||||||||||||||||||||||||||||
| New Mexico | |||||||||||||||||||||||||||||||||||||||||||||||||||||||||||||||||||||||||||||||||||||||||||||||||||
| State gross receipts (sales) tax | 5.13% | 5.125% intrastate; 4.25% interstate | |||||||||||||||||||||||||||||||||||||||||||||||||||||||||||||||||||||||||||||||||||||||||||||||||
| City and county gross receipts tax | 2.69% | Avg. Santa Fe (3.19%) & Albuquerque (2.19%) | |||||||||||||||||||||||||||||||||||||||||||||||||||||||||||||||||||||||||||||||||||||||||||||||||
| Wireless 911 | 1.14% | $.51 per month | |||||||||||||||||||||||||||||||||||||||||||||||||||||||||||||||||||||||||||||||||||||||||||||||||
| TRS surcharge | 0.21% | 0.33% times FCC safe harbor | |||||||||||||||||||||||||||||||||||||||||||||||||||||||||||||||||||||||||||||||||||||||||||||||||
| State USF | 2.17% | 3.45% times FCC safe harbor | |||||||||||||||||||||||||||||||||||||||||||||||||||||||||||||||||||||||||||||||||||||||||||||||||
| TOTAL TRANSACTION TAX | 11.33% | ||||||||||||||||||||||||||||||||||||||||||||||||||||||||||||||||||||||||||||||||||||||||||||||||||
| New York | |||||||||||||||||||||||||||||||||||||||||||||||||||||||||||||||||||||||||||||||||||||||||||||||||||
| State sales tax | 4.00% | Intrastate and monthly access | |||||||||||||||||||||||||||||||||||||||||||||||||||||||||||||||||||||||||||||||||||||||||||||||||
| Local sales taxes | 4.25% | NYC 4.5%; Albany 4% | |||||||||||||||||||||||||||||||||||||||||||||||||||||||||||||||||||||||||||||||||||||||||||||||||
| MCTD sales tax | 0.19% | NYC 0.375%; Albany 0% | |||||||||||||||||||||||||||||||||||||||||||||||||||||||||||||||||||||||||||||||||||||||||||||||||
| State excise tax (186e) | 2.90% | mobile telecom service — includes interstate | |||||||||||||||||||||||||||||||||||||||||||||||||||||||||||||||||||||||||||||||||||||||||||||||||
| MCTD excise/surcharge (186c) | 0.36% | NYC & surrounding counties – .72%; Albany 0% | |||||||||||||||||||||||||||||||||||||||||||||||||||||||||||||||||||||||||||||||||||||||||||||||||
| Local utility gross receipts tax | 1.49% | NYC — 84% of 2.35%; Albany 1% | |||||||||||||||||||||||||||||||||||||||||||||||||||||||||||||||||||||||||||||||||||||||||||||||||
| State wireless 911 | 2.69% | $1.20 per month | |||||||||||||||||||||||||||||||||||||||||||||||||||||||||||||||||||||||||||||||||||||||||||||||||
| Local wireless 911 | 0.67% | $.30 per month — NYC & most counties | |||||||||||||||||||||||||||||||||||||||||||||||||||||||||||||||||||||||||||||||||||||||||||||||||
| School district utility sales tax | 1.50% | Albany 3%; NYC no tax | |||||||||||||||||||||||||||||||||||||||||||||||||||||||||||||||||||||||||||||||||||||||||||||||||
| TOTAL TRANSACTION TAX | 18.04% | ||||||||||||||||||||||||||||||||||||||||||||||||||||||||||||||||||||||||||||||||||||||||||||||||||
| North Carolina | |||||||||||||||||||||||||||||||||||||||||||||||||||||||||||||||||||||||||||||||||||||||||||||||||||
| State sales tax | 7.00% | Access, interstate and intrastate | |||||||||||||||||||||||||||||||||||||||||||||||||||||||||||||||||||||||||||||||||||||||||||||||||
| Wireless 911 | 1.34% | $.60 per month | |||||||||||||||||||||||||||||||||||||||||||||||||||||||||||||||||||||||||||||||||||||||||||||||||
| TRS Charge | 0.22% | $.10 per month | |||||||||||||||||||||||||||||||||||||||||||||||||||||||||||||||||||||||||||||||||||||||||||||||||
| TOTAL TRANSACTION TAX | 8.57% | ||||||||||||||||||||||||||||||||||||||||||||||||||||||||||||||||||||||||||||||||||||||||||||||||||
| North Dakota | |||||||||||||||||||||||||||||||||||||||||||||||||||||||||||||||||||||||||||||||||||||||||||||||||||
| State sales tax | 5.00% | Access and intrastate | |||||||||||||||||||||||||||||||||||||||||||||||||||||||||||||||||||||||||||||||||||||||||||||||||
| Local sales taxes | 2.00% | Avg Fargo (2.5%) & Bismarck (1.5%) | |||||||||||||||||||||||||||||||||||||||||||||||||||||||||||||||||||||||||||||||||||||||||||||||||
| State gross receipts tax | 2.50% | interstate and intrastate | |||||||||||||||||||||||||||||||||||||||||||||||||||||||||||||||||||||||||||||||||||||||||||||||||
| Local 911 tax | 2.80% | $1.00 Bismarck; $1.50 Fargo | |||||||||||||||||||||||||||||||||||||||||||||||||||||||||||||||||||||||||||||||||||||||||||||||||
| TRS | 0.09% | Up to $.11/mo — currently $.04 | |||||||||||||||||||||||||||||||||||||||||||||||||||||||||||||||||||||||||||||||||||||||||||||||||
| TOTAL TRANSACTION TAX | 12.39% | ||||||||||||||||||||||||||||||||||||||||||||||||||||||||||||||||||||||||||||||||||||||||||||||||||
| Ohio | |||||||||||||||||||||||||||||||||||||||||||||||||||||||||||||||||||||||||||||||||||||||||||||||||||
| State sales tax | 5.75% | Access, interstate and intrastate | |||||||||||||||||||||||||||||||||||||||||||||||||||||||||||||||||||||||||||||||||||||||||||||||||
| Local sales taxes | 2.00% | Columbus (1.75%) and Cleveland (2.25%) | |||||||||||||||||||||||||||||||||||||||||||||||||||||||||||||||||||||||||||||||||||||||||||||||||
| Regulatory fee | 0.13% | Intrastate Gross Revenues | |||||||||||||||||||||||||||||||||||||||||||||||||||||||||||||||||||||||||||||||||||||||||||||||||
| State/local wireless 911 | 0.56% | $.25 per month | |||||||||||||||||||||||||||||||||||||||||||||||||||||||||||||||||||||||||||||||||||||||||||||||||
| TOTAL TRANSACTION TAX | 8.44% | ||||||||||||||||||||||||||||||||||||||||||||||||||||||||||||||||||||||||||||||||||||||||||||||||||
| Oklahoma | |||||||||||||||||||||||||||||||||||||||||||||||||||||||||||||||||||||||||||||||||||||||||||||||||||
| State sales tax | 4.50% | Access, interstate and intrastate | |||||||||||||||||||||||||||||||||||||||||||||||||||||||||||||||||||||||||||||||||||||||||||||||||
| Local sales taxes | 3.95% | Avg. of OK City (3.875%) & Tulsa (4.017%) | |||||||||||||||||||||||||||||||||||||||||||||||||||||||||||||||||||||||||||||||||||||||||||||||||
| Local 911 | 1.12% | $.50 per month in OK City and Tulsa | |||||||||||||||||||||||||||||||||||||||||||||||||||||||||||||||||||||||||||||||||||||||||||||||||
| USF | 1.36% | 2.16% times FCC safe harbor | |||||||||||||||||||||||||||||||||||||||||||||||||||||||||||||||||||||||||||||||||||||||||||||||||
| TOTAL TRANSACTION TAX | 10.92% | ||||||||||||||||||||||||||||||||||||||||||||||||||||||||||||||||||||||||||||||||||||||||||||||||||
| Oregon | |||||||||||||||||||||||||||||||||||||||||||||||||||||||||||||||||||||||||||||||||||||||||||||||||||
| Local utililty tax | 0.00% | No tax on wireless in Portland or Salem | |||||||||||||||||||||||||||||||||||||||||||||||||||||||||||||||||||||||||||||||||||||||||||||||||
| 911 tax | 1.68% | $.75 per month | |||||||||||||||||||||||||||||||||||||||||||||||||||||||||||||||||||||||||||||||||||||||||||||||||
| RSPF Surcharge | 0.16% | $0.07 per month | |||||||||||||||||||||||||||||||||||||||||||||||||||||||||||||||||||||||||||||||||||||||||||||||||
| TOTAL TRANSACTION TAX | 1.84% | ||||||||||||||||||||||||||||||||||||||||||||||||||||||||||||||||||||||||||||||||||||||||||||||||||
| Pennsylvania | |||||||||||||||||||||||||||||||||||||||||||||||||||||||||||||||||||||||||||||||||||||||||||||||||||
| State sales tax | 6.00% | Access, interstate and intrastate | |||||||||||||||||||||||||||||||||||||||||||||||||||||||||||||||||||||||||||||||||||||||||||||||||
| State gross receipts tax | 5.00% | Access, interstate and intrastate | |||||||||||||||||||||||||||||||||||||||||||||||||||||||||||||||||||||||||||||||||||||||||||||||||
| Local sales tax | 1.00% | Philadephia 2%; Harrisburg 0% | |||||||||||||||||||||||||||||||||||||||||||||||||||||||||||||||||||||||||||||||||||||||||||||||||
| Statewide wireless 911 | 3.70% | $1.65 per month | |||||||||||||||||||||||||||||||||||||||||||||||||||||||||||||||||||||||||||||||||||||||||||||||||
| TOTAL TRANSACTION TAX | 15.70% | ||||||||||||||||||||||||||||||||||||||||||||||||||||||||||||||||||||||||||||||||||||||||||||||||||
| Puerto Rico | IVU (Sales Tax) | 11.50% | Increased from 7% on 7/1/2015 | ||||||||||||||||||||||||||||||||||||||||||||||||||||||||||||||||||||||||||||||||||||||||||||||||
| 911 fee | 1.12% | $.50 per line | |||||||||||||||||||||||||||||||||||||||||||||||||||||||||||||||||||||||||||||||||||||||||||||||||
| USF | 0.87% | 1.39% times FCC safe harbor | |||||||||||||||||||||||||||||||||||||||||||||||||||||||||||||||||||||||||||||||||||||||||||||||||
| TOTAL TRANSACTION TAX | 13.49% | ||||||||||||||||||||||||||||||||||||||||||||||||||||||||||||||||||||||||||||||||||||||||||||||||||
| Rhode Island | |||||||||||||||||||||||||||||||||||||||||||||||||||||||||||||||||||||||||||||||||||||||||||||||||||
| State sales tax | 7.00% | Access, interstate and intrastate | |||||||||||||||||||||||||||||||||||||||||||||||||||||||||||||||||||||||||||||||||||||||||||||||||
| Gross receipts tax | 5.00% | Access, interstate and intrastate | |||||||||||||||||||||||||||||||||||||||||||||||||||||||||||||||||||||||||||||||||||||||||||||||||
| 911 fee | 2.24% | $1.00 per month | |||||||||||||||||||||||||||||||||||||||||||||||||||||||||||||||||||||||||||||||||||||||||||||||||
| Additional wireless 911 fee | 0.58% | $.26 per month | |||||||||||||||||||||||||||||||||||||||||||||||||||||||||||||||||||||||||||||||||||||||||||||||||
| TOTAL TRANSACTION TAX | 14.82% | ||||||||||||||||||||||||||||||||||||||||||||||||||||||||||||||||||||||||||||||||||||||||||||||||||
| South Carolina | |||||||||||||||||||||||||||||||||||||||||||||||||||||||||||||||||||||||||||||||||||||||||||||||||||
| State sales tax | 6.00% | Access, interstate and intrastate | |||||||||||||||||||||||||||||||||||||||||||||||||||||||||||||||||||||||||||||||||||||||||||||||||
| Local sales tax | 2.25% | Avg. of Charleston (2.5%) and Columbia (2%) | |||||||||||||||||||||||||||||||||||||||||||||||||||||||||||||||||||||||||||||||||||||||||||||||||
| Municipal license tax | 1.00% | Charleston (1.0%) and Columbia (1.0%) | |||||||||||||||||||||||||||||||||||||||||||||||||||||||||||||||||||||||||||||||||||||||||||||||||
| 911 tax | 1.39% | $.62 / month | |||||||||||||||||||||||||||||||||||||||||||||||||||||||||||||||||||||||||||||||||||||||||||||||||
| TOTAL TRANSACTION TAX | 10.64% | ||||||||||||||||||||||||||||||||||||||||||||||||||||||||||||||||||||||||||||||||||||||||||||||||||
| South Dakota | |||||||||||||||||||||||||||||||||||||||||||||||||||||||||||||||||||||||||||||||||||||||||||||||||||
| State sales tax | 4.50% | access, interstate and intrastate | |||||||||||||||||||||||||||||||||||||||||||||||||||||||||||||||||||||||||||||||||||||||||||||||||
| State gross receipts tax | 4.00% | ||||||||||||||||||||||||||||||||||||||||||||||||||||||||||||||||||||||||||||||||||||||||||||||||||
| local option sales tax | 2.00% | Avg. of Pierre (2.0%) and Sioux Falls (2.0%) | |||||||||||||||||||||||||||||||||||||||||||||||||||||||||||||||||||||||||||||||||||||||||||||||||
| 911 excise | 2.80% | $1.25 per month | |||||||||||||||||||||||||||||||||||||||||||||||||||||||||||||||||||||||||||||||||||||||||||||||||
| TRS fee | 0.34% | $.15 per month by statute | |||||||||||||||||||||||||||||||||||||||||||||||||||||||||||||||||||||||||||||||||||||||||||||||||
| PUC fee | 0.08% | .135% of intrastate receipts | |||||||||||||||||||||||||||||||||||||||||||||||||||||||||||||||||||||||||||||||||||||||||||||||||
| TOTAL TRANSACTION TAX | 13.72% | ||||||||||||||||||||||||||||||||||||||||||||||||||||||||||||||||||||||||||||||||||||||||||||||||||
| Tennessee | |||||||||||||||||||||||||||||||||||||||||||||||||||||||||||||||||||||||||||||||||||||||||||||||||||
| State sales tax | 7.00% | Access, interstate and intrastate | |||||||||||||||||||||||||||||||||||||||||||||||||||||||||||||||||||||||||||||||||||||||||||||||||
| Local sales tax | 2.50% | Statewide local rate for intrastate | |||||||||||||||||||||||||||||||||||||||||||||||||||||||||||||||||||||||||||||||||||||||||||||||||
| 911 tax | 2.60% | $1.16 per month | |||||||||||||||||||||||||||||||||||||||||||||||||||||||||||||||||||||||||||||||||||||||||||||||||
| TOTAL TRANSACTION TAX | 12.10% | ||||||||||||||||||||||||||||||||||||||||||||||||||||||||||||||||||||||||||||||||||||||||||||||||||
| Texas | |||||||||||||||||||||||||||||||||||||||||||||||||||||||||||||||||||||||||||||||||||||||||||||||||||
| State sales tax | 6.25% | Access, interstate and intrastate | |||||||||||||||||||||||||||||||||||||||||||||||||||||||||||||||||||||||||||||||||||||||||||||||||
| Local sales tax | 2.00% | Austin (2.0%) & Houston (2.0%) | |||||||||||||||||||||||||||||||||||||||||||||||||||||||||||||||||||||||||||||||||||||||||||||||||
| Wireless 911 tax | 1.12% | $.50 per month per line | |||||||||||||||||||||||||||||||||||||||||||||||||||||||||||||||||||||||||||||||||||||||||||||||||
| Texas USF | 2.08% | 3.3% times FCC safe harbor | |||||||||||||||||||||||||||||||||||||||||||||||||||||||||||||||||||||||||||||||||||||||||||||||||
| 911 Equalization surcharge | 0.13% | $.06 per line | |||||||||||||||||||||||||||||||||||||||||||||||||||||||||||||||||||||||||||||||||||||||||||||||||
| TOTAL TRANSACTION TAX | 11.58% | ||||||||||||||||||||||||||||||||||||||||||||||||||||||||||||||||||||||||||||||||||||||||||||||||||
| Utah | |||||||||||||||||||||||||||||||||||||||||||||||||||||||||||||||||||||||||||||||||||||||||||||||||||
| State sales tax | 4.70% | Access and intrastate | |||||||||||||||||||||||||||||||||||||||||||||||||||||||||||||||||||||||||||||||||||||||||||||||||
| Local sales taxes | 2.15% | Avg. of Salt Lake City (2.15%) and Provo (2.15%) | |||||||||||||||||||||||||||||||||||||||||||||||||||||||||||||||||||||||||||||||||||||||||||||||||
| Local utility wireless | 3.50% | Levied at 3.5% max. in SLC and Provo | |||||||||||||||||||||||||||||||||||||||||||||||||||||||||||||||||||||||||||||||||||||||||||||||||
| Local 911 | 1.37% | $.61/month | |||||||||||||||||||||||||||||||||||||||||||||||||||||||||||||||||||||||||||||||||||||||||||||||||
| State 911 | 0.20% | $.09/month | |||||||||||||||||||||||||||||||||||||||||||||||||||||||||||||||||||||||||||||||||||||||||||||||||
| Dispatch fee | 0.13% | $.06/month | |||||||||||||||||||||||||||||||||||||||||||||||||||||||||||||||||||||||||||||||||||||||||||||||||
| State USF | 0.63% | 1.0% rate times FCC safe harbor | |||||||||||||||||||||||||||||||||||||||||||||||||||||||||||||||||||||||||||||||||||||||||||||||||
| State TRS | 0.04% | $.02 per line | |||||||||||||||||||||||||||||||||||||||||||||||||||||||||||||||||||||||||||||||||||||||||||||||||
| TOTAL TRANSACTION TAX | 12.73% | ||||||||||||||||||||||||||||||||||||||||||||||||||||||||||||||||||||||||||||||||||||||||||||||||||
| Vermont | |||||||||||||||||||||||||||||||||||||||||||||||||||||||||||||||||||||||||||||||||||||||||||||||||||
| State sales tax | 6.00% | Access, interstate and intrastate | |||||||||||||||||||||||||||||||||||||||||||||||||||||||||||||||||||||||||||||||||||||||||||||||||
| Local sales tax | 0.50% | Avg. of Montpelier (0%) and Burlington (1%) | |||||||||||||||||||||||||||||||||||||||||||||||||||||||||||||||||||||||||||||||||||||||||||||||||
| State USF | 2.00% | funds 911 and other programs | |||||||||||||||||||||||||||||||||||||||||||||||||||||||||||||||||||||||||||||||||||||||||||||||||
| TOTAL TRANSACTION TAX | 8.50% | ||||||||||||||||||||||||||||||||||||||||||||||||||||||||||||||||||||||||||||||||||||||||||||||||||
| Virginia | |||||||||||||||||||||||||||||||||||||||||||||||||||||||||||||||||||||||||||||||||||||||||||||||||||
| State communications sales tax | 5.00% | CST | |||||||||||||||||||||||||||||||||||||||||||||||||||||||||||||||||||||||||||||||||||||||||||||||||
| Wireless 911 | 1.68% | $.75 per month | |||||||||||||||||||||||||||||||||||||||||||||||||||||||||||||||||||||||||||||||||||||||||||||||||
| TOTAL TRANSACTION TAX | 6.68% | ||||||||||||||||||||||||||||||||||||||||||||||||||||||||||||||||||||||||||||||||||||||||||||||||||
| Washington | |||||||||||||||||||||||||||||||||||||||||||||||||||||||||||||||||||||||||||||||||||||||||||||||||||
| State sales tax | 6.50% | Access, interstate and intrastate | |||||||||||||||||||||||||||||||||||||||||||||||||||||||||||||||||||||||||||||||||||||||||||||||||
| Local sales taxes | 2.65% | Olympia (2.3%) & Seattle (3.0%) average | |||||||||||||||||||||||||||||||||||||||||||||||||||||||||||||||||||||||||||||||||||||||||||||||||
| B&O / Utility Franchise — local | 7.50% | Olympia (9%) & Seattle (6%) average | |||||||||||||||||||||||||||||||||||||||||||||||||||||||||||||||||||||||||||||||||||||||||||||||||
| 911 — state | 0.56% | $.25 per month | |||||||||||||||||||||||||||||||||||||||||||||||||||||||||||||||||||||||||||||||||||||||||||||||||
| 911 — local | 1.57% | $.70 per month | |||||||||||||||||||||||||||||||||||||||||||||||||||||||||||||||||||||||||||||||||||||||||||||||||
| TOTAL TRANSACTION TAX | 18.78% | ||||||||||||||||||||||||||||||||||||||||||||||||||||||||||||||||||||||||||||||||||||||||||||||||||
| West Virginia | |||||||||||||||||||||||||||||||||||||||||||||||||||||||||||||||||||||||||||||||||||||||||||||||||||
| State sales tax | 0.00% | No sales tax on wireless | |||||||||||||||||||||||||||||||||||||||||||||||||||||||||||||||||||||||||||||||||||||||||||||||||
| Wireless 911 | 6.72% | $3.00 per month | |||||||||||||||||||||||||||||||||||||||||||||||||||||||||||||||||||||||||||||||||||||||||||||||||
| TOTAL TRANSACTION TAX | 6.72% | ||||||||||||||||||||||||||||||||||||||||||||||||||||||||||||||||||||||||||||||||||||||||||||||||||
| Wisconsin | |||||||||||||||||||||||||||||||||||||||||||||||||||||||||||||||||||||||||||||||||||||||||||||||||||
| State sales tax | 5.00% | Access, intrastate and interstate | |||||||||||||||||||||||||||||||||||||||||||||||||||||||||||||||||||||||||||||||||||||||||||||||||
| Local sales tax | 0.55% | Avg. of Milwaukee (0.6%) & Madison (0.5%) | |||||||||||||||||||||||||||||||||||||||||||||||||||||||||||||||||||||||||||||||||||||||||||||||||
| Police and Fire Protection Fee | 1.68% | $.75 per month | |||||||||||||||||||||||||||||||||||||||||||||||||||||||||||||||||||||||||||||||||||||||||||||||||
| State USF | 1.38% | 2.20% times FCC safe harbor | |||||||||||||||||||||||||||||||||||||||||||||||||||||||||||||||||||||||||||||||||||||||||||||||||
| TOTAL TRANSACTION TAX | 8.61% | ||||||||||||||||||||||||||||||||||||||||||||||||||||||||||||||||||||||||||||||||||||||||||||||||||
| Wyoming | |||||||||||||||||||||||||||||||||||||||||||||||||||||||||||||||||||||||||||||||||||||||||||||||||||
| State sales tax | 4.00% | access and intrastate | |||||||||||||||||||||||||||||||||||||||||||||||||||||||||||||||||||||||||||||||||||||||||||||||||
| Local sales tax | 1.50% | Avg. of Cheyenne (2%) and Casper (1%) | |||||||||||||||||||||||||||||||||||||||||||||||||||||||||||||||||||||||||||||||||||||||||||||||||
| TRS | 0.18% | Up to $.25/month — $.08 currently | |||||||||||||||||||||||||||||||||||||||||||||||||||||||||||||||||||||||||||||||||||||||||||||||||
| USF | 0.82% | 1.3% times FCC safe harbor | |||||||||||||||||||||||||||||||||||||||||||||||||||||||||||||||||||||||||||||||||||||||||||||||||
| 911 tax | 1.68% | $.75 per month in Cheyenne and Casper | |||||||||||||||||||||||||||||||||||||||||||||||||||||||||||||||||||||||||||||||||||||||||||||||||
| TOTAL TRANSACTION TAX | 8.18% | ||||||||||||||||||||||||||||||||||||||||||||||||||||||||||||||||||||||||||||||||||||||||||||||||||
| ARPU = $44.65 | |||||||||||||||||||||||||||||||||||||||||||||||||||||||||||||||||||||||||||||||||||||||||||||||||||
| FCC Safe Harbor = 62.9% | |||||||||||||||||||||||||||||||||||||||||||||||||||||||||||||||||||||||||||||||||||||||||||||||||||
[1] “50-State Study and Report on Telecommunications Taxation,” Washington, D.C.: Committee on State Taxation, 1999.
[2] The reduction in the average monthly bill has slightly increased the effective tax rate for fixed rate monthly taxes and fees even though, in many states, these flat rate impositions were not
increased.
[3] For the purposes of this report, the FCC safe harbor percentage is used. This allows for consistent multiyear comparisons of taxes, fees, and surcharges.
[4] Federal Communications Commission, “Seventh Annual Report to Congress on State Collection and Distribution of 911 and Enhanced 911 Fees and Charges For the Period January 1, 2014 to December
31, 2014,” December 31, 2015. Available at https://apps.fcc.gov/edocs_public/attachmatch/DOC-337223A1.pdf
[5] This calculation uses an average monthly bill of $44.65 to estimate the amount of taxes paid in excess of what would be paid if only the average state and local sales tax rate applied to wireless
service. For the Federal USF surcharge, the calculation uses FCC Interstate safe harbor percentage (37.1%) to determine the interstate portion of the average monthly bill subject to the federal surcharge.
[6] Stephen J. Blumberg, Ph.D. and Julian V. Luke, “Wireless Substitution: Early Release of Estimates from the National Health Interview Survey, July – December 2015,” released May 2016, p. 2.
Available at: http://www.cdc.gov/nchs/data/nhis/earlyrelease/wireless201605.pdf
[7] Allan T. Ingraham and J. Gregory Sidak, “Do States Tax Wireless Services Inefficiently? Evidence on the Price Elasticity of Demand,” Virginia Tax Review, Fall 2004, pp. 249-261.
[8] International Chamber of Commerce, “ICC Discussion Paper on the Adverse Effects of Discriminatory Taxes on Telecommunications Service,” (Paris: 26 October 2010). Available at: http://www.iccindiaonline.org/downloads/disscusstion-paper-28-oct.pdf
[9] ICC Discussion Paper, page 2.