Key Findings
- A capital allowanceA capital allowance is the amount of capital investment costs, or money directed towards a company’s long-term growth, a business can deduct each year from its revenue via depreciation. These are also sometimes referred to as depreciation allowances. is the percentage of total investment that a business can recover through the taxA tax is a mandatory payment or charge collected by local, state, and national governments from individuals or businesses to cover the costs of general government services, goods, and activities. code via depreciationDepreciation is a measurement of the “useful life” of a business asset, such as machinery or a factory, to determine the multiyear period over which the cost of that asset can be deducted from taxable income. Instead of allowing businesses to deduct the cost of investments immediately (i.e., full expensing), depreciation requires deductions to be taken over time, reducing their value and disco.
- Estonia and Latvia have the best capital cost recoveryCost recovery refers to how the tax system permits businesses to recover the cost of investments through depreciation or amortization. Depreciation and amortization deductions affect taxable income, effective tax rates, and investment decisions. systems in the Organisation for Economic Co-operation and Development (OECD).
- Canada has adopted temporary full expensingFull expensing allows businesses to immediately deduct the full cost of certain investments in new or improved technology, equipment, or buildings. It alleviates a bias in the tax code and incentivizes companies to invest more, which, in the long run, raises worker productivity, boosts wages, and creates more jobs. for investments in assets like machinery, responding to a similar provision enacted by the United States in the Tax Cut and Jobs Act (TCJA) in 2017.
- The United Kingdom has reintroduced capital allowances for industrial buildings after previously broadening the corporate tax baseThe tax base is the total amount of income, property, assets, consumption, transactions, or other economic activity subject to taxation by a tax authority. A narrow tax base is non-neutral and inefficient. A broad tax base reduces tax administration costs and allows more revenue to be raised at lower rates. to not allow write-offs for investments in buildings.
- Chile has the worst treatment of capital investments in the OECD, with no allowance for intangibles and poor treatment of investments in machinery.
- The European Union’s Common Corporate Tax Base (CCTB) proposal includes relatively poor capital allowances when compared to current provisions of EU member states.
- Several smaller countries have lower corporate income taxA corporate income tax (CIT) is levied by federal and state governments on business profits. Many companies are not subject to the CIT because they are taxed as pass-through businesses, with income reportable under the individual income tax. rates and higher capital allowances, making them more attractive for capital investment.
Introduction
Although sometimes overlooked in discussions about corporate taxation, capital cost recovery plays an important role in defining a business’s tax base and can impact investment decisions—with far-reaching economic consequences. When businesses are not allowed to fully deduct capital expenditures, they spend less on capital, which reduces worker productivity and wages.
Since the 1980s, statutory corporate income tax rates have declined significantly across the world and in OECD countries.[1] However, the average treatment of capital allowances has become worse since then, leading to broader tax bases that offset the benefits of lower statutory rates. This broadening of tax bases is one of the reasons why tax revenues have been growing or stable around the world despite declining statutory rates.[2]
Currently, businesses in the OECD are able to recover an average of 68.6 percent of the cost of capital investments (covering buildings, machinery, and intangibles). Investments in machinery enjoy the best treatment, with an OECD average of 84.3 percent, followed by intangibles (76.6 percent) and buildings (48.9 percent).[3]
Capital cost recovery varies greatly across OECD countries, ranging from 100 percent in Estonia and Latvia to only 41.7 percent in Chile and 56.6 percent in New Zealand. Only few countries have made improvements in their treatment of capital since last year, with the United Kingdom’s reintroduction of capital allowances for buildings and Canada’s adoption of expensing for machinery and accelerated cost recovery for buildings being the most remarkable ones.
The Basics of Depreciation Schedules and Capital Allowances
Businesses determine their profits by subtracting costs (such as wages, raw materials, and equipment) from revenue. However, in most jurisdictions, capital investments are not treated like other regular costs that can be subtracted from revenue in the year of acquisition. Instead, depreciation schedules specify the life span of an asset and determine the number of years over which an asset must be written off. By the end of the depreciation period, the business would have deducted the initial dollar cost of the asset.[4] However, in most cases, depreciation schedules do not consider the time value of money (a normal return plus inflationInflation is when the general price of goods and services increases across the economy, reducing the purchasing power of a currency and the value of certain assets. The same paycheck covers less goods, services, and bills. It is sometimes referred to as a “hidden tax,” as it leaves taxpayers less well-off due to higher costs and “bracket creep,” while increasing the government’s spendin).[5]
For instance, assume a machine costs $1,000 and is subject to a life span of five years. Under straight-line depreciation, a business could deduct $200 every year for five years. However, due to the time value of money, a deduction of $200 in later years is not as valuable in real terms. If inflation is 2.5 percent and a required real return is 5 percent, then at the end of the five-year period, the value of that deduction will be just $149.76 in today’s terms. In total, the business will only be able to deduct $869.87 instead of the full $1,000, just 87 percent of the total. This understates true business costs and inflates taxable profits, which, in turn, increases the cost of capital investment. The effect becomes exaggerated with longer depreciation schedules and higher inflation. A higher cost of capital can lead to a decline in business investment and reductions in the productivity of capital and lower wages.[6]
Capital allowances are expressed as a percentage of the present value cost that businesses can write off over the life of an asset. A 100 percent capital cost recovery rate represents a business’s ability to deduct the full cost of the investment (including a normal return plus inflation) over its life (e.g., through full immediate expensing or neutral cost recovery). The lower the capital allowance, the more a business’s taxable income is inflated and the more its tax bill is overstated, making capital investment more expensive. (See the Appendix for two examples of capital allowance calculations.)
Capital Allowances in the OECD
The treatment of capital allowances varies greatly across OECD countries: While the lowest-ranking country, Chile, allows its businesses to recover only 41.7 percent of its capital investment, this metric is 100 percent in the highest-ranking countries Estonia and Latvia. This wide range is largely due to nations’ vastly different corporate tax structures, depreciation schemes, and incentives designed to prioritize certain asset types over others.
| Country | Weighted Average Rank | Weighted Average Allowance | Machinery Rank | Machinery | Buildings Rank | Buildings | Intangibles Rank | Intangibles |
|---|---|---|---|---|---|---|---|---|
| Note: Calculations assume a fixed inflation rate of 2.5 percent and fixed interest rate of 5 percent to calculate the present discounted values. The average is weighted by the capital stock’s respective share in an economy (machinery: 44 percent, industrial buildings: 41 percent, and intangibles: 15 percent). Lithuania was not part of the 2018 Capital Cost Recovery report as it joined the OECD only in 2018. Averages of this report and the 2018 report are therefore not directly comparable. Source: CBT Tax Database, PwC’s Worldwide Tax Summaries 2018/2019, EY’s Worldwide Corporate Tax Guide 2018, Deloitte’s Tax Guides and Highlights, PFK’s Worldwide Tax Guide 2018-19, authors’ calculations. | ||||||||
| Estonia | 1 | 100.0% | 1 | 100.0% | 1 | 100.0% | 1 | 100.0% |
| Latvia | 1 | 100.0% | 1 | 100.0% | 1 | 100.0% | 1 | 100.0% |
| Lithuania | 3 | 89.5% | 7 | 91.8% | 3 | 83.8% | 3 | 98.0% |
| Slovak Republic | 4 | 78.2% | 11 | 87.4% | 4 | 65.3% | 6 | 87.0% |
| Belgium | 5 | 76.3% | 9 | 88.2% | 5 | 62.2% | 17 | 80.3% |
| Iceland | 6 | 74.7% | 16 | 86.0% | 6 | 60.2% | 16 | 81.2% |
| Switzerland | 7 | 74.1% | 16 | 86.0% | 7 | 55.5% | 5 | 90.5% |
| South Korea | 8 | 74.0% | 6 | 92.2% | 8 | 54.8% | 20 | 73.8% |
| Czech Republic | 9 | 73.3% | 11 | 87.4% | 12 | 54.3% | 13 | 84.1% |
| France | 10 | 73.2% | 19 | 85.8% | 8 | 54.8% | 6 | 87.0% |
| Portugal | 11 | 72.6% | 8 | 88.8% | 8 | 54.8% | 20 | 73.8% |
| Luxembourg | 12 | 70.7% | 15 | 86.4% | 14 | 47.9% | 6 | 87.0% |
| Sweden | 13 | 70.3% | 16 | 86.0% | 14 | 47.9% | 12 | 86.0% |
| Canada | 14 | 68.8% | 1 | 100.0% | 22 | 42.6% | 35 | 49.0% |
| Finland | 15 | 68.7% | 21 | 82.7% | 13 | 51.9% | 20 | 73.8% |
| Denmark | 16 | 68.2% | 21 | 82.7% | 14 | 47.9% | 15 | 81.3% |
| United States | 17 | 67.7% | 1 | 100.0% | 29 | 35.0% | 31 | 63.3% |
| Turkey | 18 | 67.6% | 10 | 87.6% | 14 | 47.9% | 32 | 63.2% |
| Netherlands | 19 | 67.3% | 5 | 96.5% | 30 | 33.8% | 20 | 73.8% |
| Italy | 20 | 66.8% | 29 | 76.0% | 21 | 46.3% | 4 | 96.5% |
| Israel | 21 | 66.1% | 13 | 87.0% | 23 | 39.1% | 18 | 78.7% |
| Mexico | 22 | 66.0% | 32 | 73.8% | 8 | 54.8% | 20 | 73.8% |
| Slovenia | 23 | 65.3% | 13 | 87.0% | 23 | 39.1% | 20 | 73.8% |
| Australia | 24 | 65.3% | 20 | 85.1% | 14 | 47.9% | 33 | 54.8% |
| Greece | 25 | 63.1% | 32 | 73.8% | 14 | 47.9% | 20 | 73.8% |
| Austria | 26 | 62.8% | 24 | 81.3% | 23 | 39.1% | 20 | 73.8% |
| Ireland | 27 | 62.5% | 25 | 78.7% | 14 | 47.9% | 33 | 54.8% |
| Germany | 28 | 61.5% | 32 | 73.8% | 23 | 39.1% | 6 | 87.0% |
| Spain | 29 | 61.3% | 27 | 77.9% | 23 | 39.1% | 20 | 73.8% |
| Norway | 30 | 60.7% | 26 | 78.2% | 28 | 37.4% | 20 | 73.8% |
| Hungary | 31 | 60.3% | 23 | 81.6% | 34 | 27.9% | 6 | 87.0% |
| Poland | 32 | 59.3% | 32 | 73.8% | 30 | 33.8% | 6 | 87.0% |
| United Kingdom | 33 | 57.1% | 30 | 75.9% | 34 | 27.9% | 14 | 82.7% |
| Japan | 34 | 57.0% | 28 | 77.0% | 34 | 27.9% | 18 | 78.7% |
| New Zealand | 35 | 56.6% | 31 | 74.7% | 33 | 31.0% | 20 | 73.8% |
| Chile | 36 | 41.7% | 36 | 63.3% | 30 | 33.8% | 36 | 0.0% |
| OECD Simple Average | 68.6% | 84.3% | 48.9% | 76.6% | ||||
Taxes make more sense with us in your inbox.
Subscribe to our newsletter for tax insights that cut through the noise—and make sense of it.
Sign UpMachinery generally has the best treatment, with an OECD average allowance of 84.3 percent. The United States and Canada are currently above average, at 100 percent, due to temporary bonus depreciations for investments in machinery. Estonia and Latvia also have full cost recovery of machinery due to their cash-flow tax systems. The country with the worst tax treatment of machinery is Chile, with an allowance of only 63.3 percent, followed by Germany, Greece, Mexico, and Poland, each at 73.8 percent.
Investment in industrial buildings has relatively poor tax treatment in the OECD, with an average allowance of only 48.9 percent. Estonia and Latvia have the best treatment of industrial buildings at 100 percent each, again due to their cash-flow tax systems, followed by Lithuania (83.8 percent) and Slovakia (65.3 percent). The countries with the worst capital allowances for industrial buildings are Hungary, Japan, and the United Kingdom, each at 27.9 percent.
The average capital allowance for intangibles is 76.6 percent in OECD countries. Estonia and Latvia have the best treatment of intangible assets at 100 percent, followed by Lithuania (98 percent) and Italy (96.5 percent). Chile has the worst treatment of intangibles as it does not allow for any deductions, followed by Canada (49 percent), Australia (54.8 percent), and Ireland (54.8 percent).
Estonia and Latvia Lead the OECD on Tax Treatment of Capital Assets
Estonia and Latvia have both replaced their traditional corporate income tax systems with a cash-flow tax model, which allows for a capital cost recovery rate of 100 percent. Rather than requiring corporations to calculate their taxable incomeTaxable income is the amount of income subject to tax, after deductions and exemptions. Taxable income differs from—and is less than—gross income. using complex rules and depreciation schedules every single year, the Estonian and Latvian corporate income tax of 20 percent is levied only when a business distributes profits to shareholders.
This not only simplifies the calculation of taxable profit, but it also allows for treatment of capital investment that is equivalent to full expensing. Since distributed profits are the tax base, there is no need for depreciation schedules. Instead, capital costs reduce profits in the year of investment. This treatment of capital investment encourages businesses in Estonia and Latvia to use their profits to reinvest in their firms, leading to new capital formation and increased economic growth.
UK System Punishes Investment in Buildings
The United Kingdom is among the four OECD countries with the lowest recovery of capital investment costs. In the UK, investment costs of machinery are pooled together and depreciation schedules are set at an 18 percent reducing-balance rate.[7] Many businesses are also able to take a deduction of up to ₤200,000 ($266,667) each year for investment in plants and equipment. This annual investment allowance was reduced from ₤500,000 ($666,667) at the end of 2015.[8]
The amortization of intangible assets, such as patent rights, trademarks, and know-how, is deductible for tax (a flat 4% deduction is granted if not amortized in the accounts). However, since July 2015, the amortization of goodwill and customer-related intangibles is not tax deductible.[9]
Between 2012 and 2018, businesses in the UK were not allowed to depreciate nonresidential structures and buildings because capital allowances for this asset category had been set to zero. Only recently, the government has adopted a capital allowance of 2.5 percent for nonresidential structures and buildings calculated on a straight-line basis. This new policy allows businesses to recover 27.9 percent of investment costs in structures and buildings, which has significantly increased the UK weighted average of capital allowances of all three asset categories from 45.7 percent in 2018 to 57.2 percent in 2019.
The reintroduction of capital allowances for buildings has substantially improved the treatment of investments in buildings in the UK. However, the UK is still among the three countries with the lowest depreciation rates for buildings in the OECD, putting UK businesses at a disadvantage.
Canada and the United States Provide Temporary Expensing for Equipment and Machinery
Currently, the United States tax code allows businesses to recover 67.7 percent of capital investment costs on average. This is slightly below the OECD average of 68.6 percent.
The U.S. capital allowance for intangibles is 63.3 percent, lower than the OECD average of 76.6 percent. Cost recovery of nonresidential structures is also low in the U.S., providing an allowance of only 35 percent over their rather long 39-year asset lives, while the OECD average is 48.9 percent.
For machinery, the U.S. currently has a 100 percent capital allowance due to temporary full expensing provided by the Tax Cut and Jobs Act (TCJA). The OECD has an average of 84.3 percent for capital allowances for machinery. Notably, the OECD highlighted the U.S. provision in its 2018 Economic Survey of the United States, pointing out that the policy “will likely give a substantial boost to investment activity.”[10]
Taxes make more sense with us in your inbox.
Subscribe to our newsletter for tax insights that cut through the noise—and make sense of it.
Sign UpAs a response to full expensing for machinery in the U.S., Canada adopted full expensing for equipment and machinery used in the manufacturing and processing of goods, and for clean energy investments.[11] These assets may be fully written off in the year the equipment or machinery is put into use, instead of being depreciated over several years.
Canada also adopted accelerated depreciation schedules for nonresidential buildings.[12] Businesses that invest in buildings used in manufacturing and processing will be able to write off 15 percent of the cost in the first year (up from 5 percent), and first year write-offs for investments in other nonresidential buildings have been increased from 3 percent to 9 percent.
Improved capital cost recovery arrangements are particularly effective if they are implemented on a permanent basis. TCJA provides full expensing only through 2021 and phases it out over the 2022 to 2026 period, and Canada’s enhanced deductions will be in place until 2023, with a gradual phaseout period between 2024 and 2027. Although these reforms will temporarily boost investment activity, long-term effects would be significantly higher if the changes were made permanent parts of both tax systems.[13]
Chile Punishes Investment with Cost Recovery Provisions
Chilean businesses face the lowest capital allowances in the OECD, averaging at 41.7 percent. By asset category, machinery has the highest cost recovery rate at 63.3 percent, followed by buildings at 33.8 percent. Investment in intangible assets cannot be deducted at all, making Chile the only OECD country without capital allowances for intangibles.
These extremely low capital cost recovery rates make capital investment very costly in Chile. Combined with a relatively high statutory corporate income tax rate of 25 percent, Chile’s corporate tax code serves as a significant barrier to business investment, impeding economic growth.
The Czech and Slovakian Systems are Unique Among OECD Countries
While most OECD countries use depreciation schedules based on a straight-line or declining-balance method (or a combination of both), businesses in the Czech Republic and Slovakia depreciate their capital investments with a unique method.
Besides the straight-line method, taxpayers may elect to depreciate assets using a specific accelerated method. Under this method, depreciation for the first year is calculated by dividing the cost of the asset by the number of years reflecting the useful life of an asset. For subsequent years, accelerated depreciation is calculated by multiplying the residual tax value of the asset by two and then dividing it by the remaining years of depreciation plus one year.[14]
Despite this comparably complex calculation of depreciation values, Slovakia ranks fourth (78.2 percent) and the Czech Republic ninth (73.3 percent) in our comparison of capital cost recovery in the OECD, making them attractive places for business investment.
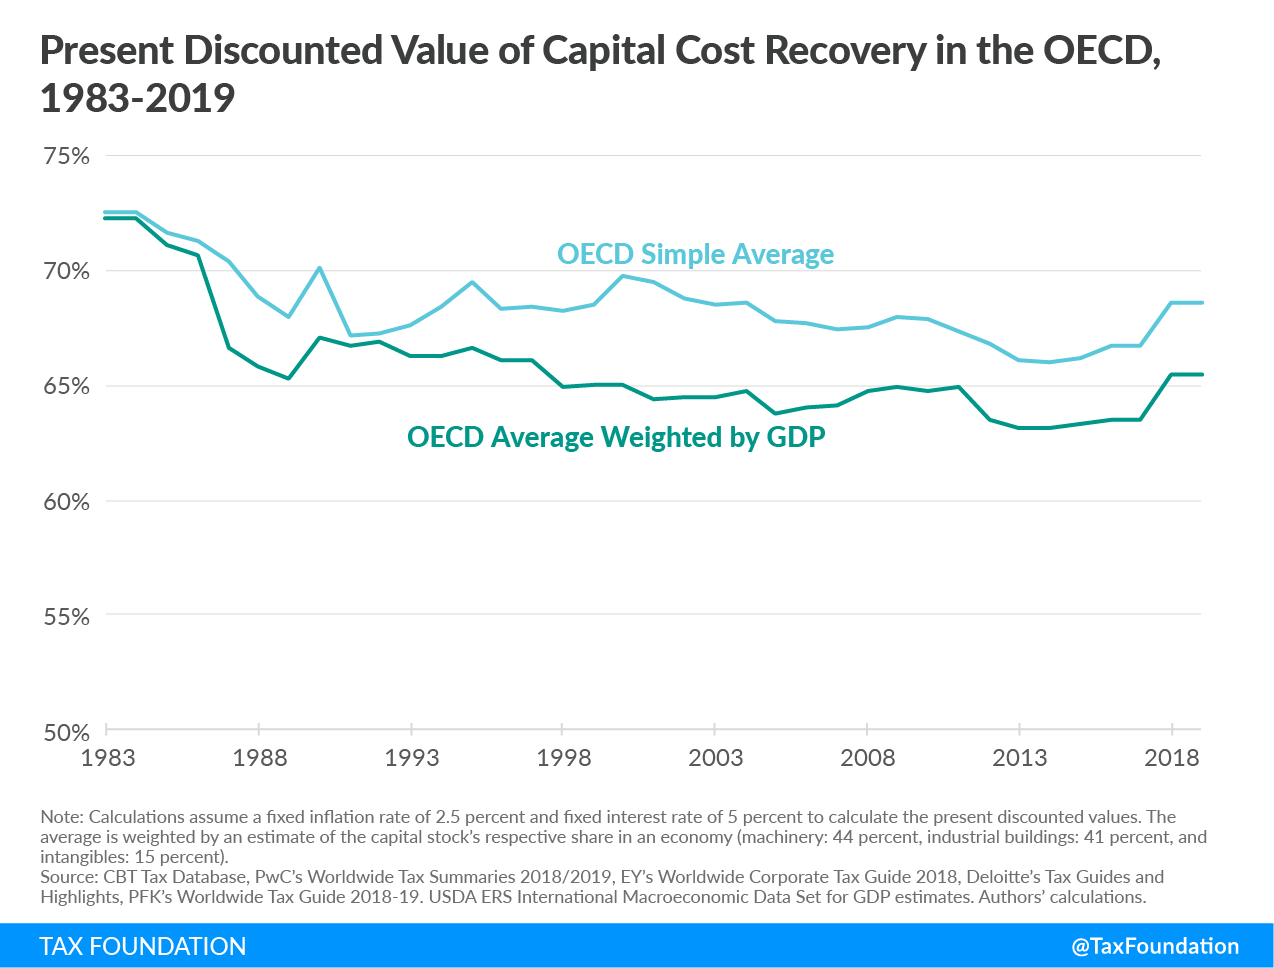
Capital Cost Recovery in the OECD Since 1983
The simple average of OECD capital allowances has decreased since 1983, with a slight increase over the last two years. While OECD countries allowed their businesses to deduct approximately 72.5 percent of their capital investments in 1983, this number has decreased to 68.6 percent in 2019.
Weighted by GDP, the average OECD capital allowance rate has also declined in the last four decades. In 1983, the weighted average net present value of capital allowances was 72.2 percent. Since then, this measure has declined to a current average of 65.4 percent.
As Figure 1 shows, the OECD average of capital cost recovery weighted by each country’s GDP is consistently lower than the simple OECD average. This is because smaller economies tend to have better treatment of capital allowances than larger economies. This is also reflected in our ranking (see Table 1): Estonia, Latvia, Lithuania, Slovakia, and Belgium, all relatively small economies, are the countries with the best treatment of capital assets. In contrast, Chile, New Zealand, Japan, the United Kingdom, and Poland, comparably larger economies, have the lowest recovery rates.
Figure 1.
Capital Allowances and Economic Growth
Lower Capital Allowances Lead to Slower Economic Growth
Any cost recovery system that does not allow the full write-off of an investment—full expensing—in the year the investment is made denies recovery of a part of that investment, inflates the taxable income, and increases the taxes paid by businesses. Lower capital allowances increase the cost of capital, which leads to slower investment and a reduction of the capital stock, reducing productivity, employment, and wages.[15]
Prior research has found that there is evidence that investment is sensitive to changes in the cost of capital. Kevin Hassett and R. Glenn Hubbard in a literature review found “a consensus has emerged [among economists] that investment demand is sensitive to taxation.”[16] In other words, as a result of either longer asset lives or a higher corporate income tax rate, the demand for capital decreases and levels of investment decline,[17] reducing the growth in the capital stock. A reduction in the capital stock leads to lower wages for workers and slower economic growth.[18]
Unequal Capital Allowances Create a Distortion among Different Investments in the Economy
It is also important to note that capital allowances can distort the relative prices of different investments and alter the mix of investment and capital in an economy. A government could lengthen depreciation schedules and reduce capital allowances for machinery, which would slow investment in machinery, harming the manufacturing industry. Likewise, if depreciation schedules are shortened, or if businesses are allowed partial expensing of machinery, this increase in the capital allowance may spur more machinery investment relative to other investment in the country.
In the case where a country is cutting its corporate tax rate while limiting capital allowances could shift the mix of business in the economy from more capital-intensive businesses to sectors that rely on less capital investment. This is the case of the UK, which traded longer asset lives for a lower corporate tax rate and saw business investment suffer.[19] The differential treatment of capital-intensive industry over other sectors will likely contribute to worsening of trends that have revealed significant difference in regional economic output in the UK.[20]
Tax changes in the United States have also changed the composition of investment. In 2003, the United States passed the Jobs and Growth Tax Relief Reconciliation Act of 2003 (JGTRRA). Part of this law allowed for partial expensing of certain capital equipment, increasing capital allowances and reducing the cost of certain capital investments by as much as 15 percent.[21] Research on this change found that “investment increased the most for equipment with a longer recovery period and that ‘bonus depreciationBonus depreciation allows firms to deduct a larger portion of certain “short-lived” investments in new or improved technology, equipment, or buildings in the first year. Allowing businesses to write off more investments partially alleviates a bias in the tax code and incentivizes companies to invest more, which, in the long run, raises worker productivity, boosts wages, and creates more jobs. had a powerful effect on the composition of investment.’”[22] The best way to avoid such distortions is to grant equal treatment to all assets, which is only accomplished through full expensing or neutral cost recovery.
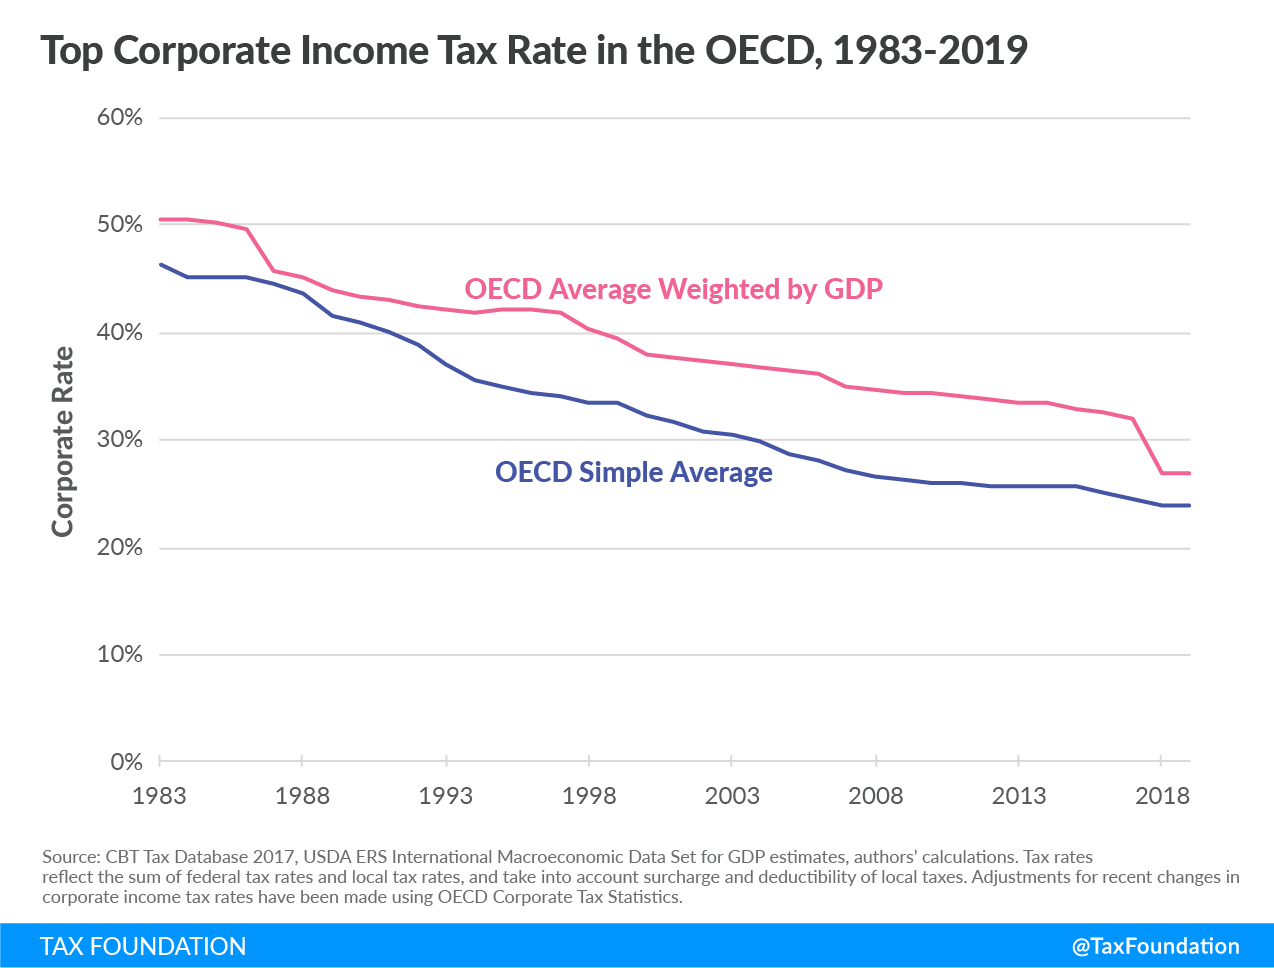
Corporate Tax Rates in the OECD
Corporate Income Tax Rates
More attention is generally paid to the corporate income tax rate rather than the income tax base. A high corporate income tax rate reduces corporations’ after-tax profits, increases the cost of capital, and slows the growth of the capital stock. This leads to lower productivity, lower wages, and slower economic growth.[23]
Figure 2.
Taxes make more sense with us in your inbox.
Subscribe to our newsletter for tax insights that cut through the noise—and make sense of it.
Sign UpIn the past 30 years, countries throughout the OECD have repeatedly reduced their statutory corporate income tax rates, pushing the average rate in OECD countries to approximately 24 percent.[24] The OECD average of corporate income tax rates weighted by each country’s GDP has also decreased since the 1980s, with a significant decline between 2017 and 2018 due to the cut in the U.S. corporate income tax from about 39 percent to 26 percent.[25]
Similar to capital allowances, the OECD average of corporate income tax rates weighted by each country’s GDP is consistently higher than the non-weighted OECD average. This implies that some smaller countries tend to not only have higher capital allowances but also lower corporate income tax rates, making them more competitive than some larger economies.
CCTB and Capital Cost Allowances in EU Countries
In 2016, the European Commission (EC) proposed several directives for reforming corporate taxation for European Union (EU) member states. One of these proposals is the Common Corporate Tax Base (CCTB). The goal of the CCTB directive is to unify definitions of the corporate tax base across the EU. It is part of a general effort to shift some tax policy decisions in the EU to Brussels rather than have them in individual national capitals.
EU member states each currently have veto power over many tax proposals from the EC, and the CCTB has not yet been adopted.
A recent compromise proposal for CCTB was released in December 2018 and provides details for how the tax base would be defined.[26] Among other things, the compromise document provides information on capital cost allowances. Under this compromise proposal for CCTB, businesses would be able to deduct the cost of their assets over their defined useful lives on a straight-line basis. Six specific asset categories and associated lives are defined in the proposal.
The present discounted value of the capital cost allowances can be estimated using similar methods as those used for individual countries. On average across the three general asset categories of buildings, machinery, and intangibles, the net present value of capital allowances under the CCTB compromise is 67.3 percent. This is approximately equal to cost allowances in the Netherlands, lower than in 14 of the current EU member states, and higher than in 11 current EU member states (including the UK).
Figure 3.
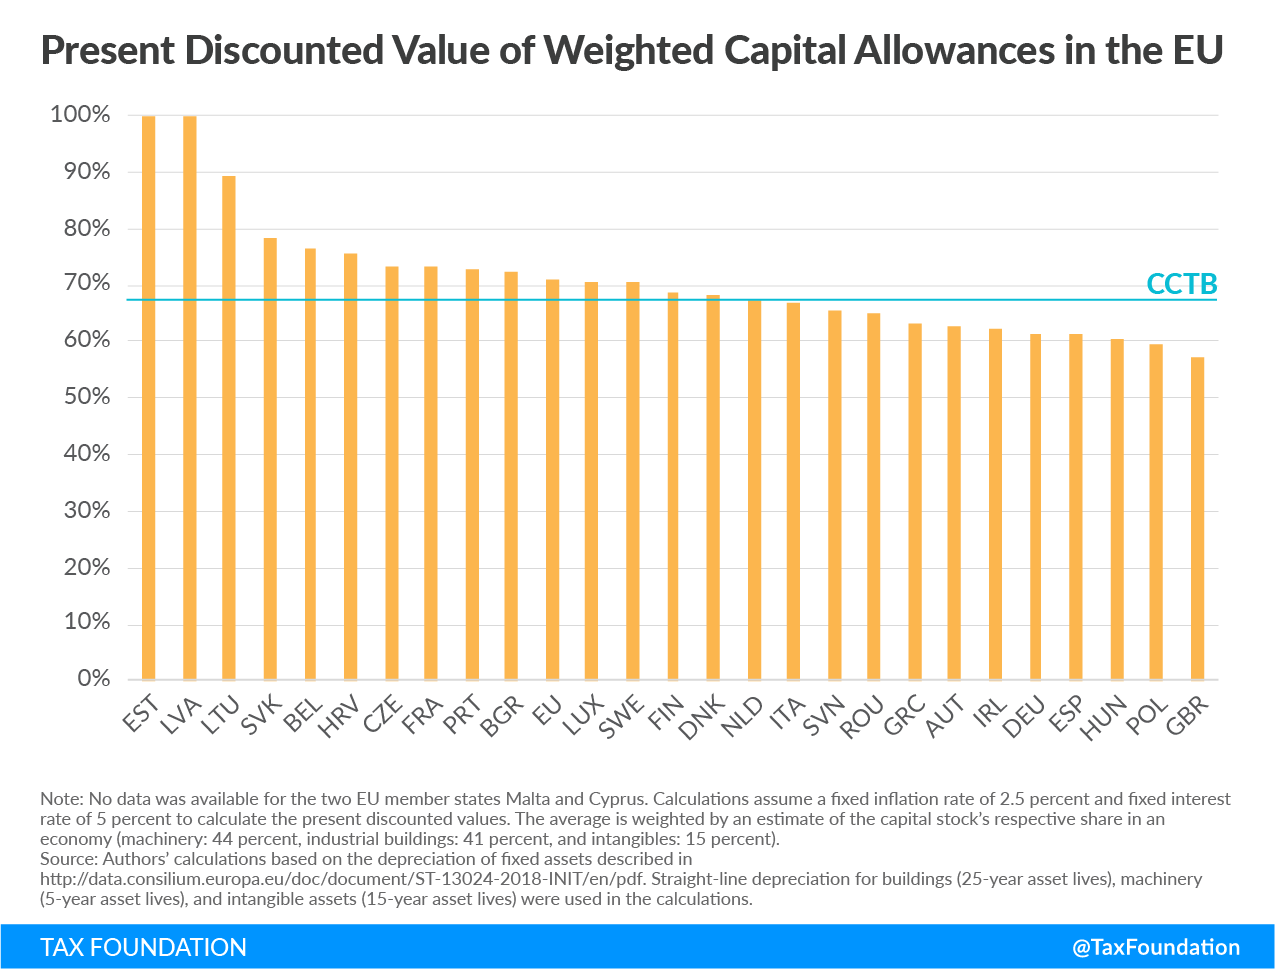
It is clear from this comparison that the CCTB would be less pro-growth than the tax bases of many EU countries, especially some smaller EU member states. Although there are many other facets to the CCTB debate, it is important to note that the EU should pursue a tax base that is pro-growth rather than one that penalizes business investment.
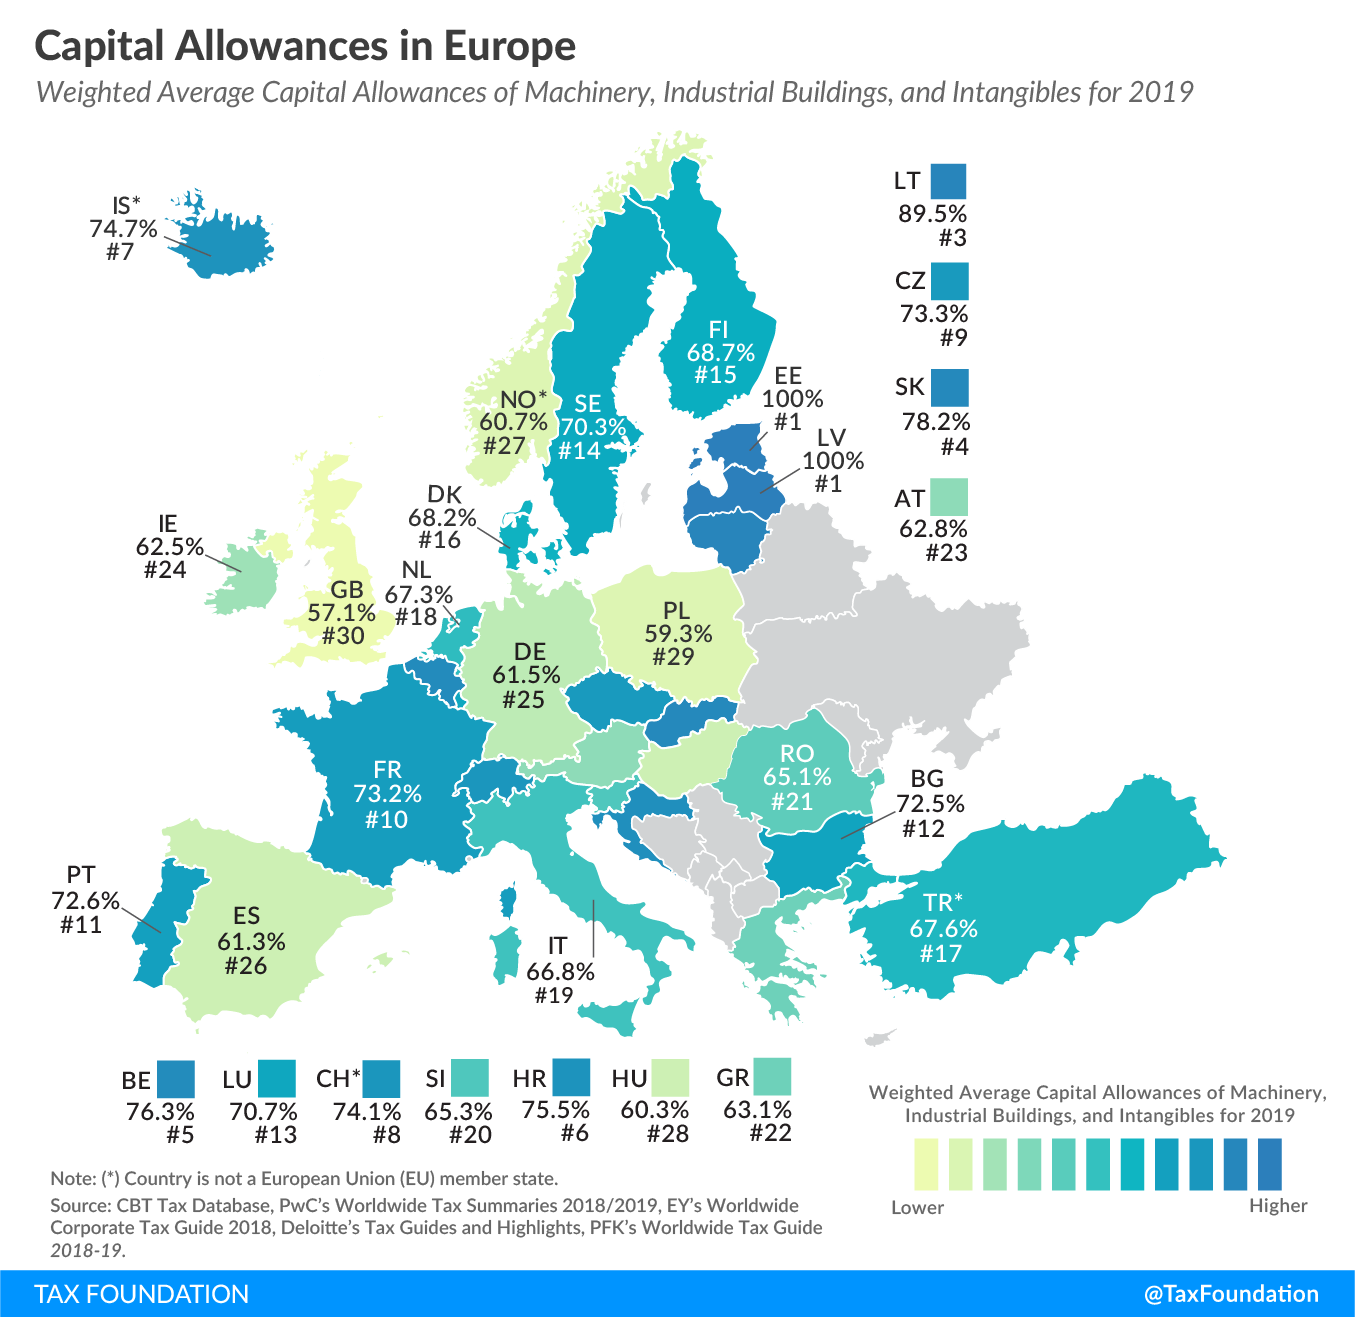
The following map also shows the extent to which businesses can deduct their capital investments varies greatly across European countries, which is higher in many EU member states than the CCTB proposal would put in place.
Conclusion
Although it has been important to reduce the distortionary effects of corporate income taxes by lowering statutory rates around the world, doing so without also considering capital allowances misses an important point of sound tax policy. Low capital cost allowances reduce incentives to invest, leading to lower wages and slower economic growth.
Besides pursuing policies of full expensing for capital investments, it is also important to make capital allowance provisions permanent. Permanency implies certainty, which is an essential factor especially for long-term investment decisions. So, while the new temporary Canadian and U.S. expensing and accelerated depreciation provisions are likely to spur economic growth in the short term, their long-term effects would be much higher if the changes were made permanent. Other individual countries and multinational organizations should also focus on promoting and adopting pro-growth policies that support business investment.
Estonia and Latvia have taken the lead in ensuring their corporate tax codes do not pose a barrier to investment and growth, setting an example for other countries to follow.
Taxes make more sense with us in your inbox.
Subscribe to our newsletter for tax insights that cut through the noise—and make sense of it.
Sign UpAppendix
Calculating Capital Allowances: Declining-Balance Method
| 7-year Declining-Balance Method at 20 percent plus final year. Real discount rate of 5 percent, inflation of 2.5 percent. Source: Authors’ calculations. | |||
| Year | Remaining Value of Fixed Asset | Nominal Write-off | Present Value Write-off |
|---|---|---|---|
| 0 | $ 100.00 | $ 20.00 | $ 20.00 |
| 1 | $ 80.00 | $ 16.00 | $ 14.88 |
| 2 | $ 64.00 | $ 12.80 | $ 11.08 |
| 3 | $ 51.20 | $ 10.24 | $ 8.24 |
| 4 | $ 40.96 | $ 8.19 | $ 6.13 |
| 5 | $ 32.77 | $ 6.55 | $ 4.56 |
| 6 | $ 26.21 | $ 5.24 | $ 3.40 |
| 7 | $ 20.97 | $ 20.97 | $ 12.64 |
| Total Value: | $ 100.00 | $ 80.94 | |
| Total Allowance: | 100% | 80.94% | |
Table 2 illustrates the calculation of a capital allowance using the declining-balance method. Suppose a business made a capital investment of $100 and assume a real discount rate plus inflation that equals 7.5 percent.
Also suppose the government allows investment in machinery to be deducted on a declining balance method of 20 percent for seven years. This means the business can deduct 20 percent of the remaining cost of an investment each year for seven years.
In the initial year, the business can deduct 20 percent ($20) of the initial investment from taxable income. That $20 is subtracted from the initial value of the machine. The next year, the machine has a remaining value of only $80 (the initial $100 minus the 20 percent deduction in the initial year) and, once again, 20 percent, or $16, is deducted from taxable income and subtracted from the value of the machine. In the next year, another 20 percent is deducted from the remaining $64 value of the machine, or $12.80. This method continues until the final year when the remaining $20.97 of the investment is deducted.
Over time, the present value of each year’s write-off declines due to the time value of money. Each subsequent year is reduced by the real discount rate plus inflation, reducing the value of the write-off. Although the nominal value of the entire write-off is $100, the present value is only $80.94. As a result, the company can only recover 80.94 percent of the present value of the cost of the machine by the end of the period.
Calculating Capital Allowances: Straight-Line Method
| 8-year Straight-Line Method at 12.5 percent. Real discount rate of 5 percent, inflation of 2.5 percent. Source: Authors’ calculations. | |||
| Year | Remaining Value of Fixed Asset | Nominal Write-off | Present Value Write-off |
|---|---|---|---|
| 0 | $ 100.00 | $ 12.50 | $ 12.50 |
| 1 | $ 87.50 | $ 12.50 | $ 11.63 |
| 2 | $ 75.00 | $ 12.50 | $ 10.82 |
| 3 | $ 62.50 | $ 12.50 | $ 10.06 |
| 4 | $ 50.00 | $ 12.50 | $ 9.36 |
| 5 | $ 37.50 | $ 12.50 | $ 8.71 |
| 6 | $ 25.00 | $ 12.50 | $ 8.10 |
| 7 | $ 12.50 | $ 12.50 | $ 7.53 |
| Total Value: | $ 100.00 | $ 78.71 | |
| Total Allowance: | 100% | 78.71% | |
Table 3 illustrates the calculation of a capital allowance using the straight-line method. Again, suppose a business made a capital investment of $100 and assume a real discount rate plus inflation that equals 7.5 percent.
In this example, the government allows investment in machinery to be deducted on a declining balance method of 12.5 percent for eight years. This means the business can deduct 12.5 percent of the initial cost of an investment each year for eight years.
Every year, the business can deduct 12.5 percent ($12.50) of the initial investment from taxable income. In the first year, the nominal value equals the present value of the write-off. However, over time, the present value of each year’s write-off declines due to the time value of money.
Although the nominal value of the entire write-off is $100, the present value is only $78.71. As a result, the company can only recover 78.71 percent of the present value of the cost of the machine by the end of the period.
[1] Daniel Bunn, “Corporate Tax Rates Around the World, 2018,” Tax Foundation, Nov. 27, 2018, https://taxfoundation.org/corporate-tax-rates-around-world-2018/.
[2] Daniel Bunn and Elke Asen, “Higher Corporate Tax Revenues Globally Despite Lower Tax Rates,” Tax Foundation, Jan. 22, 2018, https://taxfoundation.org/higher-corporate-tax-revenues-lower-tax-rates/.
[3] Data on capital cost allowances are from multiple sources: Oxford University Centre for Business Taxation, “CBT Tax Database 2017,” http://eureka.sbs.ox.ac.uk/4635/; PwC, “Worldwide Tax Summaries – Corporate Income Tax (CIT) Rates,” http://taxsummaries.pwc.com/ID/Corporate-income-tax-(CIT)-rates; EY, “Worldwide Corporate Tax Guide 2018,“ April 2018, https://www.ey.com/Publication/vwLUAssets/EY-2018-worldwide-corporate-tax-guide/$FILE/EY-2018-worldwide-corporate-tax-guide.pdf; EY, “Worldwide Capital and Fixed Assets Guide,” 2018, https://www.ey.com/gl/en/services/tax/worldwide-capital-and-fixed-assets-guide—country-list; Deloitte, “Tax guides and highlights,” 2018, https://dits.deloitte.com/#TaxGuides; PFK, “International Worldwide Tax Guide 2018-2019,” authors’ calculations.
[4] Stephen J. Entin, “The Tax Treatment of Capital Assets and Its Effect on Growth: Expensing, Depreciation, and the Concept of Cost Recovery in the Tax System,” Tax Foundation, April 24, 2013, https://taxfoundation.org/article-nstax-treatment-capital-assets-and-its-effect-growth-expensing-depreciation-and-concept-cost-recovery/.
[5] This can be thought of as the opportunity cost of tying up the money in a particular investment. See Stephen J. Entin, “The Neutral Cost Recovery System: A Pro-Growth Solution for Capital Cost Recovery,” Tax Foundation, Oct. 29, 2013, https://taxfoundation.org/article/neutral-cost-recovery-system-pro-growth-solution-capital-cost-recovery.
[6] Stephen J. Entin, “The Tax Treatment of Capital Assets and Its Effect on Growth: Expensing, Depreciation, and the Concept of Cost Recovery in the Tax System.”
[7] EY, “Worldwide Capital and Fixed Assets Guide.”
[8] The average 2018 exchange rate provided by the U.S. Internal Revenue Service (IRS) was used for the conversion (USD 1 = GBP 0.750).
[9] EY, “Worldwide Capital and Fixed Assets Guide.”
[10]Nicholas Anderson and Nicole Kaeding, “The OECD Highlights the Economic Growth Benefits of Full Expensing,” Tax Foundation, June 12, 2018, https://taxfoundation.org/oecd-highlights-economic-growth-benefits-full-expensing/.
[11] Stephen J. Entin, “Canada To Adopt Expensing and Accelerated Cost Recovery,“ Tax Foundation, Nov. 28, 2018, https://taxfoundation.org/canada-adopt-expensing-accelerated-cost-recovery/.
[12] Department of Finance Canada, “Investing in Middle Class Jobs,” Fall Economic Statement 2018, https://budget.gc.ca/fes-eea/2018/docs/statement-enonce/fes-eea-2018-eng.pdf.
[13] Kyle Pomerleau, “Economic and Budgetary Impact of Temporary Expensing,” Tax Foundation, Oct. 4, 2017, https://taxfoundation.org/economic-budgetary-impact-temporary-expensing/.
[14] Example: In the first year in the case of plant and machinery with a useful life of six years, depreciation is 16.7% (100/6). The following years, the residual value is multiplied by two and divided by the remaining years of depreciation plus one year; i.e., for the second year: (100-16.7%) x 2 / (6-1+1) = 27.77%.
[15] Stephen J. Entin, “The Tax Treatment of Capital Assets and Its Effect on Growth: Expensing, Depreciation, and the Concept of Cost Recovery in the Tax System.”
[16] Kevin A. Hassett and R. Glenn Hubbard, “Tax Policy and Business Investment,” in Alan J. Auerbach and Martin Feldstein, Handbook of Public Economics Volume 3 (Amsterdam: Elsevier Science, 2002), https://www.sciencedirect.com/science/article/pii/S1573442002800246.
[17] Id.
[18] Stephen J. Entin, “The Tax Treatment of Capital Assets and Its Effect on Growth: Expensing, Depreciation, and the Concept of Cost Recovery in the Tax System,” Tax Foundation.
[19] Kyle Pomerleau, “Trading Longer Asset Lives for Lower Corporate Tax Rates in the United Kingdom,” Tax Foundation, Jan. 29, 2014, https://taxfoundation.org/trading-longer-asset-lives-lower-corporate-tax-rates-united-kingdom/.
[20] Ben Gardiner, Ron Martin, Peter Sunley, and Peter Tyler, “Spatially Unbalanced Growth in the British Economy,” Journal of Economic Geography 13, no. 6 (2013), 889-928.
[21] Kevin A. Hassett and Kathryn Newmark, “Taxation and Business Behavior: A Review of the Recent Literature,” in John W. Diamond and George R. Zodrow (eds.), Fundamental Tax Reform: Issues, Choices, and Implications (Cambridge, MA: MIT Press, 2008), 205.
[22] Id., 206.
[23] William McBride, “What is the Evidence on Taxes and Growth?” Tax Foundation, Dec. 18, 2012, https://taxfoundation.org/article/what-evidence-taxes-and-growth.
[24] Organisation for Economic Co-operation and Development, “OECD Tax Database,” http://www.oecd.org/ctp/tax-policy/tax-database.htm.
[25] Daniel Bunn, “Corporate Tax Rates Around the World, 2018.”
[26] Council of the European Union, “Proposal for a Council Directive on a Common Corporate Tax Base (CCTB)”, Interinstitutional File: 2016/0337, Dec. 5, 2018, http://data.consilium.europa.eu/doc/document/ST-13024-2018-INIT/en/pdf.
Share this article