Key Findings
- A capital allowanceA capital allowance is the amount of capital investment costs, or money directed towards a company’s long-term growth, a business can deduct each year from its revenue via depreciation. These are also sometimes referred to as depreciation allowances. is the percentage of total investment that a business can recover through the taxA tax is a mandatory payment or charge collected by local, state, and national governments from individuals or businesses to cover the costs of general government services, goods, and activities. code via depreciationDepreciation is a measurement of the “useful life” of a business asset, such as machinery or a factory, to determine the multiyear period over which the cost of that asset can be deducted from taxable income. Instead of allowing businesses to deduct the cost of investments immediately (i.e., full expensing), depreciation requires deductions to be taken over time, reducing their value and disco.
- The United States offers the 16th best treatment of capital investment out of the 35 countries in the Organisation for Economic Co-operation and Development (OECD).
- The Tax Cuts and Jobs Act generally improved capital allowances in the United States largely due to 100 percent bonus depreciationBonus depreciation allows firms to deduct a larger portion of certain “short-lived” investments in new or improved technology, equipment, or buildings in the first year. Allowing businesses to write off more investments partially alleviates a bias in the tax code and incentivizes companies to invest more, which, in the long run, raises worker productivity, boosts wages, and creates more jobs. for short-life business investments.
- The unequal treatment of investments in structures and intellectual property will continue to hinder growth in the respective industries.
- One hundred percent expensing for short-life business investments was a great start but needs to be enacted on a permanent basis for it to have an impact on long-term decision-making.
Introduction
Late last year lawmakers passed a significant overhaul to the United States’ tax code, originally introduced in the United States Congress as the Tax Cuts and Jobs Act (TCJA). One of the most prominent legislative changes of the law was the reduction of the federal corporate tax rate from 35 percent to 21 percent, bringing the U.S. more in line with other industrialized countries.
However, the statutory corporate income tax rate was not the only feature of the business tax code that adversely affects the economy. Capital consumption allowances (how much of the cost of a capital investment a business can claim as an expense) directly affect a business’s taxable income and thus affects the amount of tax it pays. When businesses are not allowed to fully deduct capital expenditures, they spend less on capital, which reduces worker productivity and wages.
Currently, the U.S. tax code only allows businesses to recover an average of 67.7 percent of a capital investment (e.g., an investment in buildings, machinery, intangibles, etc.). This is slightly higher than the Organisation for Economic Co-operation and Development’s (OECD) average capital allowance of 67.2 percent. The U.S. capital allowances for intangibles is 63.3 percent, lower than the OECD average of 75.1 percent. For machinery, the U.S. has a capital allowance of 100 percent due to temporary 100 percent bonus depreciation provided by the TCJA, whereas the OECD has a lower average of 83.5 percent. The U.S. is deficient in its treatment of nonresidential structures, providing an allowance of only 35 percent over their rather long 39-year asset lives, while the OECD average is 47 percent.
Since 1979, overall treatment of capital assets has worsened in the U.S., dropping from an average capital allowance of 75.8 percent in the 1980s to an average capital allowance of 67.7 percent in 2018. Capital allowances across the OECD have also declined, but by a lesser extent over the same period: 72.4 percent in the 1980s to 67.2 percent in 2018.
Taxes make more sense with us in your inbox.
Subscribe to our newsletter for tax insights that cut through the noise—and make sense of it.
Sign UpThe Basics of Depreciation Schedules and Capital Allowances
Typically, when a business is calculating its taxable incomeTaxable income is the amount of income subject to tax, after deductions and exemptions. Taxable income differs from—and is less than—gross income. for the Internal Revenue Service (IRS), it takes its revenue and subtracts its costs (such as wages, raw materials, and state and local taxes). However, with capital investments the calculation is much more complicated. Businesses in the U.S. and throughout the world are generally not allowed to immediately deduct the cost of their capital investments. Instead, they are required to write them off over several years or even decades.[1]
Depreciation schedules, which generally attempt to reflect the useful lives of given assets, establish the amounts businesses are allowed to write off, as well as the asset lives of capital investments.[2] For instance, a government may estimate that an asset life of a machine is seven years. Therefore, the business is required to deduct a percent of the cost of that investment over the seven-year period during which it is expected to generate income. Over the life of the machine, they would be able to deduct the total initial dollar cost of the asset. However, due to the time value of money (a normal real return plus inflationInflation is when the general price of goods and services increases across the economy, reducing the purchasing power of a currency and the value of certain assets. The same paycheck covers less goods, services, and bills. It is sometimes referred to as a “hidden tax,” as it leaves taxpayers less well-off due to higher costs and “bracket creep,” while increasing the government’s spendin),[3] write-offs in later years are not as valuable in real terms as write-offs in earlier years. As a result, businesses effectively lose the ability to deduct the full present value of the cost of the investment. This treatment of capital expenses understates true business costs and overstates taxable income in present value terms. This effect becomes exaggerated as the depreciation schedule lengthens and the rate of inflation increases.
A capital allowance is measured as a percent of a total investment that can be recovered through the tax code. A 100 percent capital allowance represents a business’s ability to deduct the full cost of the investment over its life (e.g., through full immediate expensing or neutral cost recoveryCost recovery refers to how the tax system permits businesses to recover the cost of investments through depreciation or amortization. Depreciation and amortization deductions affect taxable income, effective tax rates, and investment decisions.). The lower the capital allowance, the more a business’s taxable income is inflated and the more its tax bill is overstated. (See the Appendix for an example of a calculation of a capital allowance.)
Capital Allowances in the OECD
Overall capital allowances in the OECD range from 41.7 percent to 100 percent. This range is largely due to nations’ vastly different corporate tax structures, depreciation schemes, and tax incentives designed to prioritize certain asset types over others.
Estonia and Latvia Lead the OECD on Tax Treatment of Capital Assets
As of January 1, 2018, Latvia joined Estonia in replacing its traditional corporate income taxA corporate income tax (CIT) is levied by federal and state governments on business profits. Many companies are not subject to the CIT because they are taxed as pass-through businesses, with income reportable under the individual income tax. system with a cash-flow tax model. Under the new model, corporate income taxes are only collected when profits are distributed to shareholders instead of on an annual basis. This change dramatically simplifies the corporate income tax landscape and provides equivalent treatment to full expensing by allowing businesses to delay paying taxes on retained earnings.
The United States’ Treatment of Capital Assets Ranks Slightly Above Average in the OECD
Currently the average net present value of capital allowances[4] in the United States is 67.7 percent (Table 1, below). This means that depreciation schedules in the United States for plants and machinery, industrial buildings, and intangibles, on average, allow the recovery of 67.7 percent of the present value of an investment.
This is slightly higher than the OECD simple average of 67.2 percent.[5] The countries with the best average treatment of capital assets are Estonia (100 percent), Latvia (100 percent), and Slovakia (78.2 percent). Countries with the worst treatment of capital assets are Chile (41.7 percent), the United Kingdom (45.7 percent), and Spain (54.5 percent).[6]
The U.S. has Below-Average Treatment of Industrial Buildings and Intangibles and Slightly Above-Average Treatment of Machinery
While the U.S. ranks slightly above average in its overall treatment of capital assets, its treatment of each different asset type varies. Capital consumption allowances for assets can be broken down into three general categories: machinery, industrial buildings, and intangible assets (patents and “know-how”).[7]
Machinery generally has the best treatment across the OECD, with an average allowance of 83.5 percent. The U.S. is currently above average at 100 percent, due to temporary 100 percent bonus depreciation for short-life business investments provided by the TCJA. The other two countries with the highest capital allowances for machinery are Estonia and Latvia, both at 100 percent due to their adoption of a cash-flow tax model. The country with the worst tax treatment of machinery is Chile with a net present value capital allowance of 63.3 percent.
In contrast to the treatment of machinery, industrial buildings have relatively poor tax treatment across the OECD. The average net present value capital allowance for industrial buildings in non-U.S. OECD countries is 47.0 percent. The U.S. has significantly worse treatment with a net present value of 35 percent. Estonia and Latvia have the best treatment of industrial buildings at 100 percent each, again due to their cash-flow tax model. The countries with the worst capital allowances for industrial buildings are the United Kingdom (0 percent)[8] and Canada (24.2 percent).
The average net present value of intangibles across non-U.S. OECD countries is 75.1 percent. The U.S. is more than 10 percentage points below the average, at 63.3 percent. Estonia and Latvia have the best treatment of intangible assets at 100 percent, followed by Italy (96.5 percent) and Switzerland (90.5 percent). The worst treatment of intangibles is in Chile, which does not allow corporations to deduct the cost of intangible investments, followed by Spain (27.9 percent) and Canada (51.9 percent).
| Source: CBT Tax Database, OECD Statistics, and Author’s Calculations | ||||||||
| Country | Rank | Weighted Average Allowance | Rank | Machines | Rank | Non-residential Buildings | Rank | Intangibles |
|---|---|---|---|---|---|---|---|---|
| Estonia | 1 | 100.0% | 1 | 100.0% | 1 | 100.0% | 1 | 100.0% |
| Latvia | 1 | 100.0% | 1 | 100.0% | 1 | 100.0% | 1 | 100.0% |
| Slovakia | 3 | 78.2% | 10 | 87.4% | 3 | 65.3% | 5 | 87.0% |
| Belgium | 4 | 76.3% | 8 | 88.2% | 4 | 62.2% | 16 | 80.3% |
| Switzerland | 5 | 74.1% | 15 | 86.0% | 5 | 55.5% | 4 | 90.5% |
| Korea, South | 6 | 74.0% | 6 | 92.2% | 6 | 54.8% | 19 | 73.8% |
| Czech Republic | 7 | 73.3% | 10 | 87.4% | 11 | 54.3% | 12 | 84.1% |
| France | 8 | 73.2% | 18 | 85.8% | 6 | 54.8% | 5 | 87.0% |
| Portugal | 9 | 72.6% | 7 | 88.8% | 6 | 54.8% | 19 | 73.8% |
| Israel | 10 | 72.5% | 13 | 87.0% | 6 | 54.8% | 17 | 78.7% |
| Luxembourg | 11 | 71.0% | 12 | 87.1% | 13 | 47.9% | 5 | 87.0% |
| Sweden | 12 | 70.3% | 15 | 86.0% | 13 | 47.9% | 11 | 86.0% |
| Iceland | 13 | 69.6% | 15 | 86.0% | 20 | 47.8% | 15 | 81.2% |
| Finland | 14 | 68.7% | 20 | 82.7% | 12 | 51.9% | 19 | 73.8% |
| Denmark | 15 | 68.2% | 20 | 82.7% | 13 | 47.9% | 14 | 81.3% |
| United States | 16 | 67.7% | 1 | 100.0% | 27 | 35.0% | 29 | 63.3% |
| Turkey | 17 | 67.6% | 9 | 87.6% | 13 | 47.9% | 30 | 63.2% |
| Netherlands | 18 | 67.3% | 4 | 96.5% | 28 | 33.8% | 19 | 73.8% |
| Italy | 19 | 66.8% | 28 | 76.0% | 21 | 46.3% | 3 | 96.5% |
| Mexico | 20 | 66.0% | 30 | 73.8% | 6 | 54.8% | 19 | 73.8% |
| Slovenia | 21 | 65.3% | 13 | 87.0% | 22 | 39.1% | 19 | 73.8% |
| Australia | 22 | 65.3% | 19 | 85.1% | 13 | 47.9% | 31 | 54.8% |
| Greece | 23 | 63.1% | 30 | 73.8% | 13 | 47.9% | 19 | 73.8% |
| Austria | 24 | 62.8% | 23 | 81.3% | 22 | 39.1% | 19 | 73.8% |
| Ireland | 25 | 62.5% | 24 | 78.7% | 13 | 47.9% | 31 | 54.8% |
| Germany | 26 | 61.5% | 30 | 73.8% | 22 | 39.1% | 5 | 87.0% |
| Norway | 27 | 60.7% | 25 | 78.2% | 26 | 37.4% | 19 | 73.8% |
| Hungary | 28 | 60.3% | 22 | 81.6% | 32 | 27.9% | 5 | 87.0% |
| Canada | 29 | 60.1% | 4 | 96.5% | 34 | 24.2% | 33 | 51.9% |
| Poland | 30 | 59.3% | 30 | 73.8% | 28 | 33.8% | 5 | 87.0% |
| Japan | 31 | 57.0% | 27 | 77.0% | 32 | 27.9% | 17 | 78.7% |
| New Zealand | 32 | 55.8% | 34 | 73.2% | 31 | 30.7% | 19 | 73.8% |
| Spain | 33 | 54.5% | 26 | 77.9% | 22 | 39.1% | 34 | 27.9% |
| United Kingdom | 34 | 45.7% | 29 | 75.9% | 35 | 0.0% | 13 | 82.7% |
| Chile | 35 | 41.7% | 35 | 63.3% | 28 | 33.8% | 35 | 0.0% |
| Non-US OECD Simple Average | N/A | 67.2% | N/A | 83.5% | N/A | 47.0% | N/A | 75.1% |
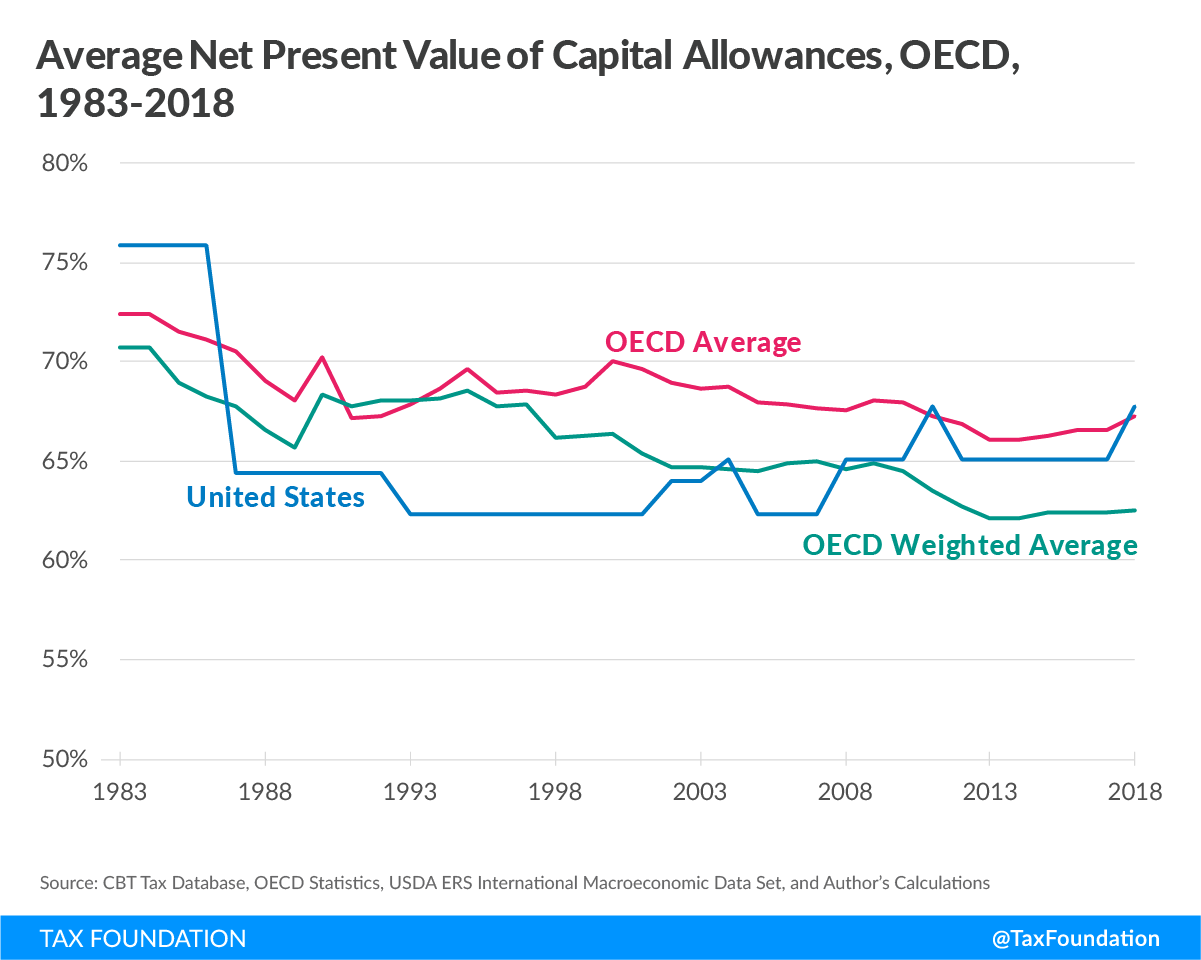
Both U.S. and OECD Capital Allowances Have Followed the Same Downward Trend
Although once competitive, the net present value of capital allowances in the U.S. has generally been below the OECD average since 1987.[9] Under the Accelerated Cost Recovery System (ACRS) in the early 1980s, the average capital allowance in the U.S. was 75.8 percent (Figure 1). As part of the Tax Reform Act of 1986, the U.S. changed to the Modified Accelerated Cost Recovery System (MACRS), which significantly lengthened the asset lives of industrial buildings from around 13 years to 31.5 years, lowering the overall value of capital allowances in the U.S. to around 64.4 percent. The average net present value of capital allowances declined again to 62.3 percent in 1993 when asset lives of buildings increased to their current length of 39 years.
The value of capital allowances across the OECD (excluding the U.S.) has also declined, but by a lesser degree. In 1983, the average net present value of capital allowances in the OECD was 72.5 percent. Later in the 1980s, the average declined to around 70 percent. Since then, it has declined slightly to an average of 67.2 percent.
Figure 1.
Taxes make more sense with us in your inbox.
Subscribe to our newsletter for tax insights that cut through the noise—and make sense of it.
Sign UpCapital Allowances and Economic Growth
Lower Capital Allowances Lead to Slower Economic Growth
Any cost recovery system that does not allow the full write-off of an investment – full expensingFull expensing allows businesses to immediately deduct the full cost of certain investments in new or improved technology, equipment, or buildings. It alleviates a bias in the tax code and incentivizes companies to invest more, which, in the long run, raises worker productivity, boosts wages, and creates more jobs. – in the year the investment is made denies recovery of a part of that investment, incorrectly defines income, boosts the taxable income, and increases the taxes paid by businesses. Lower capital allowances increase the cost of capital, which leads to slower investment and a reduction of the capital stock, reducing productivity, employment, and wages.[10]
Prior research has found that there is evidence that investment is sensitive to changes in the cost of capital. Kevin Hassett and R. Glenn Hubbard in a literature review found “a consensus has emerged [among economists] that investment demand is sensitive to taxation.”[11] In other words, as a result of either longer asset lives or a higher corporate income tax rate, the demand for capital decreases and levels of investment decline,[12] reducing the growth in the capital stock. A reduction in the capital stock leads to lower wages for workers and slower economic growth.[13]
Unequal Capital Allowances Create a Distortion among Different Investments in the Economy
It is also important to note that capital allowances can distort the relative prices of different investment and alter the mix of investment and capital in the economy. A government could lengthen depreciation schedules and reduce capital allowances for machinery, which would slow investment in machinery, harming the manufacturing industry. Likewise, if depreciation schedules are shortened, or if businesses are allowed partial expensing of machinery, this increase in the capital allowance may spur more machinery investment relative to other investment in the country.
Recent tax changes in the United States have changed the composition of investment. In 2003, the United States passed the Jobs and Growth Tax Relief Reconciliation Act of 2003 (JGTRRA). Part of this law allowed for partial expensing of certain capital equipment, increasing capital allowances and reducing the cost of certain capital investments by as much as 15 percent.[14] Research on this change found that “investment increased the most for equipment with a longer recovery period and that ‘bonus depreciation had a powerful effect on the composition of investment.’”[15] The best way to avoid such distortions is to grant equal treatment to all assets, which is only accomplished through full expensing.
Corporate Taxation in the OECD
More attention is paid to the corporate income tax rate rather than the income tax baseThe tax base is the total amount of income, property, assets, consumption, transactions, or other economic activity subject to taxation by a tax authority. A narrow tax base is non-neutral and inefficient. A broad tax base reduces tax administration costs and allows more revenue to be raised at lower rates.. A high corporate income tax reduces corporations’ after-tax profits, increases the cost of capital, and slows the growth of the capital stock. This leads to lower productivity, lower wages, and slower economic growth.[16]
Figure 2.
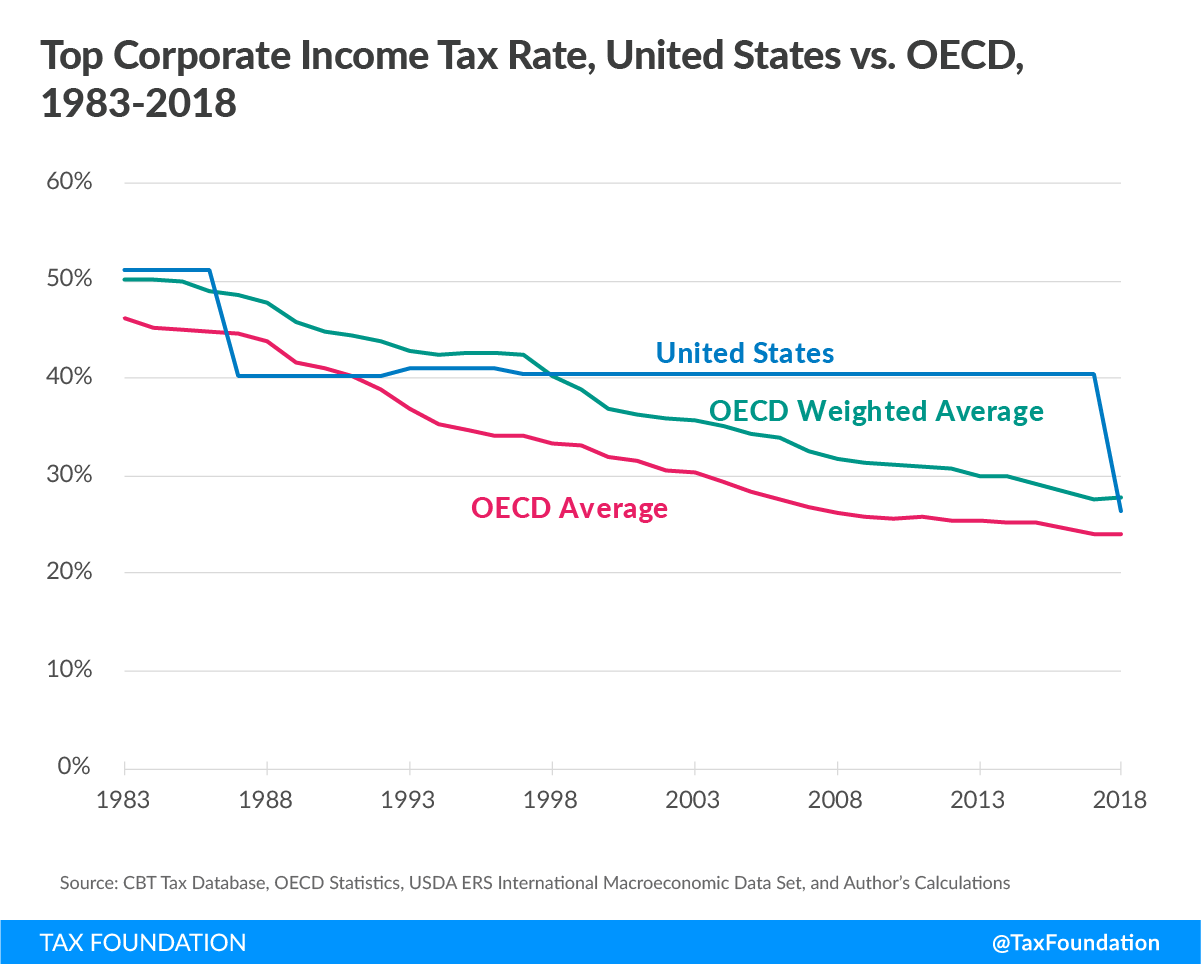
In the past 30 years, countries throughout the OECD have repeatedly reduced their corporate income tax rates, pushing the simple average of non-U.S. OECD nations to approximately 24 percent (Figure 2, above).[17] Additionally, lawmakers in the United States have since brought down the combined federal, state, and local rate to about 26 percent as of January 1st, 2018, from about 39 percent.
Conclusion
Prior to the enactment of the TCJA, the U.S. had not only the highest corporate tax rate among industrialized nations, but also one of the worst capital allowance systems. Post-TCJA, the U.S. has a much more competitive corporate tax rate but still has a capital allowance system that is less competitive than it was in the 1980s.
Although it has been important to lower the corporate income tax rate to make the U.S. more competitive internationally, doing so without also seriously considering our capital allowances misses an important aspect to corporate tax reform. While lawmakers avoided lengthening assets lives to “pay for” a lower corporate tax rate, they have yet to provide equal capital allowances for different asset types. One hundred percent bonus expensing is optimal for machinery, but it is not available for some assets with much longer asset lives, such as structures. This violation of tax neutrality will inevitably incentivize investment in machinery over structures and intellectual property, leading to an inefficient allocation of resources. Additionally, lawmakers only enacted 100 percent bonus depreciation on a temporary basis, scheduled to begin phasing out after December 31st, 2022, which severely reduces its impact on long-term economic growth.
To ensure that the tax code doesn’t serve as a barrier to investment and growth, lawmakers should strive to provide equally beneficial capital allowances to structures and intellectual property, and to do so on a permanent basis.
Taxes make more sense with us in your inbox.
Subscribe to our newsletter for tax insights that cut through the noise—and make sense of it.
Sign UpAppendix
Calculating a Capital Consumption Allowance
| Year | Remaining Value of Fixed Asset | Nominal Write-off | Present Value Write-off |
|---|---|---|---|
| 7-year Declining Balance Method at 20 percent. Real discount rate of 5 percent, inflation of 2.5 percent Source: Author’s calculations |
|||
| 0 | $100.00 | $20.00 | $20.00 |
| 1 | $80.00 | $16.00 | $14.88 |
| 2 | $64.00 | $12.80 | $11.08 |
| 3 | $51.20 | $10.24 | $8.24 |
| 4 | $40.96 | $8.19 | $6.14 |
| 5 | $32.77 | $6.55 | $4.57 |
| 6 | $26.21 | $5.24 | $3.40 |
| 7 | $20.97 | $20.97 | $12.64 |
| Total Value: | $100.00 | $80.94 | |
| Total Allowance: | 100.00% | 80.94% | |
Table 2 illustrates the calculation of a capital allowance. Suppose a business made a capital investment of $100 and assume a real discount rate plus inflation that equals 7.5 percent.
Also suppose the government allows investment in machinery to be deducted on a declining balance method of 20 percent for seven years. This means the business is able to deduct 20 percent of the remaining cost of an investment each year for seven years.
In the initial year, the business can deduct 20 percent ($20) of the initial investment from taxable income. That $20 is subtracted from the initial value of the machine. The next year, the machine has a remaining value of only $80 (the initial $100 minus the 20 percent deduction in the initial year) and, once again, 20 percent, or $16, is deducted from taxable income and subtracted from the value of the machine. In the next year, another 20 percent is deducted from the remaining $64 value of the machine, or $12.80. This method continues until the final year when the remaining $20.97 of the investment is deducted.
Over time, the present value of each year’s write-off declines due to the time value of money. Each subsequent year is reduced by the real discount rate plus inflation, reducing the value of the write-off. Although the nominal value of the entire write-off is $100, the present value is only $80.94. As a result, the company can only recover 80.94 percent of the up-front present value of the cost of the machine by the end of the period.
[1] Stephen J. Entin, “The Tax Treatment of Capital Assets and Its Effect on Growth: Expensing, Depreciation, and the Concept of Cost Recovery in the Tax System,” Tax Foundation, April 24, 2013, https://taxfoundation.org/article-nstax-treatment-capital-assets-and-its-effect-growth-expensing-depreciation-and-concept-cost-recovery/.
[2] Id.
[3] This can be thought of as the opportunity cost of tying up the money in a particular investment. See Steve Entin, “The Neutral Cost Recovery System: A Pro-Growth Solution for Capital Cost Recovery,” Tax Foundation, October 27, 2013, https://taxfoundation.org/article/neutral-cost-recovery-system-pro-growth-solution-capital-cost-recovery.
[4] The average of the net present value of capital allowances for machinery, industrial buildings, and intangibles weighted by their respective share of capital stock.
[5] Average excludes the United States.
[6] Calculations of the present discounted value of capital allowances were based on data from the Oxford University Centre for Business Taxation Tax Database (CBT Tax Database), available at https://www.sbs.ox.ac.uk/faculty-research/tax/publications/data. The average weighted capital allowance is the average present discounted value (as a percent) of capital allowances for machines, industrial buildings, and intangibles weighted by their share in the capital stock. The OECD average is the weighted average capital allowance of all OECD countries (excluding the U.S.) averaged together and weighted by GDP.
[7] For more information on how each asset’s depreciation schedule is accounted for in the CBT Tax Database, see Oxford University Centre for Business Taxation, “CBT Tax Database: Data Description,” January 2017, https://www.sbs.ox.ac.uk/sites/default/files/Business_Taxation/Docs/Publications/Data/tax-data-description-17.doc.
[8] From 2008 to 2012, the United Kingdom began to phase out the capital allowance for industrial buildings. As of 2012, there is no longer a write-off.
[9] Calculations assume a fixed inflation rate of 2.5 percent and fixed interest rate of 5 percent in order to measure the differences in policy from year to year.
[10] See Entin, “The Tax Treatment of Capital Assets and Its Effect on Growth: Expensing, Depreciation, and the Concept of Cost Recovery in the Tax System,” Tax Foundation.
[11] Kevin A. Hassett and R. Glenn Hubbard, “Tax Policy and Business Investment,” in the Handbook of Public Economics (2002), https://www.sciencedirect.com/science/article/pii/S1573442002800246.
[12] Id.
[13] See Entin, “The Tax Treatment of Capital Assets and Its Effect on Growth: Expensing, Depreciation, and the Concept of Cost Recovery in the Tax System,” Tax Foundation.
[14] Kevin A. Hassett and Kathryn Newmark, “Taxation and Business Behavior: A Review of the Recent Literature,” in Fundamental Tax Reform: Issues, Choices, and Implications, John W. Diamond and George R. Zodrow, eds. (Cambridge, MA: MIT Press, 2008), 205.
[15] Id. at 206.
[16] William McBride, “What is the Evidence on Taxes and Growth?” Tax Foundation, December 18, 2012, https://taxfoundation.org/article/what-evidence-taxes-and-growth.
[17] Organisation for Economic Co-operation and Development, “OECD Tax Database,” http://www.oecd.org/ctp/tax-policy/tax-database.htm.
Share this article