Key Findings
- Average workers in the United States face two major taxes on wage income: the individual income taxAn individual income tax (or personal income tax) is levied on the wages, salaries, investments, or other forms of income an individual or household earns. The U.S. imposes a progressive income tax where rates increase with income. The Federal Income Tax was established in 1913 with the ratification of the 16th Amendment. Though barely 100 years old, individual income taxes are the largest source of tax revenue in the U.S. and the payroll tax (levied on both the employee and the employer).
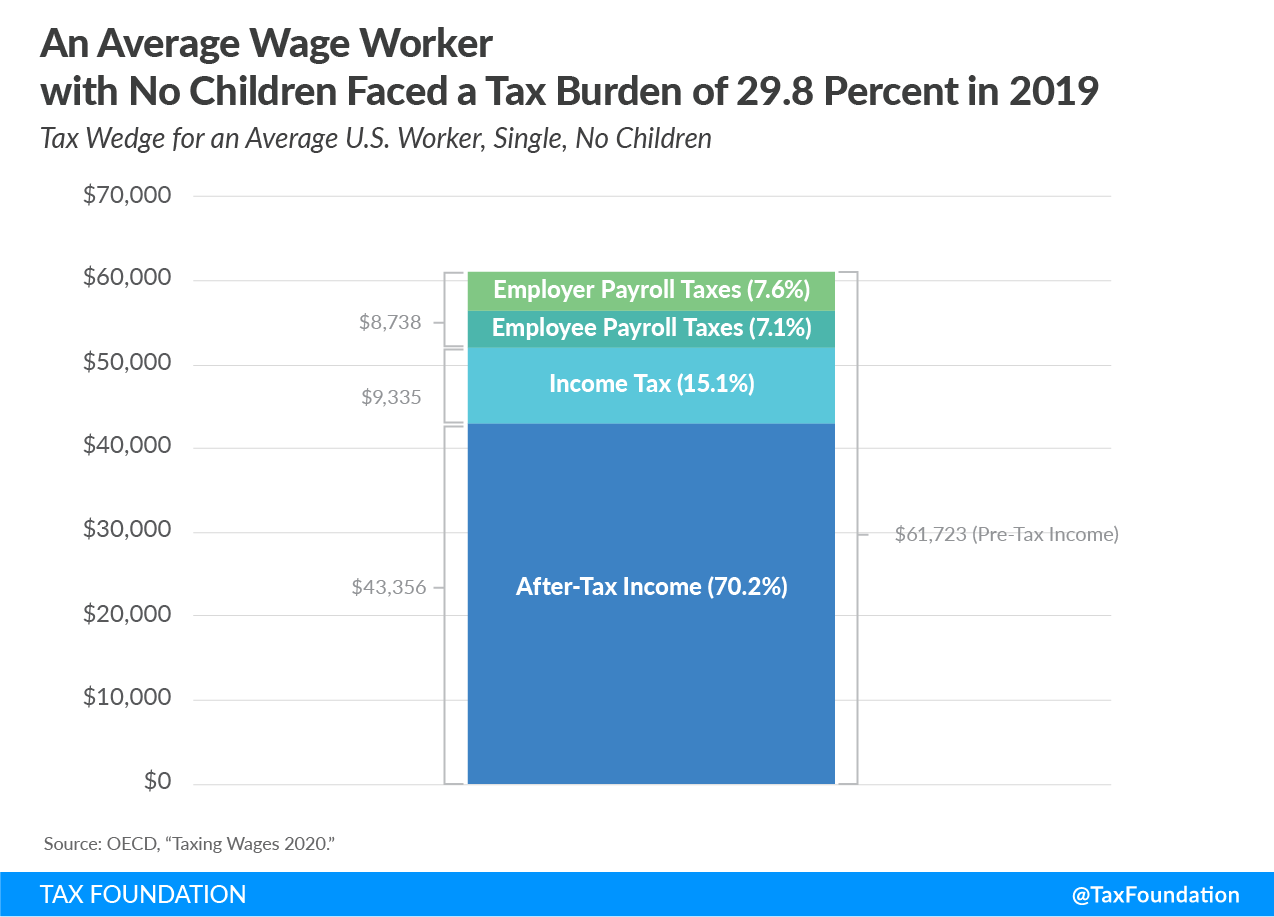
- Although slightly more than half of a U.S. worker’s payroll taxA payroll tax is a tax paid on the wages and salaries of employees to finance social insurance programs like Social Security, Medicare, and unemployment insurance. Payroll taxes are social insurance taxes that comprise 24.8 percent of combined federal, state, and local government revenue, the second largest source of that combined tax revenue. burden is paid by their employer, the worker ultimately pays this taxA tax is a mandatory payment or charge collected by local, state, and national governments from individuals or businesses to cover the costs of general government services, goods, and activities. through lower take-home pay. Before accounting for state and local sales taxes, the U.S. tax wedge—the tax burden that a single average wage earner faces—was 29.8 percent of pretax earnings in 2019, adding up to $18,368 in taxes.
- The U.S. tax wedgeA tax wedge is the difference between total labor costs to the employer and the corresponding net take-home pay of the employee. It is also an economic term that refers to the economic inefficiency resulting from taxes. of 29.8 percent has consistently been below the OECD average, which was 36 percent in 2019.
- The U.S. tax wedge rose by 0.2 percentage points in 2019, but remains about 2 percentage points lower than prior to the Tax Cuts and Jobs Act (TCJA) that reduced most individual income tax rates.
Introduction
Individual income taxes and payroll taxes make up a large share of tax revenue in the United States and together comprise the tax burden on labor. The U.S. tax code is progressive, combining a highly progressive individual income tax with a more regressive payroll tax.[1] While the U.S. code is progressive, the average worker is burdened by taxes. Due to provisions in the tax code that benefit families, the tax burden on families is often lower than the burden on single, childless workers earning an equivalent pretax income.
The Organisation for Economic Co-operation and Development (OECD) produces an annual report on the tax burden on labor in the U.S. and 35 other developed countries.[2] OECD data shows that single childless workers earning an average wage in the U.S. faced a tax burden from income and payroll taxes of 29.8 percent in 2019, up 0.2 percentage points from 2018’s rate of 29.6 percent.
The tax burden on labor in the U.S. remains lower than prior to the Tax Cuts and Jobs Act (TCJA), which reduced individual income tax rates beginning in 2018, reducing the tax burden on labor. The tax wedge in 2019 was 2 percentage points lower than in 2017, when single childless workers faced a tax wedge of 31.8 percent.
After accounting for sales taxes, which reduce the purchasing power of earnings, the tax wedge in the United States in 2019 was 31.6 percent.
Because there is a negative relationship between the tax wedge and employment, policymakers in the U.S. and other OECD countries should explore ways of making the taxation of labor less burdensome to improve labor market efficiency.[3] This will be important as policymakers pursue a strong labor market and economic recovery in the U.S. when the coronavirus outbreak subsides.[4]
Taxation of Wage Income in the United States
There are two major types of taxes that workers in the U.S. pay on wage income. First, individual income taxes are levied by federal, most state, and sometimes local governments to fund government services. Second, the federal government levies payroll taxes on both employees and employers. The economic burden, or incidence, of employer payroll taxes ultimately falls on wage earners. Payroll taxes fund federal programs such as Social Security, Medicare, and Unemployment Insurance (UI).
The tax wedge on labor income is the difference between total labor costs to the employer and the net take-home pay of the employee. To calculate a country’s tax wedge, the OECD adds the income tax payment, employee payroll tax payment, and employer-side payroll tax payment of a worker making the country’s average wage. The OECD divides this amount by the total labor cost of this average worker, or what the worker would have earned in the absence of these three taxes.
The United States’ tax wedge is the combined labor tax burden, which comprises the income tax, employee-side payroll tax, and employer-side payroll tax, divided by the total labor cost of the average worker (what the worker would have earned without the taxes). Unlike the tax wedge in many OECD countries, the U.S. tax wedge does not include a value-added tax (VAT) on consumption. However, the U.S. levies sales taxes on consumption at the state level (see below).
The Individual Income Tax
The federal individual income tax is the largest component of the tax burden on labor. In the United States, federal income taxes are graduated, meaning they are levied through a series of marginal tax bracketsA tax bracket is the range of incomes taxed at given rates, which typically differ depending on filing status. In a progressive individual or corporate income tax system, rates rise as income increases. There are seven federal individual income tax brackets; the federal corporate income tax system is flat. at progressive rates.[5] Beginning in tax year 2018, the TCJA lowered most individual income tax rates through tax year 2025. Each year, the Internal Revenue Service (IRS) increases the wage threshold of each bracket for inflation, meaning the individual income tax is indexed to inflationInflation is when the general price of goods and services increases across the economy, reducing the purchasing power of a currency and the value of certain assets. The same paycheck covers less goods, services, and bills. It is sometimes referred to as a “hidden tax,” as it leaves taxpayers less well-off due to higher costs and “bracket creep,” while increasing the government’s spending power. .
| Tax Rate | For Unmarried Individuals, Taxable Income Between | For Married Individuals Filing Joint Returns, Taxable Income Between | For Heads of Households, Taxable Income Between |
|---|---|---|---|
| >10% | >$0 – $9,874 | >$0 – $19,749 | >$0 – $14,099 |
| >12% | >$9,875 – $40,124 | >$19,750 – $80,249 | >$14,100 – $53,699 |
| >22% | >$40,125 – $85,524 | >$80,250 – $171,049 | >$53,700 – $85,499 |
| >24% | >$85,525 – $163,299 | >$171,050 – $326,599 | >$85,500 – $163,299 |
| >32% | >$163,300 – $207,349 | >$326,600 – $414,699 | >$163,300 – $207,349 |
| >35% | >$207,350 – $518,399 | >$414,700 – $622.049 | >$207.350 – $518,399 |
| >37% | >$518,400 and up | >$622,050 and up | >$518,400 and up |
| Source: Internal Revenue Service; Tax Foundation, “2020 Tax Brackets.” | |||
Payroll Taxes
The United States levies three major taxes on payroll. The first is a 12.4 percent tax used to fund Social Security, known as the old age, survivors, and disability insurance (OASDI) tax. This tax is levied beginning on the first dollar an individual earns in wages and self-employment income up to a cap of $137,700 in 2020. This cap is indexed to wage growth and typically rises each year. Legally, the tax is paid half by employers and half by employees, although employees bear the full economic cost of the tax.
The second tax is a 2.9 percent payroll tax to fund Medicare, known as the Medicare hospital insurance (HI) tax. This tax is also levied at the first dollar of wage and self-employment income but has no cap. As with the Social Security payroll tax, this tax is split evenly between employers and employees. An additional 0.9 percent Medicare payroll tax applies to earned income over $200,000 (this cap is not adjusted for inflation).[6]
| Social Security (OASDI) Tax | Medicare Hospital Insurance (HI) Tax | ||||
|---|---|---|---|---|---|
| Taxable Earnings | Employee | Employer | Employee | Employer | Total |
| $0-$137,700 | 6.20% | 6.20% | 1.45% | 1.45% | 15.3% |
| $137,700 – $200,000 | 0 | 0 | 1.45% | 1.45% | 2.9% |
| $200,00 and over | 0 | 0 | 2.35% | 1.45% | 3.8% |
| Source: Social Security Administration, “OASDI and SSI Program Rates & Limits, 2020.” | |||||
In addition to the employer-side taxes that fund Social Security and Medicare, there is a third payroll tax that funds Unemployment Insurance (UI). Unemployment Insurance is a joint federal-state social insurance program which insures workers against an unexpected loss of income if they lose their jobs. This tax is levied on the employer.
The federal unemployment tax is 6 percent on the first $7,000 of payroll, known as the taxable wage base.[7] However, states also set UI tax rates to fund their portion of the program. State UI tax rates and bases can vary widely, depending on how often an individual employer’s workers receive unemployment benefits (determined via an employer’s experience rating). If an employer is likely to hire and fire her employees at a higher than normal rate, the employer will face a higher tax rate. However, the federal and state tax rates are not additive. Employers can credit 90 percent of their state tax against the federal tax, reducing the federal rate to as low as 0.6 percent.
Although payroll taxes are typically split between workers and their employers, economists generally agree that the burden of both sides of the payroll tax falls on workers. In tax policy, there is an important distinction between the legal and the economic incidence of a tax. The legal incidence of a tax falls on the party that is legally required to write the check to the tax collector.
However, the party who legally pays a tax is not always the one who ultimately bears the burden of the tax. The economic incidence of a tax falls on a wider group of people and is determined by how people and businesses respond to a tax, with the less responsive parties more likely to bear the economic burden of the tax.[8]
U.S. Tax Burden on Labor for Single Workers with No Children
In 2019, the United States’ tax wedge for a single worker with no children was 29.8 percent, below the OECD average of 36 percent. Put another way, a worker in the United States in 2019, making an average wage of $61,723 annually, kept 70.2 percent of that income, or $43,356.
Income taxes made up the largest part of the tax wedge at 15.1 percent, or, on average, $9,335—slightly above the OECD average of 13.8 percent, as many other countries have higher payroll taxes on employers rather than direct income taxes. In total, the average U.S. tax wedge was $18,368.
U.S. Tax Wedge Holds Steady Two Years after Tax Reform
The U.S. tax wedge rose slightly, by 0.2 percentage points, from 2018 to 2019: 29.6 percent to 29.8 percent. The tax wedge remains 2 percentage points lower than pre-TCJA, when it was 31.8 percent in 2017.
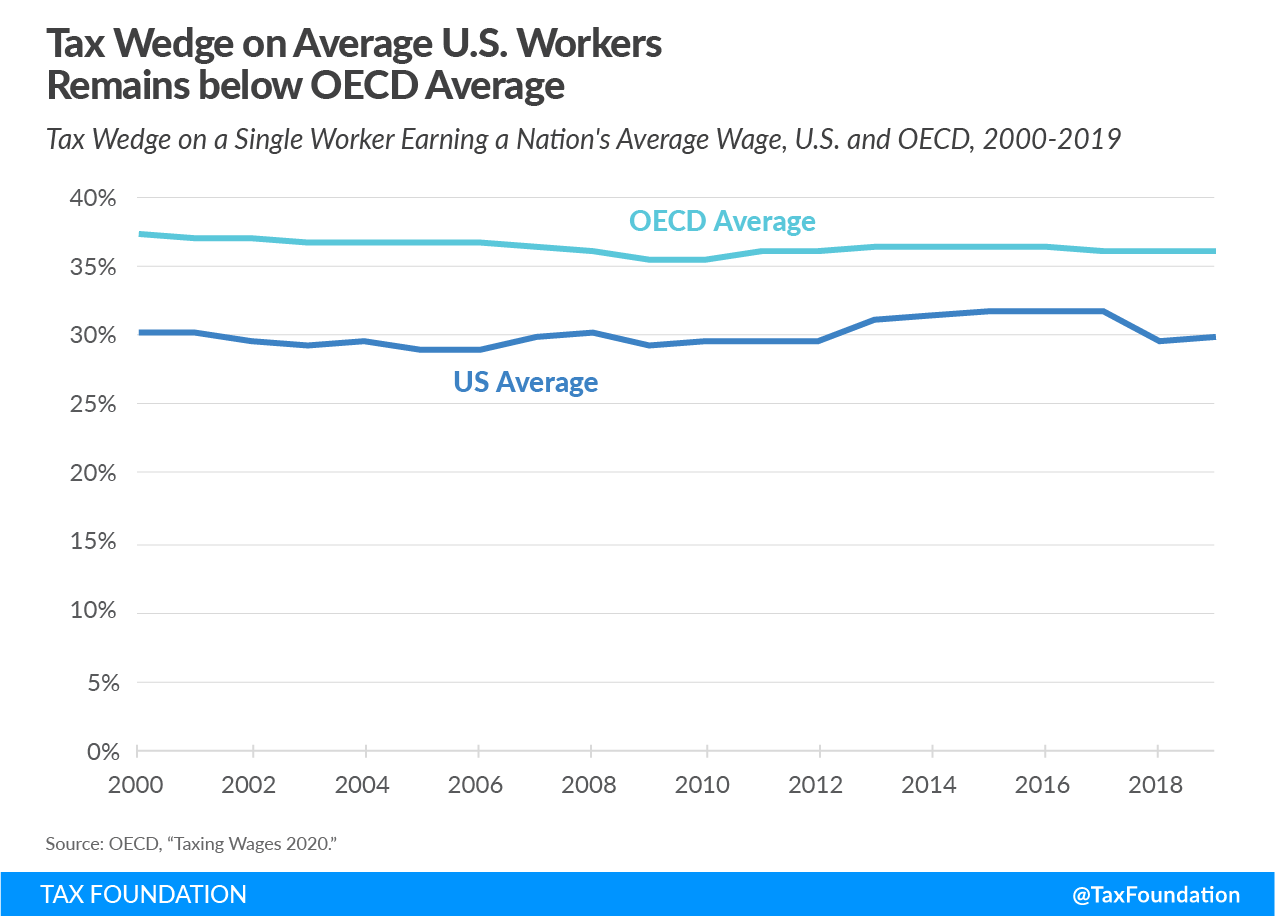
The OECD average fell slightly, from 36.1 percent in 2018 to 36 percent in 2019. The U.S. tax wedge has remained below the OECD average since 2000, and the gap widened after tax reform in 2017, which reduced individual income tax rates and doubled the standard deduction. Lower taxes result in a higher net take-home pay, and therefore a smaller tax wedge.
Family Composition and the Tax Burden
Like many OECD countries, the U.S. provides targeted tax relief to families with children. This relief includes refundable tax credits such as the Child Tax CreditA tax credit is a provision that reduces a taxpayer’s final tax bill, dollar-for-dollar. A tax credit differs from deductions and exemptions, which reduce taxable income rather than the taxpayer’s tax bill directly. (CTC) and additional credits for low-income families with children through the Earned Income Tax Credit (EITC).[9]
The average tax wedge for families in the U.S. was 18.8 percent in 2019, compared to the 29.8 percent average tax wedge for single workers with no children. The OECD average tax wedge for families is 26.4 percent, compared to the 36 percent average tax wedge for single workers. These two tax wedges, single and family, are based on the same pretax wages (referred to as labor cost) because a “family” refers to a two-child family with just one income earner.
Average and Marginal Tax Wedges
Comparing the tax wedge for the average worker in the U.S. to the tax wedge for average workers in other OECD countries is only a partial representation of how taxes on labor affect the economy by changing incentives to work and by raising revenue for government at the federal, state, provincial, or local levels.
The OECD calculates two types of tax wedge: average and marginal. The average tax wedge is what has been discussed so far: the combined share of labor and payroll taxes relative to total labor costs, or the tax burden. The marginal tax wedge, by contrast, is the share of labor and payroll taxes applied to the next dollar earned and can influence individuals’ decisions to work.
The marginal tax wedge is generally higher than the average tax wedge due to the progressivity of taxes on labor—as workers earn more, they face a higher tax wedge on their marginal dollar of earnings. The marginal tax wedge in the U.S. is 38.5 percent, compared to an average tax wedge of 29.8 percent. Targeted tax relief for families with children helps lower the tax burden on labor, but also increases the marginal tax rateThe marginal tax rate is the amount of additional tax paid for every additional dollar earned as income. The average tax rate is the total tax paid divided by total income earned. A 10 percent marginal tax rate means that 10 cents of every next dollar earned would be taken as tax. on labor as the relief phases out when families earn additional income.[10] This creates a disincentive for families with children to earn additional labor income as this relief phases out.
Directly comparing marginal tax wedges across countries is less informative. Many countries’ marginal tax wedges are higher than others simply because their overall tax burden is high. One way to examine the efficiency of labor taxation in a country is to control for the level of labor taxation by taking the ratio of the marginal tax wedge to the average tax wedge. The ratio of the marginal tax wedge to the average tax wedge for a country is a rough proxy for the economic cost of a government funding $1 more of revenue through taxes on labor, at any given level of labor taxation.
In the U.S., the ratio of the marginal tax wedge to the average tax wedge is $1.24—in other words, $1.24 is the cost in the U.S. of raising an additional dollar in revenue from taxes on the workforce. This matches the OECD average ratio.
Accounting for Consumption Taxes
The tax burden on labor is broader than personal income taxes and payroll taxes. Many countries also impose a VAT on consumption. Because a VAT diminishes the purchasing power of individual earnings, a more complete picture of the tax burden should include the VAT. Although the U.S. does not have a VAT, state sales taxes diminish the value of earnings.
Accounting for state sales taxes, the U.S. tax wedge is 31.6 percent, slightly above the 29.8 percent tax wedge without state sales taxes. The OECD average VAT-inclusive tax wedge is 41.5 percent, compared to a VAT-exclusive tax wedge of 36.0 percent. The U.S. has a relatively small difference between the two measurements—1.8 percentage points—compared to the OECD average difference of 5.5 percentage points, because state sales taxes as a share of total labor costs are generally much lower than VAT rates in other OECD countries.
Tax Burden in the U.S by Employment Form
The tax burden on labor in the U.S. varies by form of employment in addition to income level, filing status, and number of children. In the United States, workers may be classified as employees or as independent contractors who contract with specific firms. Alternatively, workers may set up sole proprietorships or similar “pass-through” businesses as a form of self-employment.
The tax wedge on employees and sole proprietors in the United States is 31.8 percent. Employees and sole proprietors remit individual income taxes and payroll (or self-employment) taxes on earned income.[11] The payment wedge, which includes non-tax compulsory payments, is slightly higher for the U.S. employees at 32.7 percent, as employers also pay workers compensation on behalf of employees at the state level.[12]
It is important to note that while the employee and sole proprietor tax wedges are equal, many self-employed workers (such as gig economy workers) face unique challenges in complying with the tax code and remitting self-employment tax.[13]
Conclusion
Although the U.S. has a progressive taxA progressive tax is one where the average tax burden increases with income. High-income families pay a disproportionate share of the tax burden, while low- and middle-income taxpayers shoulder a relatively small tax burden. system and a relatively low tax burden compared to the OECD average, average-wage workers still pay about 30 percent of their wages in taxes. Individual income taxes and payroll taxes together make up the tax burden on labor in the U.S., which increased slightly in 2019 but remains below the levels faced by workers prior to the TCJA.
To make the taxation of labor more efficient, policymakers in the U.S. and abroad should understand how the tax wedge is generated, and taxpayers should understand how their tax burden funds government services. This will be particularly important as policymakers explore way to encourage a robust economic recovery after the coronavirus crisis abates.
Methodology
Ratio of Marginal to Average Tax Wedge
The ratio of marginal to average tax wedges is calculated using the OECD data of marginal and average total tax wedges at four levels of income for single individuals without dependents. It is the average of marginal total tax wedges at 67 percent, 100 percent, 133 percent, and 167 percent of average earnings divided by the average of average total tax wedges at 67 percent, 100 percent, 133 percent, and 167 percent of average earnings.
Tax Wedges Accounting for VAT
The formula for calculating tax wedges that account for VAT utilizes the VAT rates and the VAT revenue ratio (VRR) from the OECD’s “What drives consumption taxA consumption tax is typically levied on the purchase of goods or services and is paid directly or indirectly by the consumer in the form of retail sales taxes, excise taxes, tariffs, value-added taxes (VAT), or an income tax where all savings is tax-deductible. revenues?” taxation working paper.[14],[15] We first calculate the tax-inclusive VAT rate, which is VAT rate/(1 + VAT rate). Next, we multiply the tax-inclusive VAT rate by the VAT revenue ratio and by the total labor cost to calculate the VAT amount. The formula for calculating the tax wedge including the VAT is then:

VAT/sales taxes are in both the numerator and the denominator because the tax wedge is taxes on labor as a share of total labor costs. For employees, VAT/sales taxes are part of taxes on labor, and they are also part of the total labor costs that employers face. By definition, a VAT is the rate of tax placed on the value added by a business by employing capital and labor. The added value is measured by the difference between the purchase price of materials and the sale of those materials (most often after a business turns those materials into something more useful). Though businesses may raise prices to pass the cost of a VAT or sales taxA sales tax is levied on retail sales of goods and services and, ideally, should apply to all final consumption with few exemptions. Many governments exempt goods like groceries; base broadening, such as including groceries, could keep rates lower. A sales tax should exempt business-to-business transactions which, when taxed, cause tax pyramiding. on to consumers in the short run, over the long run, the economic incidence of the VAT falls on workers.[16]
[1] Robert Bellafiore, “America Already Has a Progressive Tax System,” Tax Foundation, Jan. 11, 2019, https://taxfoundation.org/america-progressive-tax-system/.
[2] OECD, “Taxing Wages 2020,” Apr. 30, 2020, https://oecd.org/ctp/tax-policy/taxing-wages-20725124.htm.
[3] Scott A. Hodge and Bryan Hickman, “The Importance of the Tax Wedge on Labor in Evaluating Tax Systems,” Tax Foundation, 2018, /wp-content/uploads/2018/09/Global-Primer_tax_wedge.pdf.
[4] Scott A. Hodge, Jared Walczak, Karl Smith, and Daniel Bunn, “Tax Policy After Coronavirus: Clearing a Path to Economic Recovery,” Tax Foundation, Apr. 22, 2020, https://taxfoundation.org/coronavirus-economic-recovery/.
[5] Amir El-Sibaie, “2020 Tax Brackets,” Tax Foundation, Nov.14, 2019, https://taxfoundation.org/2020-tax-brackets/.
[6] Social Security Administration, “OASDI and SSI Program Rates & Limits, 2020,” October 2019, https://ssa.gov/policy/docs/quickfacts/prog_highlights/index.html.
[7] “Form 940 – Employer’s Annual Federal Unemployment (FUTA) Tax Return – Filing and Deposit Requirements,” Internal Revenue Service, https://irs.gov/taxtopics/tc759.
[8] This is also known as the relative elasticities of supply and demand for a taxed good.
[9] See generally, Taylor LaJoie, “The Child Tax Credit: A Primer,” Tax Foundation, Apr. 14, 2020, https://taxfoundation.org/child-tax-credit/ and Robert Bellafiore, “The Earned Income Tax Credit: A Primer,” Tax Foundation, May 21, 2019, https://taxfoundation.org/earned-income-tax-credit-eitc/.
[10] Garrett Watson, “Marginal Tax Rates on Labor Income in the U.S. After the Tax Cuts and Jobs Act,” Tax Foundation, Feb. 20, 2020, https://taxfoundation.org/marginal-tax-rates-on-labor-income-in-the-us-after-2017-tax-law/.
[11] OECD, “Taxing Wages 2020.”
[12] Ibid.
[13] See generally, Garrett Watson, “Improving the Federal Tax System for Gig Economy Participants,” Tax Foundation, Oct. 18, 2019, https://taxfoundation.org/gig-economy-workers/.
[14] OECD, “What Drives Consumption Tax Revenues?” 2020, https://doi.org/10.1787/94ed8187-en.
[15] The most recent OECD data available for the VAT revenue ratio is from 2017. VAT rates are from 2018. The U.S. sales tax rate is the average of all U.S. state sales tax rates (weighted by population); see Jared Walczak and Scott Drenkard, “State and Local Sales Tax Rates 2018,” Tax Foundation, Feb. 13, 2018, https://taxfoundation.org/state-and-local-sales-tax-rates-2018/. The U.S. sales tax revenue ratio was calculated as the ratio of the implicit sales tax base to state personal income.
[16] Eric Toder, James R. Nunns, and Joseph Rosenberg, “Implications of Different Bases for a VAT,” Tax Policy Center and The Pew Charitable Trusts, Feb. 14, 2012, https://taxpolicycenter.org/publications/implications-different-bases-vat/full.
Share this article