Related Research
Key Findings
- Average wage earners in the United States face two major taxes: the individual income taxAn individual income tax (or personal income tax) is levied on the wages, salaries, investments, or other forms of income an individual or household earns. The U.S. imposes a progressive income tax where rates increase with income. The Federal Income Tax was established in 1913 with the ratification of the 16th Amendment. Though barely 100 years old, individual income taxes are the largest source of tax revenue in the U.S. and the payroll taxA payroll tax is a tax paid on the wages and salaries of employees to finance social insurance programs like Social Security, Medicare, and unemployment insurance. Payroll taxes are social insurance taxes that comprise 24.8 percent of combined federal, state, and local government revenue, the second largest source of that combined tax revenue. (levied on both the employee and the employer).
- Although slightly more than half of a U.S. worker’s payroll taxA tax is a mandatory payment or charge collected by local, state, and national governments from individuals or businesses to cover the costs of general government services, goods, and activities. burden is paid by his employer, the worker ultimately pays this tax through lower take-home pay. Before accounting for state and local sales taxes, the U.S. tax wedgeA tax wedge is the difference between total labor costs to the employer and the corresponding net take-home pay of the employee. It is also an economic term that refers to the economic inefficiency resulting from taxes. —the tax burden that a single average wage earner faces—was 29.6 percent of pre-tax earnings in 2018, amounting to $17,596 in taxes.
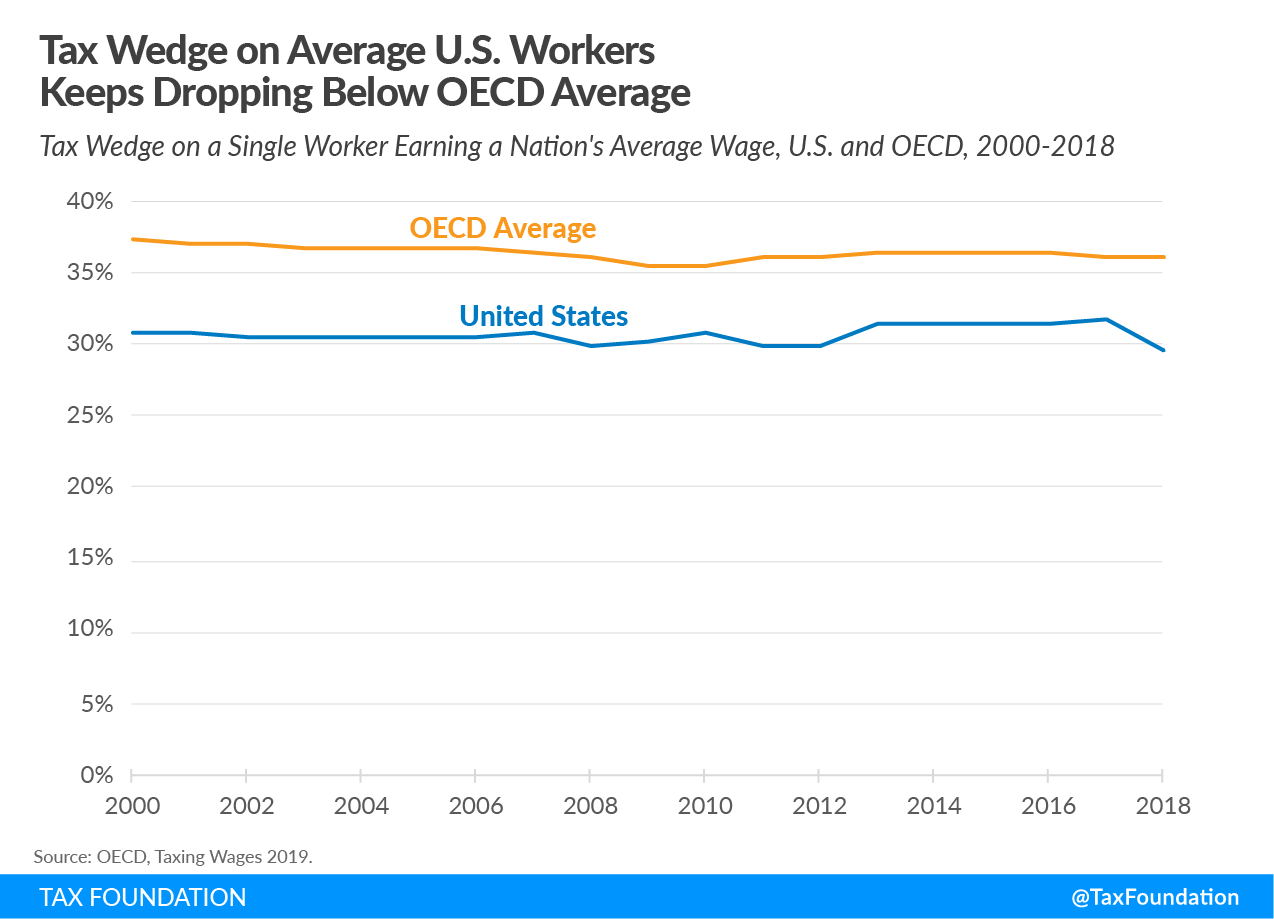
- The U.S. tax wedge has consistently been below the OECD average, which was 36.1 percent in 2018.
- The U.S. tax wedge fell by 2.2 percentage points in 2018 as a result of the Tax Cuts and Jobs Act’s (TCJA) individual income tax cuts. The TCJA’s lowering of most individual income tax rates, along with several other changes, reduced tax bills for 80 percent of taxpayers in 2018, resulting in a higher net take-home pay, and therefore in a smaller tax wedge.
Introduction
Individual income taxes and payroll taxes make up a large share of tax revenue in the United States and together comprise the tax burden on labor. The Organisation for Economic Co-operation and Development (OECD) reports data on the tax burden on labor in the U.S. and 35 other developed countries.[1]
Although the overall U.S. tax code is progressive—in other words, higher-income workers are taxed at higher rates—the average worker is still burdened by taxes.[2] Additionally, the tax burden on families is often lower than the burden on single, childless workers making the same pre-tax income.
The most recent OECD data shows that single childless workers earning an average wage in the U.S. faced a tax burden from income and payroll taxes of 29.6 percent in 2018, down 2.2 percentage points from 2017’s rate of 31.8 percent. The cause of this decrease in the U.S. tax wedge was the Tax Cuts and Jobs Act (TCJA), which reduced individual income tax rates beginning in 2018, lowering the tax burden on labor. After accounting for sales taxes, which reduce the purchasing power of earnings, the tax wedge in the United States is 31.5 percent.
Because there is a negative relationship between the tax wedge and employment, policymakers in the U.S. and other OECD countries should explore ways of making the taxation of labor less burdensome to improve labor market efficiency.[3]
Taxation of Wage Income in the United States
There are two major types of taxes that wage earners in the U.S. pay. First, individual income taxes are levied by federal, most state, and sometimes local governments to fund the general operations of government. Second, governments levy payroll taxes on both employees and employers, though the economic burden, or incidence, of both ultimately falls on wage earners. Payroll taxes fund programs such as Social Security, Medicare, and Unemployment Insurance.
The tax wedge on labor income is the difference between total labor costs to the employer and the corresponding net take-home pay of the employee. To calculate a country’s tax wedge, the OECD adds the income tax payment, employee payroll tax payment, and employer-side payroll tax payment of a worker making the country’s average wage. The OECD then divides this figure by the total labor cost of this average worker, or what the worker would have earned in the absence of these three taxes.
The United States’ tax wedge is the combined labor tax burden, which comprises the income tax, employee payroll tax, and employee-side payroll tax, divided by the total labor cost of the average worker (what the worker would have earned without the taxes). Unlike the tax wedge in many OECD countries, the U.S. tax wedge does not include a value-added tax (VAT) on consumption. However, the U.S. does have a sales tax on consumption (discussed below).
The Individual Income Tax
Federal income taxes are the most familiar component of taxation on labor. In the United States, federal income taxes are levied via a system of brackets at progressive rates.[4] The Tax Cuts and Jobs Act lowered most individual income tax rates.
| Rate | For Unmarried Individuals, Taxable Income Over | For Married Individuals Filing Joint Returns, Taxable Income Over | For Heads of Households, Taxable Income Over |
|---|---|---|---|
| Source: Tax Foundation, “2019 Tax Brackets.” | |||
| 10% | $0 | $0 | $0 |
| 12% | $9,700 | $19,400 | $13,850 |
| 22% | $39,475 | $78,950 | $52,850 |
| 24% | $84,200 | $168,400 | $84,200 |
| 32% | $160,725 | $321,450 | $160,700 |
| 35% | $204,100 | $408,200 | $204,100 |
| 37% | $510,300 | $612,350 | $510,300 |
Payroll Taxes
The United States levies two major payroll taxes. The first is a 12.4 percent tax used to fund Social Security. This tax is levied beginning on the first dollar an individual earns in wages and self-employment income up to a cap of $132,900 in 2019. This cap is adjusted to wage and changes each year. Legally, the tax is paid half by employers and half by employees, although employees bear the full economic cost of the tax.
The second is a 2.9 percent payroll tax to fund Medicare. This tax is also levied beginning on the first dollar of income but has no cap. As with the Social Security payroll tax, this tax is split evenly between employers and employees. An additional 0.9 percent Medicare payroll tax applies to earned income over $200,000 (this cap is not adjusted for inflationInflation is when the general price of goods and services increases across the economy, reducing the purchasing power of a currency and the value of certain assets. The same paycheck covers less goods, services, and bills. It is sometimes referred to as a “hidden tax,” as it leaves taxpayers less well-off due to higher costs and “bracket creep,” while increasing the government’s spending power. ).[5]
| Social Security | Medicare | ||||
|---|---|---|---|---|---|
| Source: Social Security Administration, “OASDI and SSI Program Rates & Limits, 2019.” | |||||
| Taxable Earnings | Employee | Employer | Employee | Employer | Total |
| $0-$132,900 | 6.20% | 6.20% | 1.45% | 1.45% | 15.3% |
| 132,900-$200,000 | 0 | 0 | 1.45% | 1.45% | 2.9% |
| $200,000 and over | 0 | 0 | 2.35% | 1.45% | 3.8% |
Unemployment Insurance Taxes
In addition to the employer-side taxes that fund Medicare and Social Security, there is a third payroll tax, to fund Unemployment Insurance (UI). Unemployment Insurance is a joint federal-state social insurance program that insures workers against an unexpected loss of income due to losing one’s job. The tax that funds this program is levied on the employer.
The federal unemployment tax is 6 percent on the first $7,000 of payroll. However, states also set UI tax rates to fund their portion of the program. State UI tax rates and bases can vary substantially, depending on how frequently an individual employer’s workers receive unemployment benefits. If an employer is likely to hire and fire her employees at a higher than normal rate, the employer will face a higher tax rate. However, the federal and state tax rates are not additive. Employers can credit 90 percent of their state tax against the federal tax, reducing the federal rate to as low as 0.6 percent.[6]
The Economic Incidence of Payroll Taxes
Although payroll taxes are typically split between workers and their employers, economists generally agree that both sides of the payroll tax ultimately fall on workers.
In tax policy, there is an important distinction between the “legal” and the “economic” incidence of a tax. The legal incidence of a tax falls on the party that is legally required to write the check to the tax collector.
However, the party that legally pays a tax is not always the one that ultimately bears the burden of the tax. The “economic” incidence of a tax can fall on any number of people and is determined by the relative elasticities of supply and demand of a taxed good, or how people and businesses respond to a tax.[7]
U.S. Single Workers with No Children
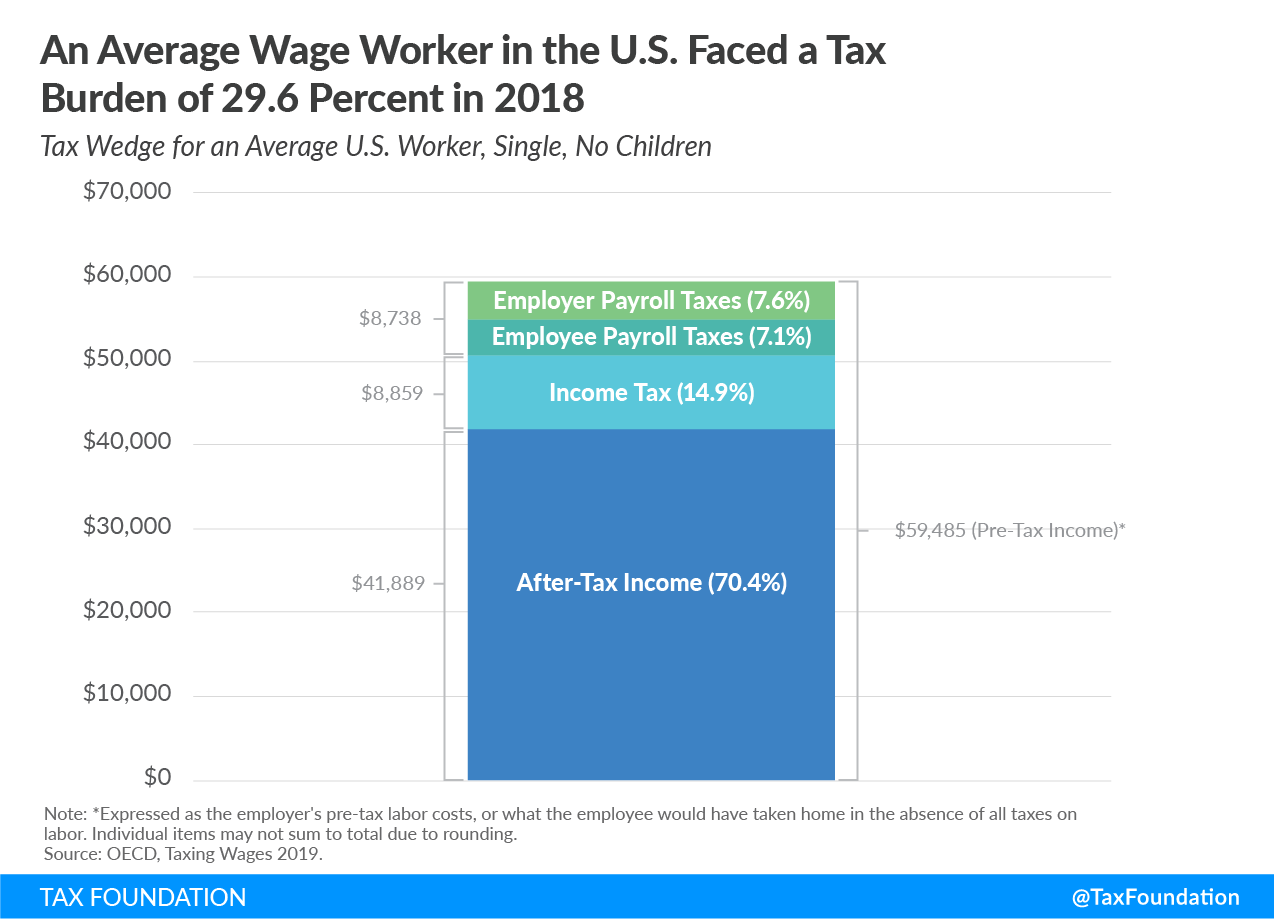
In 2018, the United States’ tax wedge for a single worker with no children was 29.6 percent, below the OECD average of 36.1 percent. In other words, a worker in the United States in 2018, making an average wage of $59,485 annually, kept 70.4 percent of that income, or $41,889. Income taxes made up the largest part of the tax wedge at 14.9 percent, or, on average, $8,859—slightly above the OECD average of 13.5 percent, as many other countries have higher payroll taxes on employers rather than direct income taxes. In total, the average U.S. tax wedge was $17,596.
Figure 1.
Tax Reform Brought the U.S. Tax Wedge Further Below the OECD Average
The U.S. tax wedge fell by 2.2 percentage points in 2018, from 31.8 percent in 2017 to 29.6 percent. The OECD average fell by a lesser amount, from 36.2 percent to 36.1 percent. [8] Although the U.S. tax wedge has consistently been below the OECD average, it is now even further below.
Figure 2.
The primary cause of the 2.2 percentage-point decline in the U.S. tax wedge was the TCJA’s individual income tax cuts, which reduced the income tax by 2.1 percentage points. A decrease of the payroll tax accounted for the remaining .1 percentage points. The TCJA’s lowering of most individual income tax rates, along with several other changes, reduced tax bills for 80 percent of taxpayers in 2018.[9] Lower taxes result in a higher net take-home pay, and therefore in a smaller tax wedge.
Family Composition and the Tax Burden
Like many OECD countries, the U.S. provides some targeted tax relief for families with children. The average tax wedge for families in the U.S. is 18.5 percent, compared to the 29.6 percent average tax wedge for single workers with no children. The OECD average tax wedge for families is 26.6 percent, compared to the 36.1 percent average tax wedge for single workers. These two tax wedges, single and family, are based on the same pre-tax wages (referred to as labor cost) because a “family” refers to a two-child family with just one income earner.
Average and Marginal Tax Wedges
Comparing the tax wedge on the average worker in the U.S. to the tax wedge in other OECD countries is only a partial representation of how taxes on labor affect the economy, both by changing incentives to work and by raising revenue for the government at various levels.
The OECD calculates two types of tax wedge: average and marginal. The average tax wedge is what has been discussed so far: the combined share of labor and payroll taxes relative to total labor costs, or the tax burden. The marginal tax wedge, in contrast, is the share of labor and payroll taxes applicable to the next dollar earned and can influence individuals’ decisions to work. The marginal tax wedge is generally higher than the average tax wedge due to the progressivity of taxes on labor—as workers earn more, they face a higher tax wedge on their marginal dollar of earnings. The marginal tax wedge in the U.S. is 38.5 percent, compared to an average tax wedge of 29.6 percent.
Directly comparing marginal tax wedges across countries is less informative. Many countries’ marginal tax wedges are higher than others simply because their overall tax burden is high. One way to examine the efficiency of labor taxation in a country is to control for the level of labor taxation by taking the ratio of the marginal tax wedge to the average tax wedge. The ratio of the marginal tax wedge to the average tax wedge for a country is a rough proxy for the economic cost of a government funding $1 more of revenue through taxes on labor, at any given level of labor taxation.
In the U.S., the ratio of the marginal tax wedge to the average tax wedge is $1.25—in other words, $1.25 is the cost in the U.S. of raising an additional dollar in revenue from taxes on the workforce. The OECD average ratio is slightly lower, at $1.23.
Accounting for Consumption Taxes
The tax burden on labor is broader than personal income taxes and payroll taxes. Many countries also impose a VAT on consumption. Because a VAT diminishes the purchasing power of individual earnings, a more complete picture of the tax burden should include the VAT. Although the U.S. does not have a VAT, state sales taxes diminish the value of earnings.
Accounting for state sales taxes, the U.S. tax wedge is 31.5 percent, slightly above the 29.6 percent tax wedge without state sales taxes. The OECD average VAT-inclusive tax wedge is 41.1 percent, compared to a VAT-exclusive tax wedge of 36.1 percent. The U.S. has a relatively small difference between the two measurements—1.9 percentage points—compared to the OECD average difference of 5 percentage points, because state sales taxes as a share of total labor costs are generally much lower than VAT rates in other OECD countries.
Conclusion
Although the U.S. has a progressive tax system and a relatively low tax burden compared to the OECD average, average-wage workers still pay about one-third of their wages in taxes. Individual income taxes and payroll taxes together make up the tax burden on labor in the U.S., which did decrease in 2018 as a result of the TCJA’s individual income tax cuts. To make the taxation of labor more efficient, policymakers in the U.S. and abroad should understand how the tax wedge is generated, and taxpayers should understand the extent to which they shoulder the costs of government services.
Methodology
Ratio of Marginal to Average Tax Wedge
The ratio of marginal to average tax wedges is calculated using the OECD data of marginal and average total tax wedges at four levels of income for single individuals without dependents. It is the average of marginal total tax wedges at 67 percent, 100 percent, 133 percent, and 167 percent of average earnings divided by the average of average total tax wedges at 67 percent, 100 percent, 133 percent, and 167 percent of average earnings.
Tax Wedges Accounting for VAT
The formula for calculating tax wedges that account for VAT utilizes the VAT rates and the VAT revenue ratio (VRR) from the OECD’s “Consumption TaxA consumption tax is typically levied on the purchase of goods or services and is paid directly or indirectly by the consumer in the form of retail sales taxes, excise taxes, tariffs, value-added taxes (VAT), or an income tax where all savings is tax-deductible. Trends” report.[10],[11] We first calculate the tax-inclusive VAT rate, which is VAT rate/(1 + VAT rate). Next, we multiply the tax-inclusive VAT rate by the VAT revenue ratio and by the total labor cost to calculate the VAT amount. The formula for calculating the tax wedge including the VAT is then:
(Income Taxes + Employer and Employee Payroll Taxes + VAT/Sales Taxes)
(Total Labor Cost + VAT/Sales Taxes)
VAT/sales taxes are in both the numerator and the denominator because the tax wedge is taxes on labor as a share of total labor costs. For employees, VAT/sales taxes are part of taxes on labor, and they are also part of the total labor costs that employers face. By definition, a value-added tax is the rate of tax placed on the value added by a business by employing capital and labor. The added value is measured by the difference between the purchase price of materials and the sale of those materials (most often after a business turns those materials into something more useful). Though businesses may raise prices to pass the cost of a VAT or sales taxA sales tax is levied on retail sales of goods and services and, ideally, should apply to all final consumption with few exemptions. Many governments exempt goods like groceries; base broadening, such as including groceries, could keep rates lower. A sales tax should exempt business-to-business transactions which, when taxed, cause tax pyramiding. on to consumers in the short run, over the long run, the economic incidence of the VAT falls on workers.[12]
[1] OECD, “Taxing Wages 2019,” April 11, 2019, https://www.oecd.org/ctp/tax-policy/taxing-wages-20725124.htm.
[2] Robert Bellafiore, “America Already Has a Progressive TaxA progressive tax is one where the average tax burden increases with income. High-income families pay a disproportionate share of the tax burden, while low- and middle-income taxpayers shoulder a relatively small tax burden. System,” Tax Foundation, Jan. 11, 2019, https://taxfoundation.org/america-progressive-tax-system/.
[3] Scott A. Hodge and Bryan Hickman, “The Importance of the Tax Wedge on Labor in Evaluating Tax Systems,” Tax Foundation, 2018, /wp-content/uploads/2018/09/Global-Primer_tax_wedge.pdf.
[4] Amir El-Sibaie, “2019 Tax BracketsA tax bracket is the range of incomes taxed at given rates, which typically differ depending on filing status. In a progressive individual or corporate income tax system, rates rise as income increases. There are seven federal individual income tax brackets; the federal corporate income tax system is flat. ,” Tax Foundation, Nov. 28, 2018, https://taxfoundation.org/2019-tax-brackets/.
[5] Social Security Administration, “OASDI and SSI Program Rates & Limits, 2019,” October 2018, https://www.ssa.gov/policy/docs/quickfacts/prog_highlights/RatesLimits2019.html.
[6] Joseph Bishop-Henchman, “Unemployment Insurance Taxes: Options for Program Design and Insolvent Trust Funds,” Tax Foundation, Oct. 17, 2011, https://taxfoundation.org/unemployment-insurance-taxes-options-program-design-and-insolvent-trust-funds.
[7] Congressional Budget Office, “The Distribution of Household Income and Federal Taxes, 2013,” June 8, 2016, https://www.cbo.gov/publication/51361.
[8] A previous Tax Foundation report, “A Comparison of the Tax Burden on Labor in the OECD, 2018,” stated that the 2017 U.S. tax wedge was 31.7 percent, and that the 2017 OECD average tax wedge was 35.9 percent. The OECD has since updated its data for 2017.
[9] Tax Foundation staff, “Preliminary Details and Analysis of the Tax Cuts and Jobs Act,” Dec. 18, 2017, https://taxfoundation.org/final-tax-cuts-and-jobs-act-details-analysis/.
[10] OECD, “Consumption Tax Trends 2018,” Dec. 5, 2018, http://www.oecd.org/tax/consumption-tax-trends-19990979.htm.
[11] The most recent OECD data available for the VAT revenue ratio is from 2016. VAT rates are from 2018. The U.S. sales tax rate is the average of all U.S. state sales tax rates (weighted by population); see Jared Walczak and Scott Drenkard, “State and Local Sales Tax Rates 2018,” Tax Foundation, Feb. 13, 2018, https://taxfoundation.org/state-and-local-sales-tax-rates-2018/. The U.S. sales tax revenue ratio was calculated as the ratio of the implicit sales tax base to state personal income.
[12] Eric Toder, Jim Nunns, and Joseph Rosenberg, “Implications of Different Bases for a VAT,” Tax Policy Center and The Pew Charitable Trusts, February 2012, https://www.taxpolicycenter.org/publications/implications-different-bases-vat/full.
Share this article